Unit 1 – Pre-Calculus Review
Worksheets

AP Calculus AB - Worksheet 1 Linear Functions
In exercises 1-3, let L be the line determined by points A and B. Find the slope of line L and the line perpendicular to line
L.
1.
( ) ( )
1, 2 , 2,1AB−
2.
( ) ( )
2, 1 , 1, 2AB− − −
3.
( ) ( )
1,2 , 1, 3AB−
In exercises 4-6, write an equation for (a) the vertical line and (b) the horizontal line though the point P.
4.
( )
3,2P
5.
( )
0, 2P −
6.
,
4
P
−
In exercises 7-9, write an equation for the line (point-slope form) through the given point P with slope m.
7.
( )
1,2 , 1Pm=
8.
( )
4,0 , 2Pm− = −
9.
( )
2
,,
2
Pm
−=
In exercises 10-12, write an equation for the line (point-slope form) that goes through the two points.
10.
( ) ( )
0,0 , 2,3
11.
1 7 3
, , 0,
2 2 4
12.
( ) ( )
1, 2 , 3, 2−−
In exercises 13-15, find the (a) slope, (b) x-intercept and (c) y-intercept of the graph of each line.
13.
3 4 12xy+=
14.
1
34
xy
+=
15.
4x =
In exercises 16-19 you are given an equation for line L. Write the equations for the lines that pass through point P that are
(a) parallel to L,
(b) perpendicular to L.
16.
( )
2,2 , :2 4P L x y− + =
17.
( )
6,4 , :3 4 7P L x y− + =
18.
1
1, , : 3
2
P L y−=
In exercises 20 and 21, a table of values is given for the line function
( )
f x mx b=+
. Determine
( )
10f
.
19. 20.
In exercises 22 and 23, find the value of x or y for which the line through A and B has the given slope m.
21.
( ) ( )
2
2,3 , 4, ,
3
A B y m− = −
22.
( ) ( )
8, 2 , ,2 , 2A B x m− − =
23. Parallel and Perpendicular Lines Given the equations of two lines,
23x ky+=
and
1xy+=
:
(a) what would be the value of k in order for the lines to be parallel?
(b) what would be the value of k in order for the lines to be perpendicular?

AP Calculus AB – Worksheet 2 Algebraic Representation of Functions
Build your own dreams, or somebody else will hire you to build theirs.
Given the function(s), find the indicated values.
1
( )
2
3f x x=−
; Find:
( )
( )
( )
a) 0 b) 3 c) 2f f f −
2
( )
cos , 0
2 , 0
xx
fx
xx
=
; Find
( ) ( )
( )
2
a) b) 0 c) 1 d)
4
f f f f a
−
3
( )
2
32f x x x= − +
; Evaluate
a)
( )
f x h+
b)
( ) ( )
f x h f x+−
c)
( ) ( )
f x h f x
h
+−
(The Difference Quotient)
4
( ) ( )
sin and f x x g x x
==
; Find:
a)
( )
( )
2fg
b)
( )
( )
0gf
c)
g f
4
5
If
( )
2f x x=+
and
( )
2g x x=
, find
a)
( )
( )
f g x
b)
( )
( )
g f x
c)
( )
( )
f f x
d)
( )
( )
g g x
6
For
( )
2
2
2, 1
2 2, 1
xx
fx
xx
+
=
+
, evaluate
( ) ( ) ( )
( )
2
a) 2 b) 0 c) 1 d) 2f f f f s−+
7
Find the domain of the following functions:
a)
21yx= + −
b)
2
4yx=−
c)
1
2
y
x
=
−
d)
2
1
34
y
xx
=
+−

AP Calculus AB – Worksheet 3 Graphical Representation of Functions
Reading Graphs of Functions
1. The graph of a function,
( )
fx
, is shown above. Use the graph to answer the following questions.
(a) Find
( )
0f
and
( )
8f
.
(b) Is
( )
5f −
positive or negative? Explain your
reasoning.
(c) For what values of x is
( )
0fx=
?
(d) Determine the values of x for which
( )
3fx=
.
(e) Determine the values of x for which
( )
f x
is increasing. Explain your reasoning.
(f) How often does the line
1
2
y =−
intersect the
graph of
( )
fx
?
(g) Find
( )
( )
2ff
.
(h) Find the equation of the secant line passing
through the points
( )
5, 2−−
and
( )
11,1
.
2. The graph of a function,
( )
fx
, is shown above. Use the graph to answer the following questions. The
domain of
( )
f x
is
3,11−
.
(a) Find
( )
0f
and
( )
3f
.
(b) Is
( )
8f
positive or negative? Explain your
reasoning.
(c) For what values of x is
( )
0fx=
?
(d) Determine the values of x for which
( )
2fx=
.
(e) Determine the values of x for which
( )
f x
is decreasing. Explain your reasoning.
(f) How often does the line
1
4
y =
intersect the
graph of
( )
fx
?
(g) Find the average rate of change of
( )
fx
on the interval
2,5
.
(h) Determine the rate of change of
( )
f x
when
2x =
.

3. Use the graphs of f and g to evaluate each expression. If the result is undefined, explain why.
a)
( )( )
3fg
b)
( )
( )
2gf
c)
( )
( )
5gf
d)
( )( )
3fg−
e)
( )
( )
1gf−
f)
( )
( )
1fg−
4. Holly, who is fortunate enough to live near the beach, takes a jog each evening. She takes a straight path
between her house and the beach and back. The graph above shows her distance (in miles) from t minutes
on one evening. Use the graph to answer the questions.
(a) How far from home was Holly at time,
10t =
minutes?
(b) At approximately what time(s) was Holly 1 mile from home?
(c) During what approximate time interval(s) was Holly more than ½ mile from home?
(d) During what approximate time interval was Holly resting?
(e) At what time did she reach the ocean? How far is the ocean from Holly’s house?
(f) Approximately how fast was Holly jogging on the interval
0,20
. Indicate units of measure.
(g) What was Holly’s average rate of change over the time interval
0,90
?
(h) At what time did Holly return home?
(i) At approximately which moment was Holly jogging the fastest? Explain your reasoning.

AP Calculus AB – Worksheet 4 Graphing Calculator Basics
When finding solutions on your graphing calculator, all answers should be correct to 3 decimal places.
1. For
( )
2
3 sin
x
f x x x e= − +
, evaluate
a)
( )
4f
b)
( )
2.85f
c)
6
f
2. Consider the following function:
( )
32
3 24 5f x x x x= − − +
a) Graph
( )
fx
in a complete window.
b) Evaluate
( )
1.5f −
c) Find all zeroes of
( )
fx
.
d) Find the coordinates of the maximum point(s).
e) Find the coordinates of the minimum point(s).
f) What is the y-intercept of
( )
fx
.
g) Consider
( )
10 25g x x= − −
. Find all values of x such that
( ) ( )
f x g x=
.
3. Use a graphing calculator to find the zeroes of each function.
a)
( )
2
sinf x x x=+
b)
( )
2
3
x
g x e= − +
c)
( )
3 lnh x x= − +
4. Use a graphing calculator to find all values of x such that
( ) ( )
f x g x=
.
a)
( ) ( )
3
2 ; 2cosf x x x g x x= − =
b)
( ) ( )
2
3 5; 3f x x x g x x= − − = +
5. Use a graphing calculator to find the maximum and minimum points of
( )
3 x
f x x e=−
.

AP Calculus AB – Worksheet 5 Solving Equations
The secret to getting ahead is to get started – Mark Twain
For problems 1-4, find all zeroes of each function. Leave answers as exact.
1
( )
2
2 5 12f x x x= + −
2
( )
21
39
x
f x e
+
=−
3
( )
2sin3 1f x x=−
in
[0,2 )
4
( ) ( )
ln 4 6f x x= − +
For 5-6, use a graphing calculator to find the zeroes of each function. Answers should be correct to 3 decimals.
5
3
2 5 1y x x= − +
6
2
52
x
y e x= − −
For 7-8, find any points of intersection of the graphs of the equation.
7
2
21
xy
yx
+=
= − −
8
2
6
4
xy
xy
+=
+=
For 9-11, use a graphing calculator to find the points of intersection of the graphs.
9
42
2
21
1
y x x
yx
= − +
=−
10
2 3 6
6
yx
yx
= − − +
=−
11
( )
( )
2
sin
1
3
2
f x x
g x x
=
=−

AP Calculus AB – Worksheet 6 Introduction to Calculus
1
Consider the function
( )
2
f x x=
and the point
( )
1,1P
on the graph of f.
(a) Graph f and label point P.
(b) Estimate the slope of the curve at point
( )
1,1P
. Draw the secant line through the two points that
were used.
(c) Describe how to obtain a better estimation for the slope at
( )
1,1P
.
(d) Estimate the area under the graph of f but above the x-axis from
0x =
to
1x =
.
2
Consider the function
( )
f x x=
and the point
( )
4,2P
on the graph of f.
(a) Graph f and label point P.
(b) Estimate the slope of the curve at point
( )
4,2P
. Draw the secant line through the two points that
were used.
(c) Describe how to obtain a better estimation for the slope at
( )
4,2P
.
(d) Estimate the area under the graph of f but above the x-axis from
0 to 4xx==
.
3
( )
fx
is a continuous functions with domain all real numbers. Selected values of
( )
fx
are given in the table below:
a) Approximate the slope of
( )
f x
when
5x =
.
b) Approximate the area under the graph of
( )
fx
on the interval
4,11−
.
x
-4
-1
0
3
8
11
( )
f x
5
2
4
2
1
6
AP Calculus AB – Unit 1 Review Review for your first test.
Write an equation for the specified line.
1
through
( )
1, 6−
with a slope of 3
2
the vertical line through
( )
0, 3−
3
through
( ) ( )
3,3 and 2,5−
4
through
( )
4, 12 and parallel to 4 3 12.xy− + =
5
through
( )
11
1,2 and perpendicular to 1.
23
xy− + =
Evaluate the function for each value
6
( )
2
56f x x x= − −
;
a)
( )
3f −
b)
( )
2fa+
c)
( ) ( )
f x h f x
h
+−
7
( )
2, 1
, 1 1
2, 1
xx
f x x x
xx
− − −
= −
− +
a)
( )
3f −
b)
( )
1f −
c)
( )
1f
d)
( )
2
2fb+
Solve each equation
8
2
75xx+ − = −
9
5
9 11
x
e −=
10
4sin2 2x =
in
0,2
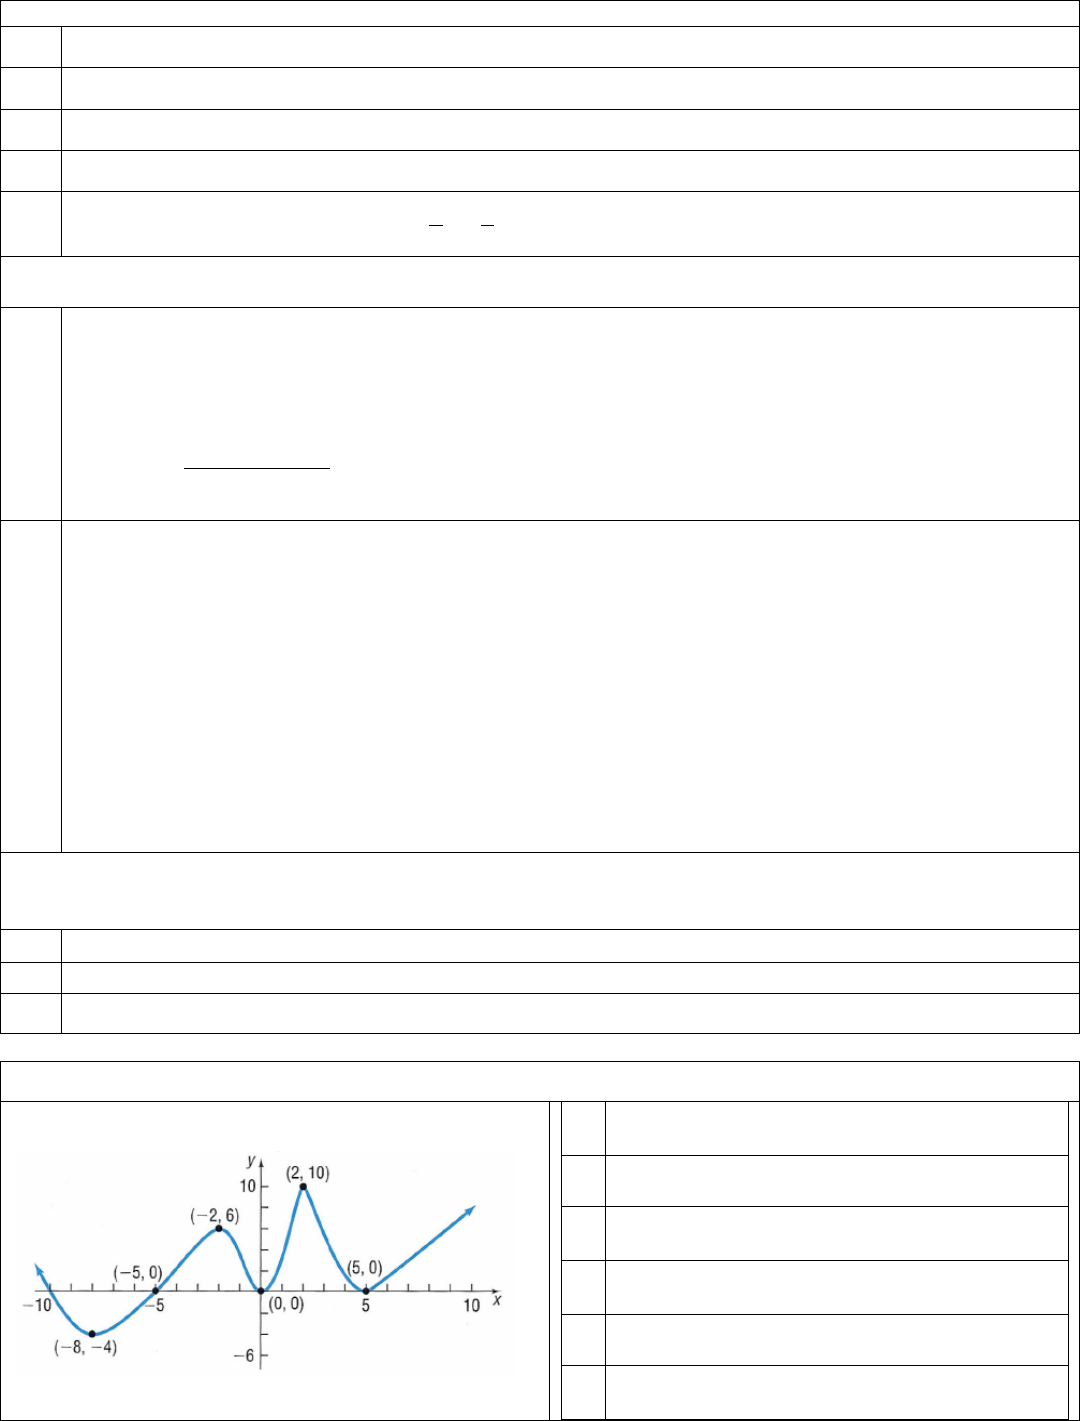
Use the graph of
( )
fx
to answer questions 11-16
11
Evaluate
( ) ( )
2 and 8ff−−
12
For what numbers x is
( )
0fx=
?
13
For what values of x is
( )
0fx
?
14
How often does
( )
1fx=
?
15
For what values of x is
( )
fx
increasing?
16
Is
( )
4f −
positive or negative?

17
A graphing calculator MUST be used to answer the following questions. All answers must be
correct to three decimals.
Given that
( )
32
5 4 1f x x x x= − + +
and
( )
3g x x=−
a) Evaluate
( )
1f −
,
( )
0.5f
, and
3
7
f
b) Find the zeroes of
( )
fx
.
c) Find the maximum and minimum coordinates of
( )
fx
.
d) Determine the points of intersection for the graphs of
( )
fx
and
( )
gx
.

Selected Solutions
Answers for Worksheet 1
1)
m = 3
m
⊥
= −
1
3
2)
m = −
1
3
m
⊥
= 3
3) slope = und
m
⊥
= 0
4)
3x =
2y =
5)
x = 0
y = − 2
6)
x = −
y =
4
7)
y − 2 =1 x −1
( )
8)
y − 0 = −2 x + 4
( )
9)
( )
2
2
yx
− = +
10)
( )
3
32
2
yx− = −
11)
( )
3 11
0
42
yx− = −
12)
( )
2 0 3yx+ = −
13)
m = −
3
4
4, 0
( )
0, 3
( )
14)
( )
( )
4
3
3,0
0,4
m =−
15)
undefined
( )
4,0
none
16)
( )
2 2 2yx− = − +
( )
1
22
2
yx− = +
17)
( )
( )
3
46
4
4
46
3
yx
yx
− = − +
− = +
18)
( )
1
01
2
yx− = +
x = −1
19)
6 7
2
20)
−13
21) -1
22) -6
23) a)
2k =
b)
k = −2
Answers to Unit 1 Review
1.
( )
6 3 1yx+ = −
2.
0x=
3.
( )
( )
2
3 3
5
2
or 5 2
5
yx
yx
− = − −
− = − +
4.
( )
4
12 4
3
yx+ =− −
5.
( )
2
21
3
yx− = +
6. a)
( )
3 18f −=
b)
( )
2
2 12f a a a+ = − −
c)
( ) ( )
25
f x h f x
xh
h
+−
= + −
7. a)
( )
31f −=
b)
( )
11f − = −
c)
( )
1f =
d)
( )
22
2f b b+ = −
8.
( ) ( )
2,0 , 1,0−
9.
ln20
5
x =
10.
5 13 17
, , ,
12 12 12 12
x
=
11.
( ) ( )
2 6; 8 4ff− = − = −
12.
( )
0 at 10, 5, 0,and 5f x x= = − −
13.
( )
0fx
on
( ) ( ) ( ) ( )
, 10 , 5,0 , 0,5 , 5,− − −
14.
( )
1 six timesfx=
15.
( ) ( ) ( ) ( )
is increasing on 8, 2 , 0,2 ,and 5,fx − −
16.
( )
40f −
