
Center for Municipal Finance
1155 East 60th Street
Chicago IL 60637
T 773.834.1468
The Impact of Property Tax Appeals on Vertical
Equity in Cook County, IL
Robert Ross
June, 2017
0
This paper began in a practicum lead by Professor Chris Berry during the fall of 2016. Chicago Tribune Reporter Jason Grotto
helped obtain the public records necessary for this analysis. Thanks also to the students who participated in the practicum organising
data and producing preliminary results: Sarah Guminski, Michael Harvey, Dani Litovsky Alcala, Megan Maxwell, Hector Salvador
Lopez, Alex Sarabia, Daniel Truesdale, and Alvaro Valdes Mena.
Abstract
Cook County has one of the highest rates of property tax appeals in the
country. Do appeals make property taxes more fair and accurate? Using
administrative property tax data from for 2003-2015, I quantify the level
of regressiveness in property taxes. I find property taxes to be highly
regressive. I then investigate whether the appeals process mitigates or
exacerbates regressiveness. I find that post-appeal assessment ratios are
more regressive than pre-appeal ratios, providing evidence that the prop-
erty tax appeal process decreases vertical equity. I further find that ef-
fective tax rates are higher in neighborhoods with a higher percentage of
minorities, and lower in wealthier and better educated neighborhoods.

1 Introduction
In his survey of taxation during the first 100 years of
American independence, Richard T. Ely wrote:
The fundamental idea of our tax systems is
a democratic one. It is... that men are
bound to serve the state in the degree in
which they have the ability to serve them-
selves. The reasons why these earliest meth-
ods [of assessment] were abandoned are suf-
ficiently evident... When one acre of land
was often worth ten or twenty times, or even
fifty times, as much as another situated in
the same commonwealth, there could not
fail to arise a demand for a system of tax-
ation which would adjust the burdens of the
government more accurately and make them
bear upon each individual more nearly in
proportion to his ability.
1
Property tax assessment is a politically contentious
exercise. As assets have become more complex and less
visible, estimating an individual’s “capacity to serve her-
self” has become highly technical and difficult. Modern
systems of property tax assessment evolved out of a se-
ries of technical and legal innovations to become quasi-
judicial apparatus with both administrative and legal
levels of review. Local governments nevertheless con-
tinue to rely heavily on property taxes, and fairness in
taxation is important to the political and economic sta-
bility of those governments. However, while economists
are generally in favor of property taxes, the public’s
mind is well set against them; the property tax is re-
garded as the “least fair” tax by the average American.
2
The greater the perception that property taxes are
unfair, the more likely taxpayers are to appeal their
taxes. Indeed, property tax appeals are becoming more
numerous nationwide.
3
Cook County, IL (the County),
enthusiastically follows this trend. In 2015, about 20
percent of residential taxpayers filed more than 360,000
appeals. Figure 3 shows statistics for appeals between
2003 and 2015. Over that period, the number of appeals
increased by about 20% with every reassessment cycle,
as has the percentage of appeals resulting in a reduction
in taxable value.
The increase in appeals has been actively encour-
aged by various County officials and offices. County of-
ficials actively encourage taxpayers to appeal their prop-
erty tax assessments, and the County Board of Review
(BOR) trains elected officials, including Chicago legisla-
tors, to help constituents appeal their taxes. In addition,
the County recently instituted a new online property tax
appeal system which allows property owners to easily ap-
peal their own taxes without legal representation. These
features of the County’s property tax system result in a
very large number of appeals. Do the large and growing
number of property tax appeals encourage fairness and
accuracy in Cook County’s property tax system?
The focus of this paper is the impact of the prop-
erty tax assessment system, and property tax appeals
in particular, on vertical equity in property taxation.
I investigate the prima facia case for vertical equity
in assessment ratios, property taxes, and tax appeals.
The assessment ratio of a property is the ratio of the
Cook County Assessors’ Office’s (CCAO) estimate of
that property’s market value to the actual sale price of
the property, in the year the property sold.
4
The effec-
tive tax rate on housing wealth is the ratio of taxes paid
in the year a property sold to the sale price of that prop-
erty, in the year the property sold. If effective tax rates
are strongly negatively correlated with home values, I
take this as evidence of regressive property taxes.
Using administrative data from the Cook County As-
sessors’ Office (CCAO), I find that property taxes in
Cook County became extremely regressive following the
collapse of the housing bubble in 2008. Figure 4 shows
the depressive effect of the housing bubble on sales vol-
umes and median home prices in the County. Figure 7
displays effective property tax rates by home value for
the period following the housing bubble. That figure
clearly shows a strong negative relationship between ef-
fective tax rates and property values. This is prima faci
evidence of regressiveness in property taxes.
I also find that appeals make taxes more regressive.
Figure 1 shows the change in assessment ratios for all
properties for the period 2009-2015. Though appeals
reduces taxable values, on average, across the range of
home values, they tend to decrease them more for more
valuable properties. The appeals process as a whole de-
creases vertical equity by granting proportionately larger
reductions in value to more valuable properties.
Property assessment is a complex, constantly evolv-
ing field. While the data for this analysis comes from
Cook County, IL, I do not believe the County is unique
in terms of veritcal equity or property tax appeals. This
analysis suggests a number of policy changes to encour-
1
Ely (1888),[8] p. 131
2
Gallup (2005)[11]. Also see Chapter 11 of Fisher (1996)[9].
3
Doerner and Ihlanfeldt (2012)[7].
4
For simplicity, I calculate the assessment ratio as 10*(assessed value)/(market value), so that an assessment ratio of 1 means that
the assessor has perfectly predicted a property’s value.
1

age more equity in the property tax system. Lessons
learned in the revision and execution of assessment prac-
tices in the County can be duplicated by other counties
nationwide.
2 The “least bad” tax
The property tax as administered in the United States
is a paradox: on the one hand, voters regularly report
that they believe they get the “best bang for the buck”
from property taxes,
5
local governments rely heavily on
property taxes to finance local services,
6
and economists
credit the property tax with a number of positive at-
tributes. On the other hand, voters regularly report that
the property tax is the “most unfair,” “worst” tax ac-
cording to repeated opinion surveys,
7
there are frequent
property tax revolts and other initiatives to limit prop-
erty taxation, and property tax revenues as a share of
GDP are declining in the US even while other tax rev-
enues are increasing. Indeed, the property tax revolts of
the late 1970s were defining events in the political econ-
omy and local public finance of the United States, and
yet there is no consensus to date on the causes of these
revolts.
8
Canonical public finance textbooks take an opti-
mistic view of the property tax with respect to vertical
equity. Fisher (2007) sums up a discussion of the eco-
nomic effects of the property tax writing “these factors
combined do not support a conclusion of general prop-
erty tax regressivity.”
9
Rosen (2002) argues that the
property tax is broadly hated because it is perceived as
being regressive. This perception he attributes to the
dominance of the “traditional view” of property taxes
as excise taxes on a bundle of land and capital, and the
disjoint between housing wealth and liquidy assets for
some subgroups of taxpayers.
10
He equivocates as to
whether the tax is, in fact, regressive.
Other economists have argued as well that the prop-
erty tax is theoretically progressive.[30] In an environ-
ment where the Tiebout Hypothesis holds, property
taxes are fully capitalized into home values and behaves
like a user fee rather than a tax. In such an environment,
Rosen (2002) writes that “the notion of progressiveness
is meaningless.” It is unclear, however, whether ver-
tically inequitable property taxes might still behave as
use taxes; do lower income residents derive greater pro-
portional benefits from local government than wealthier
residents? Most recently, Youngman (2016)[29] writes
“The easy use of the term regressive to describe the prop-
erty tax in popular debate is not justified on economic
grounds,” arguing that the ambiguity of the incidence of
the property tax makes it difficult to ascertain its true
regressiveness.
Most of the aforementioned work deals with the inci-
dence of a uniform tax on real estate. Recent empirical
research, on the other hand, has focused more on the ad-
ministration of the property tax. In that body of work,
there is an emerging consensus that property taxes are
administer in such a way as to be regressive on their
face. This seems particularly true when conditions for
property appraisal are unfavorable, like the period af-
ter a major real estate bubble. Suits (1977)[25], Phares
(1980)[20], Metcalf (1994)[18], and Plummer (2003)[21]
use different approximations of income to compute a
suites index and determine whether property taxes are
regressive.
11
In these studies, estimated Suites Indices
range from .23 (fairly progressive) to -.13 (a bit regres-
sive). More recently, Cornia and Slade (2006)[6] and
McMillen and Weber (2008)[17] find that property taxes
are regressive in Cook County specifically, although their
data are limited in size and cover periods from before the
collapse of the housing bubble.
McMillen (2011)[15], Hodge et. al. (2016)[12], and
Krupa (2012)[14] find that post-housing bubble assess-
ments became highly regressive in Cook County, Detroit,
and Indiana respectively. McMillen (2013)[16] exam-
ines the impact of property tax appeals in Chicago in
2006, finding that they decrease vertical equity slightly.
Doerner and Ihlandfeldt (2012) [7] examine the effect
of appeals on assessment ratios in Miami-Dade County
and find that they disproportionately benefit white, rich
neighborhoods. This paper most resembles these papers
in scope, methods, and focus.
5
Cabral and Hoxby (2012)[5]
6
Anderson and Ross (2013)[3]
7
Gallup (2005)[11]
8
Anderson and Pape (2011)[2]
9
Fisher (2007)[10], p. 370
10
Rosen (2002)[22], p. 494
11
The Suites Index was proposed by Suites (1977)[25] as a standard measure of verhtical equity in taxation. I calcualte the index in
Appendix B. For a good description of the Suites Index, and a bootstrapping method for hypothesis testing, see Anderson (2003)[1].
For a summary of recent empirical work on progressivness in property taxes, see Stanahan et. al. (2014)[26]. The suites index follows
the logic of the Gini Coefficient calculated from the Lorenze Curve. To calculate the Suites Index, plot the cumulative tax payments
against the cumulative wealth of a population, and calculate one minus the ratio of the area under this curve to the area under a 45
degree line. Like the Gini Coefficient, the resulting index shows the degree to which taxpayers at lower levels of wealth bear larger
proportions of the total tax burden.
2

This paper contributes to the literature on local
property taxes in a number of ways. First, I document
the prima facia regressiveness of the property tax sys-
tem in the second most populous county in the US using
a straightforward approach: effective tax rates. This is
the only study I am aware of to clearly show how regres-
sive assessments and appeals lead to regressive taxes. I
use a very large administrative dataset covering a large
period of time to show patterns of assessment and tax-
ation across realized property values and neighborhood
demographic attributes. The only other studies I am
aware of to use such a large dataset for this purpose is
Krupa (2012)[14] and Doerner and Ihlandfeldt (2012)[7].
This paper builds on their analysis by offering novel, and
simpler ways of measuring regressiveness, and by exam-
ining the period before, during, and after a large hous-
ing bubble. This informs our understanding of how the
County’s property tax performs under conditions which
are unfavorable to predicting property real estate values,
and whether the appeals process sufficiently corrects for
errors in assessed values during a housing bubble. My
findings add to a growing body of literature which sug-
gests that the property tax is regressive in practice be-
cause assessments are regressive.
3 Data and calculations
The data for this analysis comes from administrative
records of the CCAO, the Cook County Treasurer’s Of-
fice, the City of Chicago, and the US Census Bureau,
and includes more than 1.5 million residential properties’
taxes, assessed values, sales, appeals, and other infor-
mation used for property tax purposes from 2003-2015.
Unique Property Identification Numbers were matched
with the Census Tracts which contained them. This
allows me to identify correlations between census-tract
level characteristics with tract-level property taxes. My
final dataset contains 21.4 million observations of resi-
dential properties’ administrative property tax records
from 2003-2015.
I selected properties which sold between 2003-2015.
Consistent with standard assessment practices, I take
the sale price of a home as the realized value in the
year the home sold. My dataset of residential sales con-
tains just less than 600,000 residential home and condo-
minium sales from 2003-2015.
12
Annual sales volumes
and median prices are reported in Figure 4.
This study considers three phases in the property tax
assessment process. The first step in the assessment pro-
cess is a “first-pass” made be the CCAO. In this step, the
CCAO notifies taxpayers of their preliminary assessed
values. These assessed values mostly determine a tax-
payers’ property taxes for the next three years. After
being notified, taxpayers may appeal their assessments
through both the CCAO and the BOR, and then in court
following these agencies determinations. Following the
resolution of all appeals, a final assessed values is as-
signed to each property. Finally, taxes are calculated
based on that final assessed value, exemptions, and the
applicable tax rates. This paper focuses on the bench-
marks of this process: first-pass assessments, final as-
sessments, and taxes.
To measure regressiveness, I rely on the standard
measure used in ratio studies: Price Related Differen-
tial (PRD).
13
In Appendix B, I also calculate two other
measures of vertical equity. These other statistics are
consistent with the patterns shown by the PRD.
The PRD is given as the ratio of un-weighted mean
assessment ratios to weighted mean ratios in a given time
period:
P RD =
P
n
j=1
E
CCAO
[V
j
]/V
j
/N
P
N
j=1
w
j
∗ E
CCAO
[V
j
]/V
j
/N
(1)
where property values are used as weights. If the
weighted mean is equal to the unweighted mean, as-
sessments are perfectly uniform across home values and
the PRD will equal 1. If the weighted mean is rela-
tively smaller than the unweighted mean, higher value
properties are assessed at lower rations, and the PRD is
greater than 1. PRD is negatively associated with re-
gressiveness. The standard “acceptable” range for PRD
is [0.97, 1.02]. This range is asymmetric around 1 be-
cause there is an upward bias in the denominator which
does not effect the numerator.
14
The variance of this
statistic is not well defined, so I use bootstrapping to
obtain an estimate of the variance.
4 Results and discussion
4.1 Vertical equity in assessments
Table 1 and figure 5 show PRD before and after appeals.
Figure 2 plots the change in the PRD by major property
type, with bootstrapped margins of error. And figure 1
shows the change in assessment ratios by home value for
all County properties 2009-2015.
12
I dropped 68 observations where the appeals process actually increased properties’ taxable values. The omission of these observa-
tions has no qualitative effect on my results, but their inclusion causes my graphs to display oddly because the amount of increase was
extreamly large for these observations.
13
IIAO Standard for Ratio Studies, 2013, p. 17
14
IIAO (2013)[13], p. 35
3

Figure 1: Impact of appeals on assessment ratios by home value
.6 .8 1 1.2 1.4
Ratio of assessments
to sale price
$250K $500K $1 mln $1.3 mln
Sale value
Assessment ratios
−6% −5% −4% −3%
Effect of appeals on
assessment ratio
$250K $500K $1 mln $1.3 mln
Sale value
Difference in pre− and
post− assessment ratios
Cook County 2009−2015
Pre−appeal Post−appeal
Together, these figures demonstrate that property
tax assessments in the County are regressive, and are
made more so by appeals. Looking at homes in the 25th
and 75th percentiles of sale price 2009-2015, homes in
the lower quartile are assessed during the CCAO’s first-
pass at ratios 23% higher than those in the upper quar-
tile. At the end of the appeals process, homes in the
lower quartile are assessed at a rate 24% higher than
homes in the higher quartile. That is so because ap-
peals lower taxable value proportionally more at higher
home values. Assessment ratios are 3.3% less after ap-
peals for the 25th percentile, and 4.1% less for the 75th
percentile. Overall, appeals make property tax assess-
ments more regressive by granting larger reductions at
higher market values.
The CCAO & BOR introduce regressiveness into the
property tax system in the way they grant appeals. The
CCAO & BOR often grant reductions in assessed value
to properties which are already under-assessed. More
than half of under-assessed properties sold 2009-2015
filed an appeal, and the CCAO & BOR granted 22%
of those appealing properties some reduction in their
assessed values. On average, the CCAO & BOR re-
duced assessed values for already under-assessed prop-
erties which appealed by $5,700, or 23% of the average
assessed value for appealing under-assessed properties.
By comparison, over-assessed properties saw an aver-
age reduction of $8,169, 28% of average assessed values.
Simple regressions of the probability of winning an ap-
peal, and the percentage reduction in assessed value on
first-pass assessments shows very little correlation be-
tween winning appeals and first-pass assessment ratios.
Taxpayers are more likely to appeal their assess-
ments if they are over-assessed, and if their homes are
worth more. Even after accounting for these factors,
however, neighborhood demographic characteristics are
still significantly correlated with assessment ratios, ap-
peals, and effective tax rates. Table 2 shows the re-
sults of regressions on outcomes of interest. Areas with
higher levels of education, higher property values, and
fewer minorities pay significantly lower tax rates. Figure
8 shows selected correlations with demographic charac-
teristics of census tracts and mean effective tax rates.
Geographic patterns of tax appeals, assessment ratios,
effective tax rates, and home values are shown in 9 -
12. These maps convey a sense of the distribution of
property taxes to those familiar with the demographic
topography of Chicago.
Some of these correlations may be driven by the fact
that taxpayers self-select as to whether they appeal their
taxes or not. This self-selection may drive some regres-
siveness in the appeals process as well. For example,
many larger condominiums buildings hire attorneys to
file appeals for all of the units in the building, taking
4

advantage of the returns to scale in this type of appeal.
Effective tax rates may be consequently lower for larger
condominium buildings. Figure 6 shows the strong, pos-
itive relationship between condominiums’ building size
and the probability of any individual unit filing a prop-
erty tax appeal. The difference in effective tax rates be-
tween condominium properties and single-family homes
seen in figure 7 may be a product of the different rates
of appeal between these types of properties, although
assessment methods also differ between these types of
properties.
Another factor in tax appeals are attorneys: tax-
payers spent an estimated $22 million in lawyers’ fees in
2015 appealing their taxes. Tax lawyers in Cook County
solicit customers during tax season, and it may be that
those lawyers solicit more valuable property more of-
ten, since those properties are more likely to yield larger
nominal fees. Lawyers may also target English-speaking
populations, or areas with more density of sales, where
it is easier to find clients and win appeals. There may
also be other ways in which lawyers select clients which
increase regressiveness in property taxes.
Finally, there may be simple geographic informa-
tional spillovers in appeals off all residential properties,
making neighbors of taxpayers that appeal more likely
to appeal themselves. This may be because neighbors
voluntarily share tax information with each other, or be-
cause neighbors look at each others’ property tax infor-
mation online. This may result in some neighborhoods
having a very high rate of appeal, simply because of the
compounding effect.
15
4.2 Vertical equity in taxes
Regressive property tax assessments lead to regressive
property taxes. From 2009-2015, Chicago properties at
the 25th percentile of sale value were taxed at a rate 24%
higher than properties at the 75th percentile of value.
16
The 25th percentile sale values in Chicago was about
$156,000, paying an average tax of about $2,300.
The 75th percentile of sale value was nearly $370,000,
paying an average tax of $4,700. The average effective
tax rates at these quartiles were about 1.5% and 1.2%
respectively. If homes at the 25th percentile paid the
same tax rate as those at the 75th percentile, their taxes
would be about $465/year lower on average. On the
other hand, if Chicago properties in the 75th percentile
faced the average effective tax rate that properties in the
25th percentile faced, they would have paid $1,142/year
higher taxes on average.
To further contextualize these figures, I randomly se-
lected two representative properties which sold in 2011,
the year in which assessments in the County were most
regressive. I restricted my selection to owner-occupied,
single-family homes in the 25th and 75th percentiles of
property value with successful property tax appeals.
The property in the 25th percentile of home values is
in the Village of Stickney, IL, a mostly-white suburban
community bordering Chicago to the south west. Stick-
ney has a median household income of about $43,000,
and about 10% of residents are college educated. The
property in the 75th percentile of property values lies in
the North Park community of Chicago, where median
household income is about $71,000 and about 50% of
the residents hold a college degree.
The Stickney property sold in 2011 for $130,000,
and the CCAO estimated its market value at $238,660,
nearly double its actual market value. In contrast, the
North Park property sold in 2011 for $309,000, but the
CCAO estimated its market value at $281,100. Both
properties filed successful appeals in that year: the Stick-
ney won a reduction of $12,640 of taxable market value,
while the North Park won a reduction of $12,300 of tax-
able market value. The statutory property tax rates in
Stickney are nearly twice as high as they are in the City
of Chicago, a reflection in part of the lower amount of
commercial property value in that community. For a di-
rect comparison of the impact of assessments on taxes, I
apply the statutory rate in Chicago to both properties.
Under uniform tax rates, the Stickney’s property tax bill
would have been $4,300, and the North Park property’s
bill would been $5,100. If both properties had been as-
sessed perfectly, those bills would have been $2,400 and
$5,900 under uniform tax rates.
Regressiveness shifts a considerable portion of the
total property tax burden onto lower value properties.
Consider the 13,539 residential sales in the City of
Chicago in 2011. Cumulatively, the total value of those
sales was about $5.1 billion. Those properties paid $59.1
million in property taxes in that year. Those revenues
are not taken in equal proportion from every property.
The County’s property taxes were most regressive in
2011; the average effective tax rate on properties in
Chicago in the 25th percentile of property value was 30%
higher than that on properties in the 75th percentile of
property values. The nature of property taxes is such
that decreases in taxes for one group is mechanically
offset by increases in taxes for another group. Suppose
15
In Cook County, the public may look up property tax records, including taxes paid, exemptions applied, and appeal status, online.
16
Throughout this analysis, I use Chicago properties to compare effective tax rates, even though I use properties Countywide to
compare assessment ratios. This is so because all residential properties in Chicago lie in the same taxing jurisdictions, so comparisons
of effective tax rates reflect differences in the assessment process.
5

Figure 2: Impact of appeals on vertical equity
−.005 0 .005 .01 .015 .02 .025 .03 .035 .04
Change in PRD
2003
2004
2005
2006
2007
2008
2009
2010
2011
2012
2013
2014
2015
year
Single−family homes
Effect of appeals on PRD
−.005 0 .005 .01 .015 .02 .025 .03 .035 .04
Change in PRD
2003
2004
2005
2006
2007
2008
2009
2010
2011
2012
2013
2014
2015
year
Condominiums
Effect of appeals on PRD
2003−2015
Change in PRD
caused by appeals
Margin of error
for first−pass PRD
that the revenues from these properties was collected
uniformly according to property value, as is legally stip-
ulated: what impact would this have on tax bills?
Re-calculating each property’s tax bill by applying
the uniform rate required to raise these funds in equal
proportion from all properties, I can quantify the nomi-
nal level at which properties are over- and under-taxed.
In 2011, nearly 9,500 properties paid taxes higher than
that calculated from a uniform rate, while about 4,000
paid lower taxes.
17
Redistributing that tax burden in
equal proportion to housing wealth, I find that the av-
erage decrease in tax bills for properties paying a higher
effective tax rate is about $1,500, while the average in-
crease in tax bills for properties paying lower effective
tax rates is about $4,600. There are about 735,000 resi-
dential properties in the City of Chicago. If this sample
of about 1.8% of all properties is representative of the
general pattern of vertical inequity across the City, the
magnitude of redistribution of tax burdens from higher
to lower value homes could be as much as 50X larger.
Figure 13 graphs the results of this exercise. On the
left side of the panel, the average difference between ac-
tual taxes paid and taxes paid under a uniform tax rate
is plotted against property values. The x-axis is scaled
by value percentiles. This graph shows that more than
half of the properties in the sample would experience a
reduction in their property taxes if a uniform tax rate
was applied across home values. The right panel shows
the average effective tax rates paid at each percentile of
sale value, as well as the uniform effective tax rate re-
quired to raise an equivalent amount of revenues from
this subsample of properties. To the degree that the bias
in assessment ratios exhibited among properties which
sold is a good approximation of bias in assessment ratios
for all properties, this exercise illustrates the magnitude
of the impact of regressiveness in the County.
5 Policy recommendations
Estimating the value of real estate is a difficult and com-
plex task. Concerning California’s property tax system,
Frederick Stocker wrote
(The property tax) resembles a structure de-
signed by a mad architect, erected on a shaky
foundation by an incompetent builder, and
made worse by the well-intentioned repair
work of hordes of amateur tinkerers.
18
17
In calculating the uniform rate, I exclude properties in the top and bottom 1% of effective tax rate.
18
Stocker (1991)[27], p. 1.
6
To some degree, such can be said of any democratic in-
stitution which is the product of negotiated compromise.
With advances in computing and statistical sciences,
however, it increasingly seems as though the technical
aspects of property tax assessments are in want of re-
design. Improvements in the County’s assessments may
translate into large improvements in the administration
of the property tax nationwide.
First-pass assessments in the County need to be ac-
curate, and their errors should not be correlated with
property values. If traditional methods of estimation do
not yield such errors, the CCAO should explore non-
traditional methods. For example, the CCAO could
conduct a competition with a large cash award for the
person or group who designs a significantly better as-
sessment algorithm, similar in spirit to the famous Net-
fliz Prize. Another example might be to explore survey
methods of predicting property value. Are self-reported
property values, with some threat of audit, a more reli-
able way to estimate values? Do neighbors truthfully re-
port their neighbors’ property values? The CCAO could
investigate these and other approaches to property tax
assessment.
Transparency can help improve government services
simply by changing the political incentives faced by the
county assessor. The CCAO should make the property
tax database available, in full, to the public, along with
all computer code necessary to replicate the assessors’
estimation process. This would not only increase the
accountability of the system, but also may encourage an
entrepreneurial data scientist to suggest improvements
to the predictive models used by the CCAO.
The BOR explicitly evaluates assessments with re-
spect to uniformity, or horizontal equity. This ensures
that properties with similar characteristics are assessed
at similar levels. This does not address vertical equity
at all, as I have shown. Incorporating a systemic re-
view of assessments with respect to vertical equity into
BOR considerations might improve the end result of the
review process.
Improving the property tax assessment system in the
County is not merely a technical exercise. There is are
at least two entrenched political classes which benefit
from poor-quality assessments. From 2009-2015, tax
attorneys made an estimated $133 million in revenues
from successful tax appeals. Poor assessments create
revenues for tax attorneys, and any attempt to improve
assessment quality will likely be met by resistance from
these lawyers. In addition, most local politicians as-
sist constituents with tax appeals, in some cases hiring
staff members specifically for that purpose. This gener-
ates political capital elected officials will be reluctant to
trade for better quality assessments.
References
[1] Anderson, John E., Roy, Atrayee Ghosh, Shoe-
maker, Paul A. “Confidence Intervals for the Suites
Index.” National Tax Journal, n. 1, pt. 1, 2003.
[2] Anderson, Nathan and Andreas Pape. “A Model of
Constitutional Constraints on Benevolent Govern-
ments and a Reassessment of the 1970s Property
Tax Revolt.” Working Pape, 2011.
[3] Anderson, Nathan, and Robert Ross. “Rethinking
the Property Tax.” The Illinois Report: Institute
for Government and Public Affairs, 2013.
[4] Borg, Mary O., Stranahan, Harriet A., and William
Voorhees. “The Incidence of the Property Tax and
Property Tax Preferences.” 2014.
[5] Cabral, Marika, and Caroline Hoxby. “The Hated
Property Tax: Salience, Tax Rates, and Tax Re-
volts.” NBER Working Paper 18514. 2012.
[6] Cornia, Gary C., and Barrett A. Slade. “Horizontal
Inequity in the Property Taxation of Apartment,
Industrial, Office, and Retail Properties.” National
Tax Journal, no. 1, 2006.
[7] Doerner, William and Keith Ihlanfeldt. “An Empir-
ical Analysis of the Property Tax Appeals Process”
Journal of Property Tax Assessment and Admin-
istation, v.10, n. 4, 2012.
[8] Ely, Richard T. Taxation in the American States
and Cities. New York: T. Y. Crowell and Co, 1888.
[9] Fisher, G. The Worst Tax: A History of the Prop-
erty Tax in America. Lawrence, KA: University
Press of Kansas, 1996.
[10] Fisher, Ronald. State & Local Public Finance. 3rd
Ed. Thomson South-Western, 2007.
[11] Gallup, 2005. “Which is the Unfairest Tax of them
all?”
[12] Hodge, Timothy, McMillen, Daniel, Sands, Gary,
and Mark Skidmore. “Assessment Inequity in a De-
clining Housing Market: The Case of Detroit.” Real
Estate Economics, 2016.
[13] International Association of Assessing Officers stan-
dard on ratio studies. Kansas City, MO: IAAO.
2013.
[14] Krupa, Olha. “An Analysis of Indiana Property Tax
Reform.” State Tax Notes, V. 65 N. 10, 2012.
7

[15] McMillen, Daniel. “Assessment of Regressivity: A
Tale of Two Illinois Counties.” Land Lines, Lincoln
Institute of Land Policy, January, 2011.
[16] McMillen, Daniel.“The effect of appeals on assess-
ment ratio distributions: Some nonparametric ap-
proaches.” Real Estate Economics, n.1, 2013.
[17] McMillen, Daniel P. and Rachel N. Weber.“Thin
Markets and Property Tax Inequities: A Multino-
mial Logit Approach.” National Tax Journal, n. 4,
2008.
[18] Metcalf, Gilbert. “The Lifetime Incidence of State
and Local Taxes: measuring Chnes During the
1980s.” In Tax Progressivity and Income Inequality,
edited by Joel Slemrod. Cambridge, UK: Cambridge
UP, 1994.
[19] Musgrave, Richard A. “Commentary on Local
Property Taxation in Theory and Practice.” In
Property Taxation and Local Government Finance,
edited by Wallace E. Oates, 339. Cambridge, MA:
Lincoln Institute of Land Policy, 2001.
[20] Phares, Donald. Who Pays State and Local Taxes.
Cambridge: Oelgeschlager, Gunn and Hain, 1980.
[21] Plummer, Elizabeth. “Evidence on the Incidence
of Residential Property Taxes Across Households.”
National Tax Journal, no. 1, 2003.
[22] Rosen, Harvey. Public Finance. 6th Ed. McGraw-
Hill Irwin, 2002.
[23] Ross, Myron H. “The Property Tax Assessment Re-
view Process: A Cause for Regressive Property Tax-
ation?” National Tax Journal, no. 1, 1971.
[24] Sands, Gary and Skidmore, Mark. “Detroit and the
Property Tax: Strategies to Improve Equity and
Enhance Revenue.” Lincoln Institute of Land Pol-
icy, 2015.
[25] Suits, Daniel B. “Measurement of Tax Progressiv-
ity.” American Economic Review, n. 4, 1977.
[26] Stanahan, Harriet A., Coorhees, William, and
Borg, Mary. “The Incidence fo the Property Tax
and Property Tax Preferences.” Researgate, 2014.
[27] Stocker, Frederick C. Proposition 13: A Ten Year
Retrospective. Cambridge, MA: The Lincoln Insti-
tute of Land Policy. 1991.
[28] Wassmer, Robert W. “Property Taxation, Property
Base, and Property Value: An Empirical Test of the
‘New View’.” National Tax Journal, No. 2, 1993.
[29] Youngman, Joan. A Good Tax: Legal and Policy
Issues for the Property Tax in the United States.
Cambridge, MA: Lincoln Institute of Land Policy,
2016.
[30] Appendix G of Marshalls Principles of Economics
(1948), Tiebout (1956), Oats (1969), Epple, Fil-
imon, and Romer (1984), Hoxby (1999), Gal-
lagherm Kurban, and Persky (2013).
8
Appendix A: Graphical results and tables
9
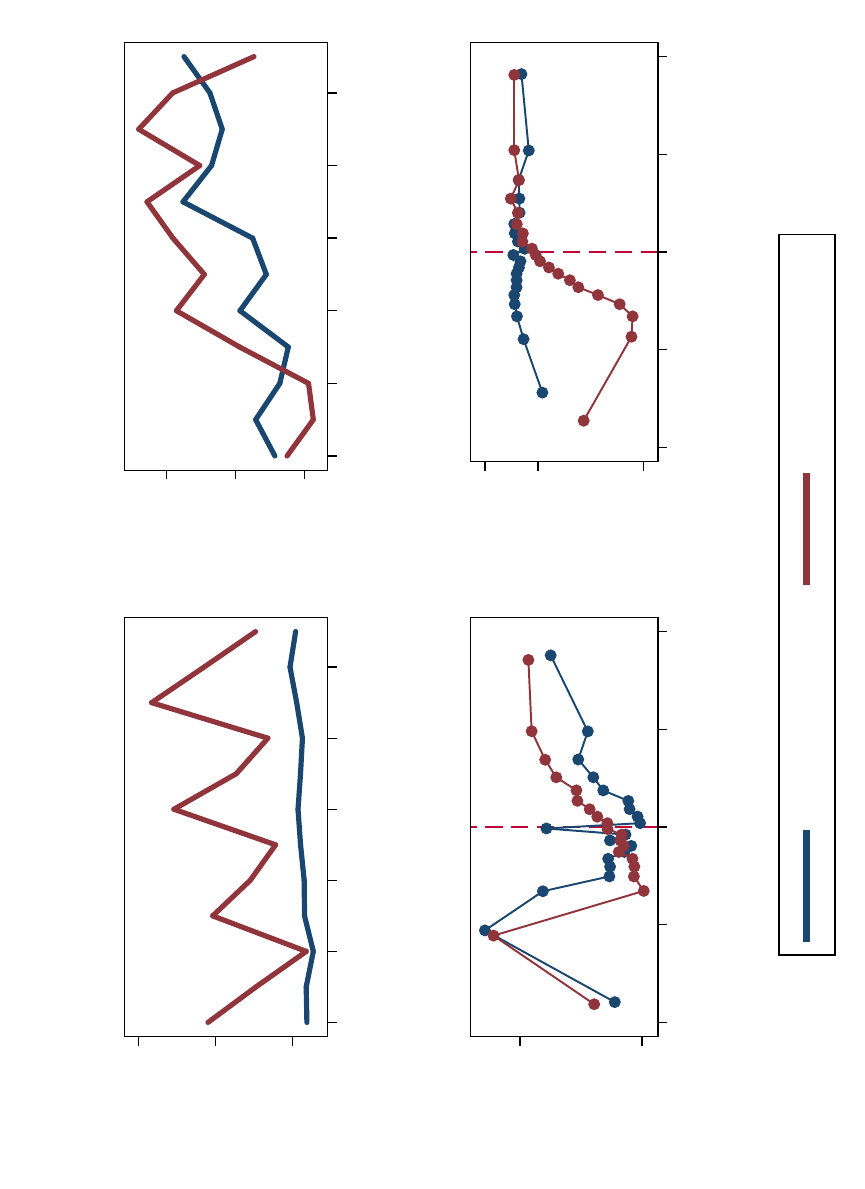
Figure 3: Trends in property tax appeals
10% 30% 50%
Percent of all
properties appealing
2003 2005 2007 2009 2011 2013
Year
Probability of appealing
40% 60% 80%
Percent of all properties
winning an appeal
2003 2005 2007 2009 2011 2013
Year
Probability of winning an appeal
10% 30%
Percent reduction in
taxable value
0 .5 1 1.5 2
First−pass assessment ratio
2009−2015
85% 95%100%
Percent of properties
winning an appeal
0 .5 1 1.5 2
First−pass assessment ratio
2009−2015
Cook County 2003−2015
Single Family Condominiums
Cook County is divided into three assessment areas, each of which is reassessed every three years. The cyclical pattern in the rate of
appeal observed in the first graph of this panel reflects the fact that there are many more properties in the City of Chicago, the first
assessment traid, than there are in the other two triads.
10

Figure 4: Impact of the Housing Bubble on volume and prices in Cook County’s housing market.
$150k $200k $250k $300k $350k
Sale value of homes
(net personal property)
2003
2004
2005
2006
2007
2008
2009
2010
2011
2012
2013
2014
2015
Tax year
by triennial reassessment area
Median sale value of homes
0 10000 20000 30000 40000
Residential sales
(thousands of sales)
2003
2004
2005
2006
2007
2008
2009
2010
2011
2012
2013
2014
2015
Tax year
by triennial reassessment area
Volume of residential sales
Chicago NW Suburbs SW Suburbs
11

Figure 5: Price-Related Differential
1 1.1 1.2 1.3 1.4 1.5
2003
2004
2005
2006
2007
2008
2009
2010
2011
2012
2013
2014
2015
year
Single−Family Condominiums
Price−related differential
12

Figure 6: Correlation between condominium building size and probabilty of appeal
0% 20% 40%
Probability of appealing
0 200 400 600 800
Number of units in
condominium building
By size of building
Probability of appealing
13

Figure 7: Regressivness in property taxes and assessments
.005 .01 .015 .02 .025
Effective tax rate on housing wealth
$500k $1mln $1.5mln $2mln
Sale value of property
For 113750 properties sold in Chicago 2009−2015.
Chicago 2009−2015
Effective tax rates
.5 1 1.5
Assessment ratios
$500k $1mln $1.5mln $2mln
Sale value of property
For 230177 properties sold in Cook County 2009−2015.
Cook County 2009−2015
Assessment Ratios
Single−Family Condominiums
14

Figure 8: Demographic correlates with effective tax rates
.012 .013 .014 .015 .016
Effective Tax Rate
on housing wealth
0% 20% 40% 60% 80% 100%
% African American
.01 .012 .014 .016 .018
Effective Tax Rate
on housing wealth
0% 20% 40% 60% 80%
% Hispanic
1.3% 1.5% 1.7%
Effective Tax Rate
on housing wealth
$31K $5K $100K $120K
Household income
.01 .012 .014 .016 .018
Effective Tax Rate
on housing wealth
20% 40% 60% 80%
% College Educated
For 97918 properties sold between 2009−2015
Chicago 2009−2015
15

Figure 9: Map of probability of filing a tax appeal by 2010 Cenusus tract
Quintiles of probability
of appealing
5th quintile
4th quintile
3rd quintile
2nd quintile
1st quintile
Cook County 2010 Census Tracts 2009−2015
Appeal rates
16

Figure 10: Map of post-appeal assessment ratios
Quintiles of post−appeal
assessment ratio
5th quintile
4th quintile
3rd quintile
2nd quintile
1st quintile
Cook County 2010 Census Tracts 2009−2015
Final Assessment Ratios
17

Figure 11: Map of mean effective tax rate by 2010 Cenusus tract
Quintiles of effective
tax rates
5th quintile
4th quintile
3rd quintile
2nd quintile
1st quintile
2010 Chicago Census Tracts 2009−2015
Effective tax rates
18

Figure 12: Map of mean residential sale value by 2010 Cenusus tract
Quintiles of mean
property value
5th quintile
4th quintile
3rd quintile
2nd quintile
1st quintile
2010 Cook County Census Tracts 2009−2015
Mean home value
19

Figure 13: Effect of applying a uniform tax rate to properties sold in 2011
−2 0 2 4 6 8
Avg. difference in uniform rate and
actual tax bills
(Thousands of $)
30 130 210 360 2940
Sale price of property
(Thousands of $)
1%
Uniform rate
2%
3%
Effective tax rate
on housing wealth
30 130 210 360 2940
Sale price of property
(Thousands of $)
For 13539 properties sold in Chicago in 2011
2011
20

Table 1: Effect of appeals on PRD by year
Year Number of
sales
First-pass
assessments
Margin of
error for
first-pass PRD
Final
assessments
Effect of
appeals on
PRD
Condominiums
2003 23647 .9804941 .0009667 .9864979 .0060037
2004 24687 .9992108 .0010699 1.0029 .0036888
2005 26361 1.003314 .001001 1.005927 .0026129
2006 22623 .9929795 .00108 .9989655 .005986
2007 20373 1.020422 .0013968 1.020143 -.0002795
2008 12757 1.079148 .002971 1.086757 .0076089
2009 13497 1.111139 .0048721 1.126737 .0155981
2010 12155 1.214219 .0089586 1.216193 .0019739
2011 10932 1.453566 .0112359 1.487601 .0340348
2012 11989 1.140018 .0063924 1.161866 .0218487
2013 15701 1.099589 .002935 1.09847 -.001119
2014 15059 1.063391 .0022468 1.069806 .0064142
2015 15057 1.002597 .0017878 1.015389 .0127921
Single-family homes
2003 47848 1.033248 .001004 1.034837 .0015888
2004 51599 1.016408 .0010209 1.018406 .0019974
2005 52785 1.035401 .0011508 1.037576 .0021751
2006 40962 1.025603 .001064 1.028046 .0024426
2007 28624 1.025314 .0015414 1.03179 .0064753
2008 17352 1.082953 .0034686 1.091926 .0089734
2009 16782 1.098144 .0034911 1.112224 .0140803
2010 17776 1.136879 .0037595 1.152979 .0161002
2011 16221 1.208911 .0052592 1.218689 .0097774
2012 18426 1.125253 .0034523 1.135212 .0099592
2013 24365 1.105195 .0024773 1.109264 .0040691
2014 21290 1.0922 .0021832 1.094257 .0020574
2015 20927 1.056025 .0019525 1.063649 .0076243
21

Table 2: Correlates with appealing, winning appeal
First-pass Probability of Probability of % reduction in Effective tax
assessments appealing winning an appeal taxable value rate
Property Characteristics
Sale price 4.87e-13 3.57e-13
∗∗∗
8.69e-13
∗∗∗
4.69e-13
∗∗∗
-1.34e-13
∗
($100,000) (1.89) (3.66) (4.35) (3.64) (-2.39)
Ratio of first-pass estimated 0.0315
∗∗∗
0.236
∗∗∗
0.174
∗∗∗
1.099
∗∗∗
market value to realized market value (6.61) (14.67) (5.45) (33.68)
Condominium 0.00631 0.0842
∗∗∗
0.139
∗∗∗
0.0201 -0.00741
(0.37) (13.51) (9.34) (1.18) (-1.01)
Number of units in -0.00442
∗∗
0.00620
∗∗∗
0.000148 0.00225 -0.00457
∗∗∗
a building (-3.18) (10.53) (0.16) (1.48) (-8.70)
Squared number of units 0.0000174 -0.0000246
∗∗∗
-0.000000105 -0.00000381 0.0000239
∗∗∗
in a building (1.49) (-4.01) (-0.01) (-0.46) (3.31)
Property Characteristics
% non-white 0.0100
∗∗∗
-0.000267
∗∗∗
0.00343
∗∗∗
-0.000769 0.00279
∗∗∗
and/or hispanic (50.22) (-4.15) (12.38) (-0.76) (8.69)
% Holding a BA or higher 1.452
∗∗∗
0.183
∗∗∗
0.458
∗∗∗
-0.231
∗∗∗
0.471
∗∗∗
(29.32) (9.53) (10.90) (-4.65) (10.22)
N 589259 589259 90016 90016 279428
r2 0.782 0.267 0.661 0.00196 0.913
t statistics in parentheses
Errors clustered on 2010 Census Tracts
∗
p < 0.05,
∗∗
p < 0.01,
∗∗∗
p < 0.001
22

Appendix B: Alternate measures of vertical equity
In addition to PRD, I also calculate Price Related
Bias (PRB), and a version of the Suites Index. Price
Related Bias is calculated by regressing the adjusted as-
sessment ratio against the adjusted mean sales price for
a given period, and capturing the resulting coefficient β
1
.
I trim the first and last percentile of assessment ratios
from my annual regression samples, which is consistent
with standard assessment practices. My regression is:
Y
i
= β
0
+ β
1
X
i
+
i
(2)
where
Y
i
=
V
i
− Median(E
CCAO
[V ])
Median(E
CCAO
[V ])
(3)
and
X
i
=
ln(
E
CC AO
[V
i
]
(Median(E
CC AO
[V ])
+ V
i
)
2ln(2)
(4)
Where Med(E
CCAO
[V ]) is the median CCAO estimated
market value.
PRD is positively correlated with regressiveness,
while PRB is negatively correlated with regressiveness.
The standard “acceptable” bounds for PRB are 0 ± .03.
The PRB may be interpreted as the effect of doubling
a property’s value on that property’s assessment ratio.
In 2015, the post-appeal PRB figure for the County was
-.042. The interpretation of this coefficient is that dou-
bling a property’s value would be associated with an
decrease in its assessment ratio by 4.2%. As with PRD,
I calculate PRB from both first and final assessment ra-
tios to measure the impact of appeals on progressiveness,
and find qualitatively identical results to PRD.
The Suites Index is given:
S = 1 − (1/5000)
Z
100
0
T (Y )dy (5)
S ≈
N
X
i=0
[T (Y
i
) + T (Y
i−1
)][Y
i
− Y
i−1
] (6)
where Y and T (Y ) are the cumulative percentage of the
total income and the corresponding cumulative percent-
age of tax burden, respectively. I use property value in
lieu of income, since I cannot directly observe individual
taxpayers’ incomes. I therefore calculate this Suites in-
dex using the subsample of properties which sold in each
year.
Figure 14 shows the “Suites Curve” plotted with a
45 degree line, representing a proportional distribution
of taxes across property values. In the figure, the Suites
Curve lies above the proportional line, indicating that
lower value properties bear a disproportional larger por-
tion of the property tax burden.
Since the Suites Index can only be calculated using
actual taxes paid, I cannot calculate a pre- and post-
appeals Index. In order to recalculate taxes for individ-
ual taxpayers supposing they had not appealed, I would
have to make an assumption about the effect if a larger
tax base on the statutory tax rate. Tax levies are set
ex ante the determination of the tax base, and tax rates
are determined simply by the ratio of the tax levy to
the base. Changing the base by excluding appeals will
increase the statutory rate in a somewhat unpredictable
way. Thus, I present indices only for post-appeal taxes.
23

Figure 14: Price-Related Differential
0 .2 .4 .6 .8 1
Cumulative proportion of total tax
0 .2 .4 .6 .8 1
Cumulative proportion of total property values
Suites Curve Proportional Distribution
Cook County, 2003−2015
Suites Curve
24

Table 3: Price-related Bias and Suites Indices
Year Number of
sales
First-pass
assessments
Final
assessments
Margin of
error for
first-pass
PRB
Effect of
appeals on
PRB
Suites Index Margin of
errror
2003 71495 -.0252729 -.02802 .0008249 -.0027471 .0037802 .0015675
2004 76286 -.0169512 -.0185279 .0008047 -.0015767 -.0048736 .0014858
2005 79146 -.037817 -.0383912 .0008311 -.0005742 -.003165 .0015807
2006 63585 -.0164822 -.0196375 .0008008 -.0031553 .0060896 .001734
2007 48997 -.0205835 -.0219423 .0010023 -.0013588 -.0183435 .0019752
2008 30109 -.0720933 -.0780768 .0014491 -.0059834 -.0779939 .00343
2009 30279 -.118095 -.1312703 .0021423 -.0131753 -.1106438 .0044872
2010 29931 -.146046 -.1514736 .0020353 -.0054276 -.1760897 .0064089
2011 27153 -.1864577 -.1939308 .0020569 -.0074731 -.3616682 .0078987
2012 30415 -.1304321 -.1353229 .0014716 -.0048909 -.1064669 .0042314
2013 40066 -.1122607 -.1064409 .0011106 .0058197 -.0896962 .0029003
2014 36349 -.0866059 -.0853196 .0010966 .0012862 -.079108 .003676
2015 35984 -.0353427 -.0426762 .001061 -.0073335 -.0325671 .0022702
25
