
U.S. Department of the Interior
U.S. Geological Survey
Prepared in cooperation with the U.S. Army Corps of Engineers
Behavior, Passage, and Downstream Migration of
Juvenile Chinook Salmon from Detroit Reservoir to
Portland, Oregon, 2014–15
Open–File Report 2015–1220
Cover: Photograph of Detroit Dam taken on July 12, 2011, by Matthew Sholtis, U.S. Geological Survey.
Inset: Photograph of the tailrace of Detroit Dam taken on July 9, 2011, by Scott Evans, U.S. Geological Survey.
Behavior, Passage, and Downstream Migration of
Juvenile Chinook Salmon from Detroit Reservoir to
Portland, Oregon, 2014–15
By Tobias J. Kock, John W. Beeman, Amy C. Hansen, Hal C. Hansel, Gabriel S. Hansen, Tyson W. Hatton, Eric E.
Kofoot, Matthew D. Sholtis, and Jamie M. Sprando
Prepared in cooperation with the U.S. Army Corps of Engineers
Open-File Report 2015–1220
U.S. Department of the Interior
U.S. Geological Survey
U.S. Department of the Interior
SALLY JEWELL, Secretary
U.S. Geological Survey
Suzette M. Kimball, Acting Director
U.S. Geological Survey, Reston, Virginia: 2015
For more information on the USGS—the Federal source for science about the Earth,
its natural and living resources, natural hazards, and the environment—visit
http://www.usgs.gov/ or call 1–888–ASK–USGS (1–888–275–8747).
For an overview of USGS information products, including maps, imagery, and publications,
visit http://www.usgs.gov/pubprod/.
Any use of trade, firm, or product names is for descriptive purposes only and does not imply
endorsement by the U.S. Government.
Although this information product, for the most part, is in the public domain, it also may
contain copyrighted materials as noted in the text. Permission to reproduce copyrighted items
must be secured from the copyright owner.
Suggested citation:
Kock, T.J., Beeman, J.W., Hansen, A.C., Hansel, H.C., Hansen, G.S., Hatton, T.W., Kofoot, E.E., Sholtis, M.D.,
and Sprando, J.M., 2015, Behavior, passage, and downstream migration of juvenile Chinook salmon from Detroit
Reservoir to Portland, Oregon, 2014–15: U.S. Geological Survey Open-File Report 2015-1220, 30 p.,
http://dx.doi.org/10.3133/ofr20151220.
ISSN 2331-1258 (online)
iii
Contents
Abstract ...................................................................................................................................................................... 1
Introduction ................................................................................................................................................................. 2
Methods ...................................................................................................................................................................... 5
Dam Operations and Environmental Conditions ..................................................................................................... 5
Transmitters ............................................................................................................................................................ 6
Fish Handling, Tagging, and Release ..................................................................................................................... 6
Fish Monitoring Array .............................................................................................................................................. 7
Data Proofing and Processing................................................................................................................................. 9
Removing False-Positive Records....................................................................................................................... 9
Identifying Dead Tags Prior to Release ............................................................................................................... 9
Final Telemetry and Passive Integrated Transponder Tag Dataset ................................................................... 10
Forebay Arrival, Passage at Detroit Dam, and Detection at Downstream Gates ............................................... 10
Data Analysis Using Mark-Recapture Models ....................................................................................................... 11
Transmitter Life Expectancy, Transmitter Loss, and Downstream Movement of Dead Fish .............................. 11
Paired-Release-Recapture Study Design .......................................................................................................... 12
Single-Release-Recapture Study Design .......................................................................................................... 13
Probability of Passive-Integrated-Transponder-Tag Detection at the Bennett Dam
Complex and Willamette Falls ....................................................................................................................... 13
Reach-Specific Survival Estimates ................................................................................................................ 13
Results ...................................................................................................................................................................... 14
Dam Operations and Environmental Conditions ................................................................................................... 14
Fish Handling, Tagging, and Release ................................................................................................................... 16
Removal of Dead Tags Prior to Release ........................................................................................................... 17
Transmitter Life Expectancy, Transmitter Loss, and Downstream Movement of Dead Fish ................................. 17
Forebay Arrival, Passage at Detroit Dam, and Detection at Downstream Gates .................................................. 19
Probability of Passive-Integrated-Transponder-Tag Detection at the Bennett Dam
Complex and Willamette Falls ............................................................................................................................... 22
Reach-Specific Survival Estimates ................................................................................................................ 25
Discussion ................................................................................................................................................................ 25
Acknowledgments ..................................................................................................................................................... 28
References Cited ...................................................................................................................................................... 28
iv
Figures
Figure 1. Schematic of the study area showing locations where acoustic telemetry equipment (circles) and
Passive Integrated Transponder tag antennas (triangles) monitored tagged fish, 2014–15 ...................................... 3
Figure 2. Elevation view of the upstream side of Detroit Dam, Oregon, showing outlet structures and
elevations of full and minimum conservation pool ...................................................................................................... 3
Figure 3. Image showing the locations of Upper Bennett Dam, Lower Bennett Dam, and the Stayton Canal (rkm
223–220) on the North Santiam River, Oregon .......................................................................................................... 8
Figure 4. Graphs showing daily mean operations and environmental conditions at Detroit Reservoir, Oregon,
August 11–October 28, 2014, when fish were released and detected in the reservoir ............................................ 15
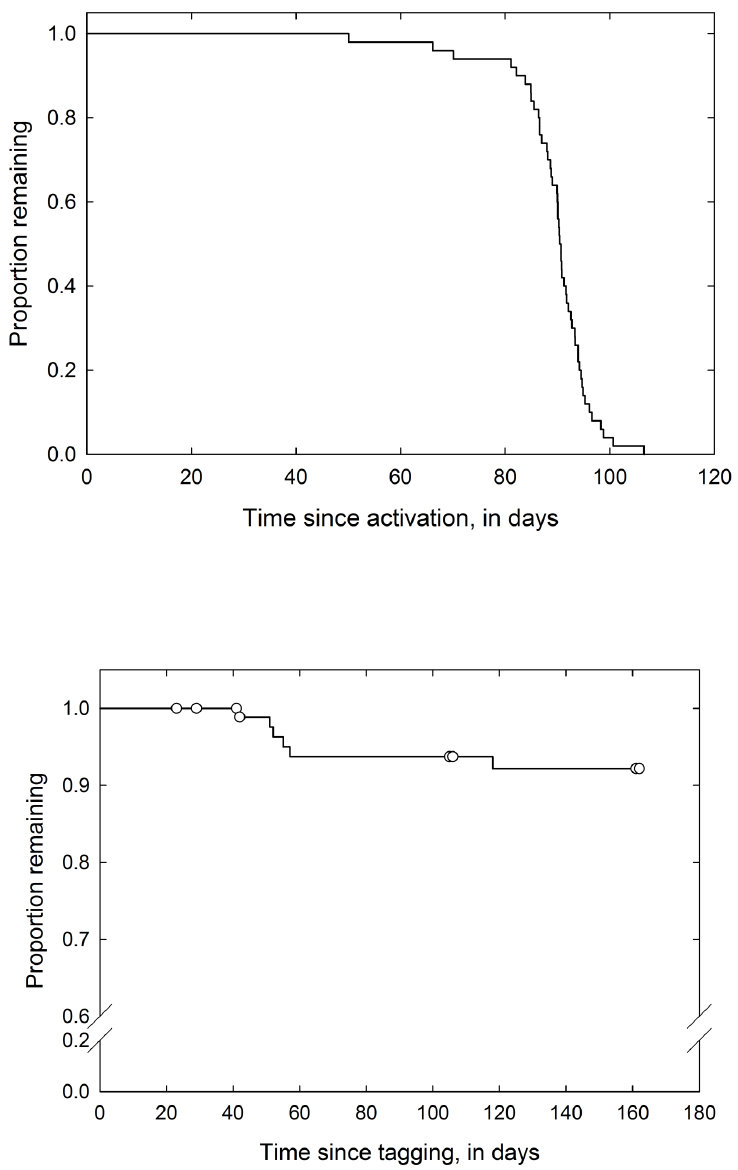
Figure 5. Graph showing survival distribution function of tag life from activation to expiration for the
acoustic tags used at and downstream of Detroit Reservoir, Oregon, 2014–15 ...................................................... 18
Figure 6. Graph showing survival distribution function of transmitter loss from a laboratory study
conducted at the Columbia River Research Laboratory, Washington, 2014–15 ...................................................... 18
Figure 7. Graph showing survival distribution of travel time from release on the North Santiam River
to the forebay in Detroit Reservoir, Oregon, of acoustic-tagged Chinook salmon, 2012–14 .................................... 20
Figure 8. Graphs showing survival distribution function of travel time from the control release near Minto Dam to
the Bennett Dam complex and from the control release near Minto Dam to Willamette Falls, Oregon, of tagged
Chinook salmon, 2014 ............................................................................................................................................. 23
Figure 9. Graphs of daily river flows in the North Santiam River, near Stayton, Oregon, and the
Willamette River in Portland, Oregon, August 2014–July 2015 ............................................................................... 24
Tables
Table 1. Definitions of passage efficiency and effectiveness metrics. .................................................................... 11
Table 2. Summary statistics of fork length and weight of acoustic- and Passive-Integrated-Transponder-tagged
hatchery Chinook salmon used in data analyses at Detroit Reservoir, Oregon, 2014 ............................................. 16
Table 3. Forebay arrival metrics and 95-percent confidence intervals for acoustic-tagged Chinook salmon at
Detroit Dam, Oregon, 2012–14 ................................................................................................................................ 19
Table 4. Seasonal passage metric estimates and 95-percent confidence intervals from the study of acoustic-
tagged Chinook salmon at Detroit Dam, Oregon, 2014 ........................................................................................... 20
Table 5. Number of treatment and control fish released and detected at acoustic telemetry and Passive
Integrated Transponder (PIT) tag monitoring sites in the North Santiam and Willamette Rivers, Oregon,
within the 90th percentile of the tag life of acoustic transmitters used during the study ........................................... 21
Table 6. Monthly detections of acoustic+PIT-tagged Chinook salmon on Passive-Integrated-Transponder-tag
antennas at the Bennett Dam complex and Willamette Falls, Oregon, 2014–15 ..................................................... 21
Table 7. Reach-specific survival estimates from a Cormack-Jolly-Seber mark-recapture model for juvenile
Chinook salmon in the North Santiam, Santiam, and Willamette Rivers, Oregon, 2014 .......................................... 25

v
Conversion Factors
Inch/Pound to International System of Units
Multiply
By
To obtain
foot (ft)
0.3048
meter (m)
cubic foot per second (ft
3
/s)
0.02832
cubic meter per second (m
3
/s)
International System of Units to Inch/Pound
Multiply
By
To obtain
millimeter (mm)
0.03937
inch (in.)
centimeter (cm)
0.3937
inch (in.)
meter (m)
3.281
foot (ft)
kilometer (km)
0.6214
mile (mi)
kilometer (km)
0.5400
mile, nautical (nmi)
liter (L)
0.2642
gallon (gal)
gram (g)
0.03527
ounce, avoirdupois (oz)
Temperature in degrees Celsius (°C) may be converted to degrees Fahrenheit (°F) as:
°F = (1.8 × °C) + 32.
Datum
Vertical coordinate information is referenced to the National Geodetic Vertical Datum of 1929 (NGVD 29).
Elevation, as used in this report, refers to distance above the vertical datum.
Abbreviations
CJS Cormack Jolly Seber
HOR Head of Detroit Reservoir
JSATS Juvenile Salmonid Acoustic Telemetry System
MFH Marion Forks Hatchery
MTR Minto Dam tailrace
ODFW Oregon Department of Fish and Wildlife
PIT Passive Integrated Transponder
USACE U.S. Army Corps of Engineers
USGS U.S. Geological Survey
UWR Upper Willamette River
vi
This page left intentionally blank
1
Behavior, Passage, and Downstream Migration of Juvenile
Chinook Salmon from Detroit Reservoir to Portland,
Oregon, 2014–15
By Tobias J. Kock, John W. Beeman, Amy C. Hansen, Hal C. Hansel, Gabriel S. Hansen, Tyson W. Hatton, Eric E.
Kofoot, Matthew D. Sholtis, and Jamie M. Sprando
Abstract
An evaluation was conducted to estimate dam passage survival of juvenile Chinook salmon
(Oncorhynchus tshawytscha) at Detroit Dam during a period of spill. To estimate dam passage survival,
we used a paired-release recapture study design and released groups of tagged fish upstream (997 fish)
and downstream (625 fish) of Detroit Dam. A total of 43 fish (6.8 percent) passed Detroit Dam from the
upstream release group and passage occurred through regulating outlets (54.8 percent), spill bays (31.0
percent), and turbines (14.3 percent). We do not present dam passage survival estimates from 2014
because these estimates would have been highly uncertain due to the low number of fish that passed
Detroit Dam during the study. Secondary objectives were addressed using data collected from tagged
fish that were released at the downstream release site.
Juvenile salmonids have multiple passage options at the Bennett Dam complex, which includes a
series of dams and braided channels. A pair of Passive Integrated Transponder (PIT) monitoring arrays
were installed at Upper Bennett Dam and in the Stayton Canal by the U.S. Army Corps of Engineers
and the Oregon Department of Fish and Wildlife during 2014. We deployed acoustic telemetry
hydrophones near these arrays to detect acoustic-tagged fish from our study and used these detections to
quantify proportions of tagged fish passing through the two routes. About one-fourth (0.257) of the
tagged fish that were released downstream of Big Cliff Dam were detected on the new PIT tag array
while passing the Bennett Dam complex. A total of 402 acoustic-tagged fish were detected at the
complex and many (248 fish; 62 percent) eventually entered the Stayton Canal. Median residence time
in the canal was 6.5 hours, but 12.7 percent of the fish had extended residence times (7–37 days).
Passage also was monitored at the Sullivan Project at Willamette Falls and about 40 percent (0.398) of
the tagged fish passing the project were detected on the PIT tag array.
2
A Cormack-Jolly-Seber mark-recapture model was developed to provide reach-specific survival
estimates for juvenile Chinook salmon. A portion of the tagged population overwintered in the
Willamette River Basin and outmigrated several months after release. As a result, survival estimates
from the model would have been negatively biased by factors such as acoustic tag failure and tag loss.
Data from laboratory studies were incorporated into the model to provide survival estimates that
accounted for these factors. In the North Santiam River between Minto Dam and the Bennett Dam
complex, a distance of 37.2 kilometers, survival was estimated to be 0.844 (95-percent confidence
interval 0.795–0.893). The survival estimate for the 203.7 kilometer reach between the Bennett Dam
complex and Portland, Oregon, was 0.279 (95-percent confidence interval 0.234–0.324), and included
portions of the North Santiam, Santiam, and Willamette Rivers. The cumulative survival estimate in the
240.9 kilometer reach from the Minto Dam tailrace to Portland was 0.236 (95-percent confidence
interval 0.197–0.275).
Introduction
The U.S. Army Corps of Engineers (USACE) operates the Willamette Valley Project (Project) in
western Oregon, which is comprised of a series of dams, revetments, and hatcheries. The primary
purpose of the Project is flood risk management, but it also is operated to provide hydroelectricity,
irrigation water, navigation, instream flows for wildlife, and recreation. The Project includes 13 dams,
about 68 km of revetments, and several fish hatcheries. Detroit Dam, and several other dams, are located
on tributaries of the Willamette River. In 2008, the National Oceanic and Atmospheric Administration
determined that the Project was jeopardizing the sustainability of anadromous fish stocks in the
Willamette River Basin (National Oceanic and Atmospheric Administration, 2008). This determination
has resulted in an increased need for quality data that can be used by fishery managers in the basin.
In 1953, the USACE constructed Detroit Dam on the North Santiam River, about 65 km east of
Salem, Oregon (fig. 1). The primary purposes of the 461 ft tall dam are flood control, power generation,
navigation, and recreation. The dam has six spill bays, five regulating outlets, and two Francis turbines
with a total hydraulic capacity of 5,340 ft
3
/s and a generating capacity of 115 megawatts. The ceilings of
the turbine intakes are at an elevation of 1,419 ft and the ceilings of the upper regulating outlet openings
are at an elevation of 1,356 ft (fig. 2). The spillway ogee is at an elevation of 1,541 ft. Reservoir
elevation normally ranges from 1,450 to 1,564 ft, with highest elevations in the summer and lowest
elevations in the winter, for flood control and recreation purposes. Fluctuations in discharge at Detroit
Dam to meet power demand are re-regulated at Big Cliff Dam, located 4.2 km downstream.
Detroit Dam is operated in coordination with other dams in the Project. Flood control dams
within the Project are filled during summer to benefit recreation and power generation and are drawn
down during autumn and winter to facilitate flood control. Detroit Dam is scheduled as the first dam in
the Project to fill during spring and the last dam to be drawn down during autumn; a flood-control
elevation of 1,450 ft is normally maintained from December 1 to January 31. Site-specific rules also
govern the use of the spillway and regulating outlets and their use is dependent on forebay water
elevations, so the two routes are rarely used together. Additionally, to meet the demand for electricity
and instream water temperatures and flows downstream, the powerhouse, spillway, and regulating
outlets are operated singly, in various combinations, or not at all, resulting in a variety of dam operating
conditions.

3
Figure 1. Schematic of the study area showing locations where acoustic telemetry equipment (circles) and
Passive Integrated Transponder tag antennas (triangles) monitored tagged fish, 2014–15.
Figure 2. Elevation view of the upstream side of Detroit Dam, Oregon, showing outlet structures and elevations of
full and minimum conservation pool. Also shown are the locations of cabled hydrophones on the upstream side of
the dam. Stars represent hydrophones affixed to the dam face, and circles indicate hydrophones deployed from a
floating platform attached to guide cables on the dam face.
4
The 2008 Willamette Biological Opinion requires improvements to Project operations and
structures to reduce impacts on Upper Willamette River (UWR) Chinook salmon (Oncorhynchus
tshawytscha) and UWR steelhead (Oncorhynchus mykiss) (National Oceanic and Atmospheric
Administration, 2008). The improvements include a requirement to mediate unseasonable water
temperatures passed through the high-head dam by 2017 and to install fish passage facilities (or
operational alternatives) at Detroit Dam by 2023. Among the alternatives designed to meet these
mandates is a temperature control structure at the dam that also enables downstream fish passage.
However, in the interim period, downstream passage of juvenile anadromous salmonids is to be
achieved with the current configuration of the dam. In 2007, the USACE initiated operations at Detroit
Dam to simultaneously pass water through the spillway and powerhouse (hereinafter temperature-
control spill). This operation results in a mixing of warmer surface water (passed through the spillway)
with cooler deep water (passed through the powerhouse) to yield water temperatures downstream of
Detroit Dam that are suitable for salmonids during summer and early autumn. Temperature-control spill
operations are terminated in late-summer/early-autumn when the forebay water elevation falls below the
spillway ogee elevation. Temperature-control spill operations are designed to improve water
temperature conditions downstream of Detroit Dam, but there is also evidence to suggest that these
operations improve dam passage conditions for juvenile salmon that out-migrate from Detroit Reservoir.
Several studies have shown that juvenile salmon passage rates are highest at Detroit Dam when
the spillway is operating and spillway passage survival appears to be high as well. Juvenile salmonid
passage was evaluated at Detroit Dam during 2012–14 when juvenile Chinook salmon and juvenile
steelhead were monitored using acoustic telemetry (Beeman and others, 2014; 2015). These studies
showed that juvenile salmonid passage was highest when spillway passage routes were available, and
the authors concluded that “the spring-dominated seasonal passage at Detroit Dam is largely owing to
the operation of the seasonally available spillway during spring and summer.” Results from another
study by the Oregon Department of Fish and Wildlife (ODFW) support the idea that spillway passage is
important for juvenile salmonids at Detroit Dam. In August 2012, two groups of PIT-tagged Chinook
salmon (12,500 fish per group) were released in the North Santiam River (T.A. Friesen and M.A.
Johnson, ODFW, written commun., February 2013). The first group was released at the head of Detroit
Reservoir (HOR), and the second group was released into the Minto Dam tailrace (MTR), 10 rkm
downstream of Detroit Dam. Migration patterns for each group were compared using PIT tag detections
at the Sullivan Hydroelectric Plant at Willamette Falls, Oregon City, Oregon, hereinafter called
Willamette Falls. Willamette Falls is located in the mainstem Willamette River, 252 rkm downstream of
Detroit Dam (fig. 1). The ratio of total detections between the two groups at Willamette Falls was
1.17MTR:1.00HOR, which suggests that downstream movements and survival rates were fairly similar
between the two groups, although the HOR group had to pass through two more reservoirs and dams
(including Detroit Dam) than the MTR group. The detections at Willamette Falls occurred primarily
during September and October 2012, which means that HOR fish were mostly passing Detroit Dam
when temperature-control spill operations occurred (spill was terminated on September 23, 2012).
Finally, Normandeau and Associates, Inc. (2010) evaluated passage route mortality at Detroit Dam
using balloon-tagged juvenile Chinook salmon. They found that direct survival varied by passage route
and dam operation but reported that 48-h post-passage survival ranged from 72 to 94 percent through
the regulating outlets, from 64 to 80 percent through the spillway, and was 54 percent through the
turbines. Given these findings, the USACE identified a need to acquire additional information on dam
passage survival of juvenile salmonids at Detroit Dam during periods of temperature-control spill.
5
This report summarizes an evaluation of dam passage survival at Detroit Dam that was
conducted during 2014–15. The evaluation was developed to duplicate the 2012 ODFW study and
included two groups of PIT-tagged fish (10,000 fish per group) with HOR and MTR release sites. A
subset of fish from each release group were also tagged with an acoustic transmitter, which allowed us
to maintain high detection probabilities of study fish at numerous locations throughout the North
Santiam and Willamette Rivers. The study was designed to estimate dam-passage survival at Detroit
Dam to specifically evaluate temperature-control spill operations, but we anticipated that downstream
detections of tagged fish would also allow us to address secondary objectives. Secondary objectives
included collecting data at two locations downstream of Detroit Dam—(1) the Bennett Dam complex;
and (2) Willamette Falls. The North Santiam River is braided at the Bennett Dam complex and water is
withdrawn from the river through the Stayton Canal, so multiple fish passage options exist for
downstream migrants. The USACE funded the deployment of two new PIT tag monitoring arrays at the
Bennett Dam complex during 2014. We monitored this area for passage of acoustic-tagged fish to help
determine which routes were used by migrants and to assess the performance of the PIT tag monitoring
arrays (Street and Faber, 2015). Willamette Falls is an important monitoring site in the Willamette River
Basin because it is the downstream-most location where year-round PIT tag monitoring occurs in the
mainstem Willamette River. As a result, PIT tag detections at Willamette Falls are often used in
calculations that estimate outmigration survival for juvenile salmonid populations within the basin.
These calculations require information about the probability of tagged fish passing through, and being
detected in, monitored passage routes at the dam. However, little information was available regarding
PIT tag detection probabilities at Willamette Falls. Thus, our study plan included an assessment of the
detection probability of PIT-tagged fish at Willamette Falls. Finally, a series of acoustic monitoring
arrays were located throughout the North Santiam and Willamette Rivers, and detection records from
these sites were analyzed to estimate reach-specific survival probabilities during the study period. This
report contains results for Chinook salmon that were tagged with acoustic transmitters and PIT tags and
monitored during August 2014–June 2015.
Methods
Dam Operations and Environmental Conditions
Powerhouse discharge, regulating outlet discharge, spillway discharge, forebay elevation, and
water temperature data from 2014 were summarized to document environmental conditions during the
study period. Hourly operation data from Detroit Dam were obtained from the USACE, which included
powerhouse discharge, regulating outlet discharge, regulating outlet openings, spillway discharge, spill
gate openings, and forebay elevation data. Hourly data records were averaged to create daily operation
records that were used for analysis or presented in plots in this report. Water elevation data are
presented in feet and discharge data are presented in cubic feet per second in accordance with local
convention. Hourly temperature data were obtained from the USACE Website, http://www.nwd-
wc.usace.army.mil/ftppub/water_quality/tempstrings. Diel periods were assigned using U.S. Naval civil
twilight records, which were obtained at http://www.usno.navy.mil/USNO/astronomical-
applications/astronomical-applications. River flow data were downloaded for USGS streamgages in the
North Santiam River (14183000) and Willamette River (14211720). Data were obtained at
http://waterdata.usgs.gov/usa/nwis/uv?site_no=14183000 and
http://waterdata.usgs.gov/usa/nwis/uv?site_no=14211720.
6
Transmitters
We surgically implanted an acoustic transmitter into each fish. We used the juvenile salmon
acoustic telemetry system (JSATS; McMichael and others, 2010). The model SS3300 JSATS tag was
manufactured by Advanced Telemetry Systems (ATS; Isanti, Minnesota) and had a mean mass in air of
0.31 g (range 0.27–0.32). The dimensions were 10.71 mm long × 5.20 mm wide × 3.07 mm deep.
Expected transmitter life at the nominal pulse rate interval (PRI) of 15 seconds was 90 days. A 12.5-
mm-long full-duplex PIT tag (model SST, Biomark, Boise, Idaho) weighing 0.10 g was inserted into
fish in June as part of the ODFW paired-release study.
Fish Handling, Tagging, and Release
The fish studied were hatchery subyearling Chinook salmon (hereinafter Chinook salmon) that
were reared, tagged, and held at the Marion Forks Hatchery (MFH) in Idanha, Oregon, prior to release.
Our study was developed in collaboration with ODFW, who were evaluating juvenile outmigration and
adult return patterns of PIT-tagged Chinook salmon released upstream and downstream of several large
reservoirs in the Willamette River Basin. The ODFW study was a multi-year effort and sample sizes for
individual release groups generally range from 10,000 to 30,000 fish per group. For our study, two
groups of Chinook salmon (10,000 fish each) were reared in separate concrete ponds at the MFH during
2014. The circular rearing ponds were 7.3 m in diameter and 0.65 m in depth and held 27,750 L of flow-
through river water. Fish in the first pond comprised the treatment group for our study and were
destined for release at the HOR. Fish in the second pond comprised the control group and were destined
for release into the MTR. All Chinook salmon in our study were PIT-tagged and a subset of the PIT-
tagged fish (approximately 10 percent) were also tagged with an acoustic transmitter. PIT-tagging
occurred during June 24–29, 2014, and acoustic tagging occurred during August 4–9, 2014. The ODFW
was responsible for PIT-tagging, and the U.S. Geological Survey (USGS) was responsible for acoustic
tagging.
Acoustic transmitters were surgically implanted into study fish using the acoustic tagging
protocol that was developed by the Surgical Protocols Steering Committee (Axel and others, 2011). Fish
were considered suitable for tagging if they were greater than or equal to 95 mm long; free of major
injuries; had no external signs of gas bubble trauma, major fin damage or fungus; were less than 20
percent descaled; and had no visible signs of deformities or disease. Fish size data collected during the
PIT-tagging process suggested that many of the Chinook salmon in the treatment and control ponds
would not be large enough for tagging by early August 2014. To increase the likelihood of tagging fish
in early August, MFH staff increased feed rates during July 2014 to increase fish growth. Fish were
sorted on July 22, 2014, to obtain fish that were large enough for acoustic tagging. During this process,
fish were removed from the ponds, anesthetized with buffered tricane methanesulfonate (MS-222,
Argent Chemical Laboratories, Redmond, Washington) and transferred into an indoor treatment or
control trough if they were greater than or equal to 90 mm long. Each indoor trough was 4.9-m-long,
1.0-m-wide, and 0.81-m-deep, and each one held 3,936 L of flow-through river water. Fish that failed to
meet the size minimum were returned to their original outdoor pond. A total of 1,317 Chinook salmon
were retained in the treatment trough and 1,518 Chinook salmon were retained in the control trough.
The fish were held in the indoor troughs for 11–17 days prior to tagging. The tagging protocol indicates
that fish should be held, without feeding, for 18–30 hours prior to tagging. To accomplish this, groups
of fish (approximately 300 fish per day) were transferred daily (beginning on August 3) from each
indoor trough into one of two pre-tag holding containers (246 L with flow-through river water), where
they were held overnight for tagging the following day. At the time of tagging, fish were anesthetized in
a MS-222 bath (80–90 mg/L). Weight and fork length data for each fish were collected prior to tag
7
implantation. All weighing, measuring, and containment equipment was treated with a 0.25 mL/L
concentration of Stress Coat
®
(Aquarium Pharmaceuticals, Inc., Chalfont, Pennsylvania) to reduce
handling-related stress (via electrolyte loss). Fish were placed into a 19-L perforated bucket filled with 7
L of river water immediately after surgery. Dissolved oxygen concentrations were maintained between
80 and 110 percent saturation during recovery. The maximum density in a recovery bucket was less than
13.5 g/L and no more than four tagged fish were held in a single bucket. Fish in the recovery buckets
were observed periodically during the first 10 minutes after surgery to ensure they recovered from
anesthesia. After the 10-minute recovery period, tagged fish were transferred from the recovery buckets
into the outdoor treatment or control pond. A subsample (25 fish) of the acoustic-tagged control fish
were placed into a third outdoor pond that was identical to the treatment and control ponds. These fish
were euthanized at the time of release of the control group and were released with the rest of the control
fish in the MTR to test one of the survival model assumptions (see section, “Transmitter Life,
Transmitter Loss, and Downstream Movement of Dead Fish”). All fish releases were made by ODFW
using a fish transport truck that held 3,785 L of water. Fish were released from the truck into the river
through a 38.6-cm-diameter hose.
Fish Monitoring Array
We used autonomous (non-cabled) and cabled JSATS hydrophones to monitor acoustic-tagged
fish during the study period. A 2011 assessment of JSATS hydrophone detection range in Cougar
Reservoir, Oregon, showed that 82 percent of the expected number of transmissions were successfully
logged at a range of 105 m, whereas only 10 percent of the transmissions were successfully logged at
180 m (U.S. Geological Survey, unpub. data, 2011). Based on these data, autonomous hydrophones
were deployed no more than 100 m from shorelines and no more than 200 m from the nearest
hydrophone (perpendicular to river flow) to achieve a high detection probability.
Hydrophone arrays were operated immediately upstream of the Detroit Dam forebay and on
Detroit Dam to detect tagged fish as they approached the dam. Five hydrophones were located upstream
of the Detroit Dam forebay (rkm 271) and were deployed using methods similar to those described by
Titzler and others (2010), except that burlap bags of sand were used as anchors. Fourteen hydrophones
were deployed on the face of Detroit Dam (fig. 2) using four JSATS cabled systems that were linked to
each other via a common clock. Each system was comprised of two or four hydrophones and a computer
that received a system time from a global positioning system (GPS) receiver (Meinberg GPS 170PCI,
Meinberg Funkuhren GmbH & Co. KG, Bad Pymont, Germany). The cabled hydrophone system is
described by Weiland and others (2009). Cabled hydrophones were installed at several elevations on the
face of Detroit Dam to provide detection coverage as forebay water levels changed. For example, four
hydrophones were located just below the crest of the spillway (fig. 2) and were operational only when
forebay water levels were higher than 1,531 ft. Detection ranges of dam-mounted hydrophones were
assumed to be similar to autonomous hydrophones in the forebay so fish detections were likely when
fish were within 100 m of the dam.
A series of acoustic telemetry and PIT tag monitoring sites were located downstream of Detroit
Dam to detect fish that moved through the North Santiam, Santiam, and lower Willamette Rivers (fig.
1). A total of 25 autonomous hydrophones were located at six monitoring sites downstream of Detroit
Dam: 2 each at Big Cliff and Minto Dams, 3 at the Bennett Dam Complex (fig. 3), and 6 each in Salem,
Wilsonville, and Portland. Hydrophones located downstream of Detroit Dam were deployed using
methods described by Beeman and Adams (2015). PIT tag monitoring sites were present at two
locations in the Bennett Dam complex (Upper Bennett Dam and the Stayton Canal) and at Willamette
Falls.

8
North
Santiam
River
Upper Bennett Dam
Lower Bennett Dam
Stayton Canal
Figure 3. Image showing the locations of Upper Bennett Dam, Lower Bennett Dam, and the Stayton Canal (rkm
223–220) on the North Santiam River, Oregon. Embedded photos show the locations of PIT tag antennas (yellow
circles) and acoustic hydrophones (yellow stars). Photo source: “Bennett Dam.” 44
o
47’32.64” N 122
o
45’34.25” W.
GOOGLE EARTH. July 14, 2014. January 28, 2015.
9
The USACE funded the installation of two new PIT tag monitoring sites that were deployed at
the Bennett Dam Complex prior to our study in 2014. Because we expected to have substantial numbers
of acoustic+PIT-tagged fish passing through the Bennett Dam complex, acoustic telemetry equipment
was installed near the PIT tag monitoring sites to help assess their performance and to quantify
proportions of fish using various routes. At Upper Bennett Dam, PIT tag antennas were located inside
the adult fish ladder, located on the southern end of the dam, and along the upstream side of the spillway
on the dam. One autonomous acoustic hydrophone was deployed upstream of the entrance to the adult
fish ladder to detect tagged fish as they approached Upper Bennett Dam (fig. 3). In the Stayton Canal,
PIT tag antennas were deployed at the upstream end of the pipe that returns fish to the North Santiam
River. Two autonomous hydrophones were deployed just upstream of the PIT tag antennas in the
Stayton Canal to detect fish that entered the canal. Additional descriptions of PIT tag sites at the Bennett
Dam Complex and system performance during 2014 can be found in Street and Faber (2015).
At Willamette Falls, PIT tag antennas are located inside the two juvenile fish bypasses and in the
adult fish ladders. However, fish can still pass through unmonitored routes (the spillway, for example)
and testing results suggested that detection probabilities of PIT tag antennas in the juvenile fish
bypasses are highly variable (Nick Ackerman, Portland General Electric, written commun., January
2015). We did not deploy acoustic hydrophones at Willamette Falls because our Wilsonville and
Portland sites have historically had very high detection probabilities and are located within 20 rkm of
the dam. Given these factors, we expected to detect almost all acoustic-tagged fish that migrated
through the Wilsonville-to-Portland reach, which would provide ideal conditions for determining the
proportion of PIT-tagged fish that were detected at Willamette Falls.
Data Proofing and Processing
Removing False-Positive Records
Acoustic telemetry data records were processed to remove false-positive detection events prior
to analyzing fish movement data. False-positive records indicate detection of a transmitter when the
transmitter was not present, and are common in most active telemetry systems (Beeman and Perry,
2012). We used a procedure developed by the Pacific Northwest National Laboratory (Mark Weiland,
Pacific Northwest National Laboratory, written commun., June 17, 2010) to remove false-positive
records. This procedure removed records if (1) the detection record was from a tag code that was not
released during the study; (2) the record matched criteria that indicated the detection likely resulted
from reflections of valid tag signals (multipath); (3) the detection record did not match a multiple of the
tag pulse interval; or (4) the record was not followed by at least three valid records from the autonomous
hydrophone or five valid records from a cabled hydrophone system (McMichael and others, 2010).
Additionally, detection records that were collected on the cabled hydrophone systems were retained
only if each detection event was simultaneously received on at least two hydrophones in the detection
array.
Identifying Dead Tags Prior to Release
Autonomous hydrophones monitored holding ponds at MFH to verify that transmitters were
functioning properly prior to fish releases. Detection records from the holding ponds were analyzed
during the 64-hour period that occurred immediately before each fish release. Tags that were detected
during the 64-hour pre-release period were considered to be functioning properly. Tags that were not
detected during the 64-hour pre-release period were considered non-functional, and were removed from
the final detection dataset.
10
Final Telemetry and Passive Integrated Transponder Tag Dataset
A final dataset was created by merging telemetry detection records with PIT-tag detection
records. The final telemetry dataset was developed by removing false-positive records and dead tags
from the preliminary telemetry dataset. A final PIT-tag dataset was created by querying the Columbia
Basin PIT Tag Information System (PTAGIS) Website (www.ptagis.org) for detection events of tagged
fish at PIT tag sites in the North Santiam, Willamette, and Columbia Rivers. These monitoring sites
included antennas at the Bennett Dam complex, Willamette Falls, and at various tributary and near-
shore monitoring arrays located in the lower Willamette and Columbia Rivers. The tagging and release
data, final telemetry dataset, and PIT tag detection records were then merged and sorted chronologically
for each fish in the study. The final dataset was then queried to summarize fish detections at specific
sites in the study area. These summaries were used to describe movement patterns of tagged fish and to
create capture histories that were analyzed using mark-recapture survival models.
Forebay Arrival, Passage at Detroit Dam, and Detection at Downstream Gates
The final dataset was analyzed to determine when fish arrived at Detroit Dam to assign route-of-
passage at the dam and to determine when fish passed monitoring sites downstream of the dam. Arrival
in the Detroit Dam forebay was assigned at the first date and time when tagged fish were detected on
hydrophones located 1 rkm upstream of Detroit Dam. Route of passage at Detroit Dam was assigned
using the physical location of the hydrophone that received the first detection of the last detection for
each tag, prior to passage. Spillway passage was assigned when tagged fish were last detected on
hydrophones located near the spillway, regulating outlet passage was assigned when tagged fish were
last detected on hydrophones located near the regulating outlet, and powerhouse passage was assigned
when fish were last detected on hydrophones located near the powerhouse. Previous studies included
metrics for fish movement through Detroit Reservoir and fish passage at Detroit Dam (Beeman and
others, 2014; 2015). The calculation of these metrics were included in our analysis, where possible, to
provide annual comparisons between studies. We also calculated a new metric, forebay arrival
efficiency, which is the number of fish detected in the forebay of Detroit Dam divided by the number of
fish released in the tributary upstream of Detroit Reservoir (table 1). Forebay arrival efficiencies from
autumn releases during 2012–14 were compared using a chi-square test of independence with a
Bonferroni correction to the P-value. Detection events downstream of Detroit Dam were summarized to
determine when tagged fish arrived at a site, using the date and time of the first detection event at that
site. Similarly, the date and time of the last detection at a given site was used to determine when a
tagged fish left that site. Residence time at a given site was calculated as the elapsed time between the
first and last detection events at that site. Travel time between sites was calculated as the elapsed time
between the last detection event at the upstream site and the first detection event at the downstream site.

11
Table 1. Definitions of passage efficiency and effectiveness metrics.
[RO, regulating outlet; Number, number of tagged fish]
Metric
Acronym
Definition
Forebay arrival efficiency
FAE
Number detected at forebay divided by number released.
Dam passage efficiency
DPE
Number passing the dam divided by number detected at forebay.
Spill passage efficiency
SPE
Number passing the spillway divided by number passing the dam with known
routes.
Turbine passage efficiency
TPE
Number passing the turbines divided by number passing the dam with known
routes.
RO passage efficiency
ROE
Number passing the RO divided by number passing the dam with known routes.
Fish passage efficiency
FPE
Percent passing through non-turbine routes (ROE plus SPE).
Data Analysis Using Mark-Recapture Models
Transmitter Life Expectancy, Transmitter Loss, and Downstream Movement of Dead Fish
Mark-recapture models are commonly used to analyze telemetry datasets when assessing
migration survival of juvenile salmonids. These models account for detection probabilities at monitoring
sites to provide unbiased estimates of migration survival as fish move between monitored areas in a
given study. Mark-recapture models are associated with a series of assumptions that can be empirically
assessed to minimize bias in model outputs. For example, mark-recapture models assume that live
tagged fish are detectable as they move downstream and pass a given monitoring site. However, this
may not be true if the transmitter inside a fish stops operating before the fish passes that site, or if the
fish sheds the transmitter prior to passing. These models also assume that fish detections occur only
when live fish pass downstream, but it is possible for dead fish to be detected if they are moving
downstream with river flow and possess an active transmitter. Consequently, it is important to evaluate
transmitter life expectancy, transmitter loss, and downstream movement of dead fish so that these
factors can be accounted for during the analysis process.
To determine transmitter life expectancy (hereinafter tag life), 50 transmitters were evaluated in
a laboratory setting during July–November 2014. These transmitters were randomly selected from the
transmitters that were available for the field study. The tag-life study was conducted in two 1.5-m-
diameter circular tanks at the Columbia River Research Laboratory (CRRL) in Cook, Washington.
Transmitters were activated on July 30 and 31, 2014, and placed into one of two plastic boxes that were
82.6 mm wide, 279.4 mm long, and 31.7 mm deep. The plastic boxes and transmitters were then
submerged in the circular tank where they remained for the duration of the study. Water temperatures in
the tank were controlled to simulate average monthly water temperatures in Detroit Reservoir during
August–November. Transmitter signals were monitored with an Advanced Telemetry Systems receiver
(Model Trident SR5000). Data were processed in the same manner as data collected during the study
period and were summarized using a Kaplan-Meier survivorship analysis (Allison, 1995).
12
Transmitter loss was also empirically evaluated in a laboratory study at CRRL during 2014–15.
A total of 94 fish were tagged on December 16 and 17, 2014, and evaluated through May 27, 2015. Fish
size and water temperature were controlled to insure that these variables matched conditions in the field
study. Fish were tagged with an acoustic transmitter and a PIT tag and held at approximately 12 °C in
one of two 1.5-m diameter circular tanks at the CRRL. Fish were fed six times per day at a 1.5
(maintenance diet) or 3 percent (growth diet) feed rate. The growth diet was intended to mimic the
feeding regime at MFH during summer 2014, prior to when acoustic tagging occurred. Tanks were
checked each weekday during the study for shed transmitters. Tag loss was assigned to the date the tank
was last checked prior to tag recovery. All fish were examined at 42 and 106 days post-tagging. On
these days, fish were lightly anesthetized, measured in length and weight, and photographs were taken
of the ventral and lateral sides of each fish. A random subsample of approximately 12 fish were also
removed on each examination day, euthanized, and necropsied for internal examinations. In addition, at
106 days we removed and necropsied one fish that was in the process of expelling the acoustic
transmitter. Tag-loss data were analyzed using a Kaplan-Meier survivorship analysis. Fish that were
removed for necropsies were right-censored at the day of sampling if tag loss had not occurred.
A subsample of the control fish were euthanized and released with the rest of the live control
fish to determine the rate of false positives in detections downstream (detection of dead fish with live
transmitters). As previously described, 25 of the acoustic-tagged fish from the control group were
randomly selected for euthanasia. These fish were held in a separate holding pond at MFH during the
post-tagging holding period to facilitate the euthanasia process that occurred on the day of the control
fish release. The euthanasia process began when live control fish were being loaded onto the fish
transport truck. At that time, control fish were removed from their holding pond and submersed in a 7 L
anesthetic bath of MS-222 (200 mg/L) for 30 minutes. Fish were transported to the release site during
the 30-minute submersion period, so the final two steps in the euthanasia process were conducted at the
release site. At the end of the 30-minute period, fish were removed from the anesthetic bath, their gill
arches were severed and they were pithed with a dissecting needle. The dead control fish were then
released with the live control fish.
Paired-Release-Recapture Study Design
A paired-release recapture study design (hereinafter paired-release design) was implemented to
estimate dam passage survival at Detroit Dam during 2014. The paired-release design is commonly used
when evaluating passage survival at hydroelectric dams and has been described in detail by Burnham
and others (1987), Skalski and others (2001), and Perry and others (2012). For our study, two groups of
fish were released in the North Santiam River. Treatment fish were released upstream of Detroit
Reservoir and control fish were released into the MTR. This release strategy was developed to achieve
an outcome in which a large number (≥400 fish) of treatment fish moved downstream and passed
Detroit Dam. If this occurred, sufficient numbers of treatment and control fish would be available to
provide robust dam passage survival estimates for Detroit Dam. However, the number of treatment fish
that passed Detroit Dam during 2014 was very low and survival estimates that would have been
obtained from analysis of paired-release data would have been highly uncertain. For this reason, we
chose not to conduct the dam passage survival analysis for this report and the remainder of this report is
focused on results of downstream migration timing and survival of the control group using the single
release-recapture design.
13
Single-Release-Recapture Study Design
Two Cormack-Jolly-Seber (CJS; Cormack, 1964; Jolly, 1965; Seber, 1965; Burnham and others,
1987) mark-recapture models were developed for analysis of data collected downstream of Minto Dam
during our study. These models were based on a single-release recapture study design (hereinafter single
release design) using control fish that were released in the MTR. The models were developed to
estimate proportions of tagged fish detected on PIT tag antennas at the Bennett Dam complex and at
Willamette Falls, and to estimate reach-specific survival for tagged fish that moved downstream of the
MTR to Portland. Each of the CJS models are described below.
Probability of Passive-Integrated-Transponder-Tag Detection at the Bennett Dam Complex and Willamette Falls
A CJS model was developed to estimate detection probabilities for PIT-tag monitoring sites at
the Bennett Dam complex and at Willamette Falls. This model incorporated acoustic detection records
from the Salem, Wilsonville, and Portland sites with PIT tag detection records from the Bennett Dam
complex and Willamette Falls. Detection probabilities at the acoustic telemetry sites generally were high
(>0.95), which provided the opportunity to obtain precise PIT tag detection probability estimates that
described the proportion of tagged fish that were detected at each location as fish moved downstream.
The CJS model relied heavily on acoustic detection records to estimate PIT tag detection probabilities.
Thus, estimates applied only to the period during which acoustic-tagged control fish were detectable at
acoustic monitoring sites based on the expected acoustic tag life (September 17, 2014, to November 22,
2014).
Reach-Specific Survival Estimates
A second CJS model was developed to estimate reach-specific survival for tagged fish moving
downstream from the MTR to Portland. This model was unique because it provided unbiased survival
estimates during September 2014–October 2015 by using the following data—(1) acoustic detection
records from September 17 to November 22, 2014, which were based on the timing of the control
release and the expected acoustic tag life; (2) PIT tag detection records from September 17, 2014, to
October 1, 2015, which were based on the timing of the control release and the last date in which PIT-
tagged fish were detected moving downstream and passing Willamette Falls; (3) acoustic tag-life data,
which were empirically determined as previously described; and (4) acoustic tag-loss data, which were
empirically determined as previously described.
14
Negatively biased survival estimates would result if tagged fish moved downstream after their
acoustic transmitter stopped working, or after losing their transmitter. These factors were accounted for
by using techniques described by Townsend and others (2006). We estimated two probabilities, P
O
and
P
R
. The former (P
O
) was the probability that a transmitter was operating when tagged fish were passing
the Bennett Dam complex and Willamette Falls. The latter (P
R
) was the probability that a transmitter
was retained by tagged fish that were passing the two sites. We used data from the tag-life and tag-loss
evaluations to develop Kaplan-Meier estimators used with travel time data to obtain group-averaged
probabilities for P
O
and P
R
at downstream detection arrays. Travel times were calculated for individual
fish from the time of release (in the MTR) to the time of arrival at the Bennett Dam complex and at
Willamette Falls (using PIT tag detections at each site). These travel times were then applied to the
Kaplan-Meier estimators using SAS (version 9.3 of the SAS System for Windows Copyright
©
2002–
2010, SAS Institute Inc., Cary, North Carolina; Allison, 2009) to obtain separate estimates for P
O
and P
R
at the Bennett Dam complex and at Willamette Falls. These estimates were then incorporated into the
likelihoods for the CJS model using Program USER (Lady and others, 2008), which allowed us to
obtain reach-specific survival estimates that were not biased by tag life or tag loss. The transmitter loss
evaluation was terminated 162 days post-tagging so we assumed that no tag loss occurred after 162
days.
Results
Dam Operations and Environmental Conditions
Reservoir water elevation and forebay water temperature decreased gradually from early August
to late October at Detroit Dam (fig. 4). The reservoir water elevation was 1,556 ft on August 11, 2014,
and decreased to 1,497 ft by October 28, 2014. Similarly, surface-water temperatures were 20.1 °C on
August 11, 2014, and decreased to 14.7 °C by October 28, 2014. Total project discharge varied little
during August (approximately 1,000 ft
3
/s) and was nearly evenly split between the powerhouse and
spillway (fig. 4). During September, there was a slight increase in total project discharge, and most
water was passed through the powerhouse. During October, total project discharge increased to about
3,000 ft
3
/s, and the spillway was not used (fig. 4). All October discharge passed through the powerhouse
and regulating outlet.

15
Figure 4. Graphs showing daily mean operations and environmental conditions at Detroit Reservoir, Oregon,
August 11–October 28, 2014, when fish were released and detected in the reservoir. Additionally, daily passage of
juvenile Chinook salmon was plotted as a percentage of fish released near the head of the reservoir (vertical bars).

16
Fish Handling, Tagging, and Release
A total of 1,692 Chinook salmon were tagged with acoustic transmitters during August 4–9,
2014. These included 997 treatment fish and 670 control fish (table 2). All treatment fish were released
alive and the control fish were comprised of 645 live and 25 euthanized fish. The average pre-tag
holding time was 22.3 hours (range 20.5–23.9) for treatment fish and 21.9 hours (range 19.4–25.8) for
control fish. The tagged fish were an average of approximately 102 mm in fork length and 5 g in weight.
There was no significant difference in either fork length or weight between groups (one-way GLM; P=
0.9637; P= 0.2902). Tag-weight-to-body-weight ratios (tag weight=acoustic transmitter weight + PIT
tag weight) averaged 3.2 percent (range 1.7–5.9 percent). Water temperatures during tagging ranged
from 10.3 to 15.4 °C.
The treatment fish were released on August 11, 2014, 2–7 days after tagging, at the Blowout
Road Bridge on the North Santiam River. The group was comprised of 997 acoustic+PIT fish and 9,036
PIT fish. The paired-release design assumes that treatment and control fish will experience similar
conditions within common migratory reaches, and the primary difference between the two groups is the
migratory experience that treatment fish encounter between their release location and the release
location for the control fish. Thus, the timing of the control release group was to occur when about one-
half of the treatment fish had arrived at the control release site location. Detections at Minto Dam were
monitored daily following the treatment release, and control fish were released about 1 month after the
treatment fish due to the low passage rates that occurred at Detroit Dam. The release of control fish
occurred in the MTR (at Packsaddle County Park) on September 17, 2014, 43–48 days after acoustic
tagging occurred and used the fish transport truck previously described. A total of 45 live control fish
and 2 dead control fish were not released or were omitted from data analyses for the following
reasons—32 live control fish shed their acoustic transmitter during the post-tagging holding period; 11
live control fish were released with acoustic transmitters that were not operational based on absence of
pre-release detections in the MFH holding pond; 2 live control fish died during the post-tagging holding
period; 1 dead control fish was removed from the MFH holding pond (probably by a predator) during
the post-tagging holding period; and 1 dead control fish shed its acoustic transmitter during the post-
tagging holding period. As a result, the control release group was comprised of 625 acoustic+PIT live
control fish, 23 acoustic+PIT dead control fish, and 9,324 PIT tag-only fish.
Table 2. Summary statistics of fork length and weight of acoustic- and Passive-Integrated-Transponder-tagged
hatchery Chinook salmon used in data analyses at Detroit Reservoir, Oregon, 2014.
[N, the number of fish; SD, standard deviation]
Release group N
Fork length (millimeters)
Weight (grams)
Mean
SD
Range
Mean
SD
Range
Treatment
997
102.7
5.3
95–123
13.1
2.3
8.9–23.7
Control: live
645
102.7
5.1
95–116
12.9
2.2
7.0–19.4
Control: dead
25
102.4
4.9
96–112
12.7
1.9
9.8–15.6
17
Removal of Dead Tags Prior to Release
Twelve of the acoustic tags within control fish and none of the acoustic tags within the treatment
fish were undetected during the 64-hour pre-release period. The 12 undetected tags were removed from
the final detection dataset. Eleven of the non-detected tags were from fish in the live control holding
pond that contained approximately 10,000 Chinook salmon (acoustic+PIT- and PIT-only fish). The
other non-detected tag was from a fish in the dead control holding pond that contained 25 Chinook
salmon (acoustic+PIT-only). Each of the dead control fish was handled at the time of release when the
euthanasia process was occurring. At that time, the fish with the non-detected tag was missing from the
holding pond. Because terrestrial and avian predators can access the MFH holding ponds, we suspect
that the fish was preyed upon at some point during the post-tag holding period. Predation events could
also explain nondetection events in the live control pond, but it was not possible for us to make this
determination due to the large number of fish that were being held at that location.
Transmitter Life Expectancy, Transmitter Loss, and Downstream Movement of Dead Fish
Results from the tag-life study showed that three transmitters expired prematurely, but most of
the transmitters operated for at least 80 days. The transmitters that stopped working earlier than
expected were last detected 50.0, 66.2, and 70.1 days after they began operating. Most (72 percent) of
the transmitters expired 85–95 d after activation. Median tag-life was 90.5 d and maximum tag-life was
106.5 d (fig. 5). The 90th percentile of tag-life during the study, the follow-up period used in evaluation
of travel times and dam passage, was 82.1 d (fig. 5).
A total of 7.8 percent of the acoustic-tagged fish shed transmitters during the 162-d study (fig.
6). Because tag-loss did not differ between feeding regimes (Wilcoxon test, chi-square=0.8824,
P=0.3476), data from both groups were pooled for analysis. All fish retained transmitters during the
initial 22 d post-tagging period, but shedding occurred from 23 to 118 d post-tagging. Some fish were
removed for necropsy at 42 and 106 d, reducing the total number of fish available in the dataset. In the
field study, tagged control fish were held for at least 39 d prior to release, which allowed us to monitor
tag-loss of that group during that period. In the laboratory study, three fish shed tags during the initial
39 days of the evaluation, so these events were right-censored for estimation of transmitter shedding.
Six of the Chinook salmon that were tagged for the tag-loss study shed their transmitter between 39 and
162 days.
Detection records at acoustic monitoring sites located downstream of the MTR were queried to
determine if any dead control fish drifted downstream and were detected. None of the dead control fish
were detected downstream of the MTR.
18
Figure 5. Graph showing survival distribution function of tag life from activation to expiration for the acoustic tags
used at and downstream of Detroit Reservoir, Oregon, 2014–15.
Figure 6. Graph showing survival distribution function of transmitter loss from a laboratory study conducted at the
Columbia River Research Laboratory, Washington, 2014–15. Observations are right-censored (open circles) when
fish were removed for necropsy or at the end of the study if no event occurred. Observations were also right-
censored if the event occurred prior to the control release (39 days after tagging).

19
Forebay Arrival, Passage at Detroit Dam, and Detection at Downstream Gates
Forebay arrival and dam passage of treatment fish were lower than expected during 2014. A total
of 572 of the 997 treatment fish released (57.4 percent) were detected in the forebay of Detroit Dam
within the 82.1-day follow-up period (table 3). The FAE for tagged fish in 2014 was significantly lower
(P<0.0001) than any of the previous releases that were conducted during autumn months in 2012 and
2013 (table 3). Median travel time from the release site to the dam forebay was 60.2 days in 2014,
which was substantially slower than travel times in 2012 and 2013 (fig. 7). A total of 43 fish were
detected passing Detroit Dam within the follow-up period. This accounted for 4.3 percent of the
acoustic+PIT-tagged fish that were released upstream of Detroit Reservoir and 7.5 percent of the
acoustic+PIT-tagged fish that arrived in the dam forebay. About one-half of the Chinook salmon
passing the dam passed through the RO (54.8 percent), and the remaining fish passed through the
spillway (31.0 percent) or the turbines (14.3 percent; table 4).
The number of tagged fish that passed Detroit Dam and then moved through downstream
reaches was low (tables 5–6). A total of 24 acoustic+PIT-tagged fish (2.4 percent) were detected in the
forebay of Big Cliff Dam, and 12 fish or less were detected at each of the remaining downstream
monitoring sites (tables 5 and 6). Few fish were detected at sites downstream of Minto Dam after
October 2014. Given that very few treatment fish were detected downstream of Detroit Dam, the
remaining analyses in this report were only conducted using detections of control fish.
Table 3. Forebay arrival metrics and 95-percent confidence intervals for acoustic-tagged Chinook salmon at
Detroit Dam, Oregon, 2012–14.
[Statistical results are also presented as P-values from a chi-square test of independence that was conducted using a
Bonferroni correction to control for multiple pairwise comparisons]
Year Release month
Number of fish
released
Number of fish
detected in
forebay
Estimate of
forebay arrival
efficiency
95 percent
confidence
interval
P-value
2012
September
84
65
0.774
0.674–0.850
0.060
October
90
69
0.767
0.670–0.842
0.069
November
87
65
0.747
0.647–.0827
0.225
2013
September
78
54
0.692
0.583–0.784
1.000
October
76
65
0.855
0.759–0.917
1
0.001
November
149
109
0.732
0.655–0.796
0.101
2014
August
997
572
0.574
0.543–0.604
1
<0.001
1
Releases that were significantly different than others in the group.

20
Figure 7. Graph showing survival distribution of travel time from release on the North Santiam River to the forebay
in Detroit Reservoir, Oregon, of acoustic-tagged Chinook salmon, 2012–14. Observations are right-censored (open
circles) on October 28 each year, which was the 90th percentile of the tag life for the 2014 fish. Fish from 2012 and
2013 were released during September each year and fish from 2014 were released during August.
Table 4. Seasonal passage metric estimates and 95-percent confidence intervals from the study of acoustic-
tagged Chinook salmon at Detroit Dam, Oregon, 2014.
Metric
Number of fish
in numerator
Number of fish
in denominator
Passage metric
estimate
95-percent
confidence
interval
Dam passage efficiency (DPE)
43
572
0.075
0.056–0.100
Fish passage efficiency (FPE)
36
42
0.837
0.700–0.919
Spillway passage efficiency (SPE)
13
42
0.310
0.191–0.460
Turbine passage efficiency (TPE)
6
42
0.143
0.067–0.278
Regulating outlet efficiency (ROE)
23
42
0.548
0.400–0.688

21
Table 5. Number of treatment and control fish released and detected at acoustic telemetry and Passive Integrated
Transponder (PIT) tag monitoring sites in the North Santiam and Willamette Rivers, Oregon, within the 90th
percentile of the tag life of acoustic transmitters used during the study.
[Numbers in parentheses are percentage of fish]
Description
Treatment fish
Control fish
PIT-tagged
Acoustic+PIT-tagged
PIT-tagged
Acoustic+PIT-tagged
Number of fish released
9,036
997
9,324
636
Detroit Dam Forebay
572 (57.4)
Big Cliff Dam
24 (2.4)
Minto Dam
9 (0.9)
Bennett Dam
52 (0.5)
9 (0.9)
1,349 (14.5)
242 (38.1)
Salem
12 (1.2)
257 (40.4)
Wilsonville
9 (0.9)
136 (21.4)
Willamette Falls
40 (0.4)
2 (0.2)
808 (8.7)
53 (8.3)
Portland
5 (0.5)
98 (15.4)
Table 6. Monthly detections of acoustic+PIT-tagged Chinook salmon on Passive-Integrated-Transponder-tag
antennas at the Bennett Dam complex and Willamette Falls, Oregon, 2014–15.
[Numbers in parentheses are percentage of fish]
Month and year
of detection
Treatment release group
(n=997)
Control release group
(n=625)
Bennett Dam complex
Willamette Falls
Bennett Dam complex
Willamette Falls
September 2014
5 (0.5)
1 (0.1)
91 (14.6)
11 (1.8)
October 2014
1 (0.1)
1 (0.1)
26 (4.2)
42 (6.7)
November 2014
1 (0.1)
1 (0.1)
3 (0.5)
1 (0.2)
December 2014
2 (0.2)
0 (0.0)
2 (0.3)
0 (0.0)
January 2015
0 (0.0)
0 (0.0)
1 (0.2)
0 (0.0)
February 2015
0 (0.0)
0 (0.0)
0 (0.0)
1 (0.2)
March 2015
0 (0.0)
0 (0.0)
0 (0.0)
5 (0.8)
April 2015
0 (0.0)
0 (0.0)
0 (0.0)
0 (0.0)
May 2015
0 (0.0)
1 (0.1)
0 (0.0)
0 (0.0)
June 2015
1 (0.1)
0 (0.0)
0 (0.0)
0 (0.0)
July 2015
0 (0.0)
0 (0.0)
0 (0.0)
0 (0.0)
August 2015
0 (0.0)
0 (0.0)
0 (0.0)
0 (0.0)
September 2015
0 (0.0)
0 (0.0)
0 (0.0)
0 (0.0)
Total
10 (1.0)
4 (0.4)
123 (19.7)
60 (9.6)
22
Probability of Passive-Integrated-Transponder-Tag Detection at the Bennett Dam Complex and
Willamette Falls
Control fish were released into the MTR in mid-September and began passing Bennett Dam and
Willamette Falls shortly thereafter (fig. 8). Travel times from the MTR to the Bennett Dam complex
were significantly different between acoustic+PIT-tagged fish and PIT-tagged fish (Wilcoxon chi-
square test, P=0.001) but were not significantly different from the MTR to Willamette Falls (Wilcoxon
chi-square test, P=0.833). Most of the passage at these locations occurred within 40 days of release, but
some fish were still passing Willamette Falls more than 6 months after release (fig. 8). However, the
acoustic transmitters were operational during September–November, when river flows were relatively
low (fig. 9). The CJS model estimate for detection probability of PIT-tagged fish at the Bennett Dam
complex was 0.257 (95-percent confidence interval 0.206–0.308). A total of 402 acoustic+PIT-tagged
fish were detected on acoustic hydrophones, PIT tag antennas, or both, at the Bennett Dam complex.
Based on these detections, 38.3 percent of the fish were only detected at Upper Bennett Dam, 39.8
percent were only detected in the Stayton Canal, and 21.9 percent were detected at both sites. A total of
123 acoustic+PIT-tagged fish were detected on PIT tag antennas at the Bennett Dam complex and 9.0
percent of the fish were only detected at Upper Bennett Dam, while 91.0 percent of the fish were only
detected in the Stayton Canal. Acoustic hydrophones in the Stayton Canal detected a total of 225
acoustic+PIT-tagged fish (56.0 percent of those detected at the Bennett Dam complex), but only 47.1
percent of those fish were subsequently detected on PIT tag antennas at that location. Telemetry records
from tagged fish in the Stayton Canal showed that 80 percent of the acoustic-tagged fish spent less than
1 day in the canal, and the median residence time at that location was 6.5 hours. However, 12.7 percent
of the tagged fish had residence times in the canal between 7 and 37 days.
The probability of tagged fish passing through and being detected by the PIT-tag antennas at
Willamette Falls was 0.398 (95-percent confidence interval 0.308–0.488). A total of 53 acoustic+PIT-
tagged fish were detected on PIT tag antennas at the dam and all these fish were detected in the fish
bypass rather than the adult fish ladder.

23
Figure 8. Graphs showing survival distribution function of travel time from the control release near Minto Dam to
the Bennett Dam complex and from the control release near Minto Dam to Willamette Falls, Oregon, of tagged
Chinook salmon, 2014. Asterisk (*) indicates significant difference between travel times.

24
Figure 9. Graphs of daily river flows in the North Santiam River, near Stayton, Oregon, and the Willamette River in
Portland, Oregon, August 2014–July 2015. The gray highlight identifies the period during which Passive-Integrated-
Transponder-tag detection probability estimates were obtained for the Bennett Dam complex and Willamette Falls.

25
Reach-Specific Survival Estimates
Tagged fish experienced substantial mortality as they moved downstream through the study area.
The probability of tagged fish arriving at the Bennett Dam complex with an operating acoustic
transmitter (P
O
) was 0.945 and the probability of retaining the transmitter (P
R
) until arrival at Bennett
Dam was 0.972. The P
O
for arrival at Willamette Falls was 0.869 and P
R
was 0.940. These probabilities
were used to provide unbiased (adjusted) estimates for migration survival from the MTR to the Bennett
Dam complex (0.844) and from the Bennett Dam complex to Portland (0.279; table 7). Overall, survival
from the MTR to Portland was estimated at 0.236. We calculated survival per 100 rkm for each reach to
provide standardized estimates that could be used to compare among reaches. These estimates showed
that survival rates were higher in the Minto Dam to Bennett Dam reach (0.634 per 100 km) than in the
Bennett Dam to Portland reach (0.534 per 100 km; table 7).
Table 7. Reach-specific survival estimates from a Cormack-Jolly-Seber mark-recapture model for juvenile Chinook
salmon in the North Santiam, Santiam, and Willamette Rivers, Oregon, 2014.
Reach
Reach length
(kilometers)
Survival
estimate
95-percent
confidence
interval
Survival per 100
river kilometers
Minto Dam tailrace to Bennett Dam complex
37.2
0.844
0.795–0.893
0.634
Bennett Dam complex to Portland
203.0
0.279
0.234–0.324
0.534
Minto Dam tailrace to Portland
240.2
0.236
0.197–0.275
0.549
Discussion
Downstream movement and dam passage rates for treatment fish were lower than expected
during 2014, which prevented us from estimating dam passage survival at Detroit Dam. Reservoir travel
time and forebay arrival rates were substantially lower in 2014 than in 2012 and 2013 for groups of fish
that were released at a common location near the HOR. There are several factors that differed between
the 2012–13 and 2014 release groups that could be responsible for this. North Santiam River flows
upstream of Detroit Reservoir were similar during late summer and early autumn in 2012–14, but during
2014, treatment fish were released into Detroit Reservoir during August when reservoir water
temperatures in the upper 6 m exceeded 22 °C. Releases for the 2012 and 2013 studies were conducted
during September, October, and November when reservoir water temperatures ranged from 7 to 21 °C.
Other studies have shown that juvenile Chinook salmon are less likely to migrate during August when
water temperatures approach or exceed 20 °C. In the Cowlitz River, Washington, Kock and others
(2015) released groups of radio-tagged juvenile Chinook salmon into Lake Scanewa during July and
August 2014. Most tagged fish that were released during July moved downstream and passed Cowlitz
Falls Dam, whereas many of the fish that were released during August, when water temperatures
exceeded 18 °C, stopped migrating and remained in Lake Scanewa. Similarly, in the Snake River,
Washington, radio-tagged juvenile Chinook salmon released upstream of Lower Granite Reservoir in
June and early July were much more likely to move downstream and enter the reservoir than tagged fish
that were released in late July (Tiffan and Connor, 2003, 2004). Water temperatures in that study during
June and early July were 18 °C or less, whereas temperatures during late July release periods exceeded
20 °C. Another factor that may have contributed to decreased movements by treatment fish during 2014
is the stock of fish that were tagged. During 2012 and 2013, study fish were wild surrogates that were
reared by Oregon State University as part of their Willamette River Basin wild surrogate program (D.J.
26
Noakes and others, Oregon State University, written commun., February 2013) This program was
developed to support research efforts in the Willamette River Basin by producing hatchery-reared
juvenile salmonids that exhibit desired phenotypes of naturally reared fish. During 2014, we used
hatchery-reared juvenile Chinook salmon from the MFH. Empirical data describing potential differences
in fish behavior between the two stocks used during our studies is not currently available. However, this
factor differed between the 2014 and 2012–13 studies and is worthy of consideration. Study fish from
2012 to 2013 were also larger than study fish from 2014. Mean fork length of tagged fish in 2012 and
2013 was 141.8 and 149.1 mm, respectively, compared to 102.7 mm in 2014 (Beeman and others, 2014;
Beeman and Adams, 2015). Tag burden was also lower for the 2012–13 fish (1.3 percent in 2012; 1.4
percent in 2013; 3.2 percent in 2014), owing to their larger body size.
Embedding groups of acoustic+PIT-tagged fish within larger groups of PIT-tag-only fish was
insightful for determining if acoustic-tag presence affected the behavior of study fish. Travel rates in the
37.2 rkm reach between Minto Dam and the Bennett Dam complex were faster for acoustic+PIT-tagged
fish than PIT-tag-only fish. However, the shape of the Kaplan-Meier curves for the two groups were
nearly identical, which suggests that migration behavior was similar between groups. For example, more
than one-half of the fish from each group arrived at Bennett Dam within 10 days of release, and a
substantial number of fish arrived at the dam near the 40-day post-release mark. At Willamette Falls,
travel time curves were nearly identical, and there was not a statistically significant difference between
groups. Additionally, the percentage of acoustic+PIT-tagged fish and PIT-tag-only fish that were
detected at Willamette Falls was similar within each release group (table 5). Given these relationships,
there appeared to be a short-term effect of acoustic-tag presence on migration behavior and this finding
agrees with observations of tag effects on short-term behavior of juvenile salmon in laboratory and field
studies (Perry and others, 2014). However, the existing data suggest that migration behaviors were
similar for acoustic+PIT-tagged fish and PIT-tag-only fish when examined over the entire study area
and duration of the study. This observation has important implications for future studies because there
are distinct advantages to using active transmitters (radio or acoustic) with PIT tags in fisheries studies.
The active transmitters have high detection probabilities that are critical for determining near-dam fish
behavior, describing two- or three-dimensional fish movement paths, determining route of passage
through areas of interest, and estimating migration or dam-passage survival using small sample sizes
compared to achieving similar precision using PIT tags. Alternatively, PIT tags are inexpensive and are
detectable for the entire lifespan of the tagged fish. In our study, the acoustic transmitters allowed us to
generate precise estimates of PIT tag detection probabilities at the Bennett Dam complex and
Willamette Falls. The PIT tags allowed us to monitor fish movements during the months after the
acoustic transmitters stopped working and to generate survival estimates that accounted for tag failure
and tag loss. Estimating travel times with PIT tags was superior to the use of active tags used in other
studies (Townsend and others, 2006) because they are not limited by a battery and provide unbiased
estimates of travel time.
Our estimates of detection probabilities of PIT-tagged fish at the Bennett Dam complex and at
Willamette Falls may be useful for future evaluations in the Willamette River Basin. The use of PIT tags
to monitor juvenile salmonids is very common because it provides a cost-effective option for
monitoring fish movement patterns and determining smolt-to-adult return rates for various fish stocks.
In the Willamette River Basin, reliable estimates of PIT-tag detection probabilities at Willamette Falls
are critical because the dam is the downstream-most location where PIT-tagged fish are reliably
detected as they migrate to the ocean. As a result, PIT-tag detections at Willamette Falls are routinely
used to make inferences about outmigration timing and survival for various juvenile salmon stocks in
the basin. A key uncertainty in these inferences is the proportion of tagged fish in a given population
that are detected at Willamette Falls. Fishery managers have generally assumed that about 10 percent of
27
the PIT-tagged fish are detected as they pass the project, but the detection probabilities of the PIT tag
antennas can be highly variable and are likely affected by river flow and equipment that is intermittently
operated near the antennas (Nick Ackerman, Portland General Electric, written commun., January
2015). Karchesky and others (2010) showed that river flows affected the proportion of fish passing
through various routes at the dam. They found that increasing river flow resulted in increased passage
over the “Falls,” which is not monitored by PIT-tag antennas. Forty percent of the tagged fish were
detected on PIT-tag antennas while passing Willamette Falls during September and October 2014.
Although this measurement is substantially higher than previously assumed, our data were collected
when river flows were low and spill was not occurring. Thus, our estimates apply only to flow
conditions during our study period. Given the importance of PIT-tag data collection at Willamette Falls,
future evaluations should be conducted to provide reliable estimates of detection probabilities at the
dam, under the full range of river flows and operating conditions. At the Bennett Dam complex, we
estimated that 26 percent of the PIT-tagged fish were detected as they moved downstream. River flows
are likely a key factor in detection probabilities at that location as well because several dams are present
and water passage over the spillways depends on river flow. Deploying PIT-tag antennas in the Stayton
Canal was a logical option because the canal is not dewatered seasonally, and fish that are entrained in
the canal are returned to the river through an outlet pipe that is conducive to PIT tag detection. Analysis
of the PIT-tag detection records at the Bennett Dam complex confirmed this assumption. Detections on
PIT-tag antennas showed that 91 percent of the acoustic+PIT-tagged fish that were detected at the
Bennett Dam complex were detected in the Stayton Canal.
Migration survival was low during the study. Approximately 84 percent of the tagged fish that
were released in the MTR survived to the Bennett Dam complex, but only 28 percent of the fish
survived from Bennett Dam to Portland. Standardized estimates showed that survival rates in the Minto
Dam to Bennett Dam reach were higher (0.634 per 100 rkm) than in the Bennett Dam to Portland reach
(0.534 per 100 rkm). Cumulative survival from the MTR to Portland was 24 percent, which is lower
than previously observed. Beeman and others (2015) found that survival of juvenile Chinook salmon
and steelhead ranged from 39 to 65 percent in this reach during 2013 and 2014. The discrepancy in
survival rates between tagged fish in our study and tagged fish from previous studies provides additional
evidence to support earlier observations that factors such as release timing or fish source may have
influenced observations in this study.
Collectively, the inclusion of PIT tags in study fish, and laboratory studies that addressed tag
failure and tag loss, allowed us to account for potential bias in survival estimates. Acoustic transmitters
have a finite operating life and we expected to observe downstream movements by acoustic+PIT-tagged
fish beyond the period in which acoustic transmitters operated during our study. Because tagging
occurred in early August 2014 we expected acoustic transmitters to expire by early November 2014.
Previous ODFW studies have shown that some juvenile Chinook salmon overwinter in the Willamette
River Basin and outmigrate the following spring or summer (T.A. Friesen and M.A. Johnson, ODFW,
written commun., February 2013). Given these data, we expected to detect acoustic+PIT-tagged fish on
PIT-tag antennas at Willamette Falls for several months after their acoustic transmitters stopped
functioning. Most fish migrated downstream shortly after release, but some passage occurred at
Willamette Falls through June 2015 (table 6). These data allowed us to account for protracted residence
times in the Willamette River Basin. Similarly, the tag-loss study allowed us to account for bias related
to that factor. Comparison of unadjusted and adjusted survival estimates showed that tag failure and tag
loss negatively biased survival estimates by about 5 percent.
28
Acknowledgments
This study was completed with the assistance of many people and organizations. The Oregon
Department of Fish and Wildlife and staff at the Marion Forks Hatchery provided space, facilities for
holding and tagging, and study fish. U.S. Army Corps of Engineers staff at Detroit and Big Cliff Dams
provided assistance with access at the sites to install, operate, and maintain equipment used to monitor
tagged fish near the dams. Staff from the Stayton Public Works Department provided access to the
Stayton Canal. Robert Wertheimer and Scott Fielding provided invaluable assistance with developing
the study plan, securing the funding, and assisting with several aspects of the study design,
implementation, analysis, and reporting process. Mary Karen Scullion and Chris Walker provided
updates on dam operating scenarios at Detroit Dam that were important for study planning. Our
administrative and scientific colleagues at the Columbia River Research Laboratory contributed greatly
to this study. In particular, we thank Lisa Gee, Kyle Martens, Russell Perry, John Plumb, Collin Smith,
Ryan Tomka, and Andrew Wells for their efforts. We thank Nick Ackerman and John Plumb for
reviewing this document and providing editorial comments that improved the quality of the document.
This study was funded by the U.S. Army Corps of Engineers under contract W66QKZ31580064.
References Cited
Allison, P.D., 1995, Survival analysis using SAS—A practical guide: Cary, North Carolina, SAS
Institute, Inc., 292 p.
Axel, G., Beeman, J., Brown, R., Eppard, B., Fielding, S., Hockersmith, E., Liedtke, T., Peery, C., and
Woodley, C., 2011, Surgical protocols for implanting JSATS transmitters into juvenile salmonids for
studies conducted for the U.S. Army Corps of Engineers: Surgical Protocols Steering Committee,
Prepared for the U.S. Army Corps of Engineers, Portland, Oregon.
Beeman, J.W., and Adams, N.S., eds., 2015, In-reservoir behavior, dam passage, and downstream
migration of juvenile Chinook salmon and juvenile steelhead from Detroit Reservoir and Dam to
Portland, Oregon, February 2013–February 2014: U.S. Geological Survey Open-File Report 2015–
1090, 92 p., accessed July 2015 , at http://dx.doi.org/10.3133/ofr20151090.
Beeman, J.W., Hansel, H.C., Hansen, A.C., Evans, S.D., Haner, P.V., Hatton, T.W., Kofoot, E.E.,
Sprando, J.M., and Smith, C.D., 2014, Behavior and dam passage of juvenile Chinook salmon and
juvenile steelhead at Detroit Reservoir and Dam, Oregon, March 2012–February 2013: U.S.
Geological Survey Open-File Report 2014-1144, 62 p., accessed June 2015 , at
http://dx.doi.org/10.3133/ofr20141144.
Beeman, J.W., and Perry, R.W., 2012, Bias from false-positive detections and their removal in studies
using telemetry, in Adams, N.S., Beeman, J.W., and Eiler, J.H., eds., Telemetry techniques–A user
guide for fisheries research: Bethesda, Maryland, American Fisheries Society, p. 505–518.
Burnham, K.P., Anderson, D.R., White, G.C., Brownie, C., and Pollock, K.H., 1987, Design and
analysis methods for fish survival experiments based on release-recapture: Bethesda, Maryland,
American Fisheries Society Monograph 5, 737 p.
Cormack, R.M., 1964, Estimates of survival from the sighting of marked animals: Biometrika, v. 51,
nos. 3–4, p. 429–438.
Jolly, G.M., 1965, Explicit estimates from capture-recapture data with both death and immigration-
stochastic model: Biometrika, v. 52, nos. 1–2, p. 225–247.
Karchesky, C.M., Pyper, B.J., Hanks, M.E., and Cramer, D.P., 2010, Final report: evaluation of spring
Chinook salmon downstream migration at the Willamette Falls Project, spring 2010. Prepared for
Portland General Electric, Portland, Oregon.
29
Kock, T.J., Liedtke, T.L., Ekstrom, B.K., and Hurst, W.R., 2015, Evaluation of two juvenile salmon
collection devices at Cowlitz Falls Dam, Washington, 2014: U.S. Geological Survey Open-File
Report 2015-1054, 30 p.
Lady, J.M., Westhagen, P., and Skalski, J.R., 2008, USER 4—User specified estimation routine: Seattle,
University of Washington, School of Aquatic and Fishery Sciences, accessed July 2015, at
www.cbr.washington.edu/analysis/apps/user.
McMichael, G.A., Eppard, M.B., Carlson, T.J., Carter, J.A., Ebberts, B.D., Brown, R.S., Weiland, M.,
Ploskey, G.R., Harnish, R.A., and Deng, Z.D., 2010, The juvenile salmon acoustic telemetry system–
A new tool: Fisheries, v. 35, no.1, p. 9–22.
National Oceanic and Atmospheric Administration, 2008, Endangered Species Act Section 7(a)(2)
Consultation Biological Opinion & Magnuson-Stevens Fishery Conservation & Management Act
Essential Fish Habitat Consultation: National Oceanic and Atmospheric Administration, Fisheries Log
Number FINWR12000/02117.
Normandeau Associates, Inc., 2010, Estimates of direct survival and injury of rainbow trout
(Oncorhynchus mykiss) passing spillway, turbine, and regulating outlet at Detroit Dam, Oregon:
Normandeau Associates, Inc., prepared for U.S. Army Corps of Engineers, Portland, Oregon, contract
W912EF-08-D-0005.
Perry, R.W., Plumb, J.M., Fielding, S.D., Adams, N.S., and Rondorf, D.W., 2014, Comparing effects of
transmitters within and among populations—Applications to swimming performance of juvenile
Chinook salmon: Transactions of the American Fisheries Society, v. 142, p. 901–911.
Perry, R.W., Castro-Santos, T., Holbrook, C.M., and Sandford, B.P., 2012, Using mark-recapture
models to estimate survival from telemetry data, in Adams, N.S., Beeman, J.W., and Eiler, J., eds.,
Telemetry techniques—A user guide for fisheries research: Bethesda, Maryland, American Fisheries
Society, p. 453–476.
Seber, G.A.F., 1965, A note on the multiple-recapture census: Biometrika, v. 52, nos. 1–2, p. 249–259.
Skalski, J.R., Lady, J., Townsend, R., Giorgi, A.E., Stevenson, J.R., Peven, C.M, and McDonald, R.D.,
2001, Estimating in-river survival of migrating salmonid smolts using radiotelemetry: Canadian
Journal of Fisheries and Aquatic Sciences, v. 58, p. 1987–1997.
Street, L.E., and Faber, D.M., 2015, Willamette project juvenile salmonid PIT interrogation system
development–North Santiam River near Bennett Dams: Oregon Department of Fish and Wildlife,
report prepared for the U.S. Army Corps of Engineers, Portland, Oregon, Project Number W9127N-
10-2-0008.
Tiffan, K.F., and Connor, W.P., 2003, Effects of summer flow augmentation on the migratory behavior
and survival of juvenile Snake River fall Chinook salmon: U.S. Geological Survey and the U.S. Fish
and Wildlife Service, prepared for the Bonneville Power Administration, Portland, Oregon, Project
Number 1991-02900.
Tiffan, K.F., and Connor, W.P., 2004, Effects of summer flow augmentation on the migratory behavior
and survival of juvenile Snake River fall Chinook salmon: U.S. Geological Survey and the U.S. Fish
and Wildlife Service, prepared for the Bonneville Power Administration, Portland, Oregon, Project
Number 1991-02900.
30
Titzler, P.S., McMichael, G.A., and Carter, J.A., 2010, Autonomous acoustic receiver deployment and
mooring techniques for use in large rivers and estuaries: North American Journal of Fisheries
Management, v. 30, p. 853–859.
Townsend, R.L., Skalski, J.R., Dillingham, P., and Steig, T.W., 2006, Correcting bias in survival
estimation resulting from tag failure in acoustic and radiotelemetry studies: Journal of Agricultural,
Biological, and Environmental Statistics, v. 11, p. 183–196.
Weiland, M.A., Ploskey, G.R., Hughes, J.S., Deng, Z., Fu, T., Monter, T.J., Johnson, G.E., Khan, F.,
Wilberding, M.C., Cushing, A.W., Zimmerman, S.A., Faber, D.M., Durham, R.E., Townsend, R.L.,
Skalski, J.R., Kim, J., Fischer, E.S., and Meyer, M.M., 2009, Acoustic telemetry evaluation of
juvenile salmonid passage and survival at John Day Dam with emphasis on the prototype surface flow
outlet, 2008: Richland, Washington, Pacific Northwest National Laboratory, Report PNNL-18890,
259 p.

Publishing support provided by the U.S. Geological Survey
Science Publishing Network, Tacoma Publishing Service Center
For more information concerning the research in this report, contact the
Director, Western Fisheries Research Center
U.S. Geological Survey
6505 NE 65th Street
Seattle, Washington 98115
http://wfrc.usgs.gov/

Kock and others—Behavior, Passage, and Downstream Migration of Chinook Salmon from Detroit Reservoir to Portland, Oregon, 2014–15—Open–File Report 2015–1220
ISSN 2331-1258 (online)
http://dx.doi.org/10.3133/ofr20151220
