
Projected Emission Factors for
New York State Grid Electricity
White Paper | Report Number 22-18 | August 2022
NYSERDA’s Promise to New Yorkers:
NYSERDA provides resources, expertise,
and objective information so New Yorkers can
make confident, informed energy decisions.
Our Vision:
New York is a global climate leader building a healthier future with thriving communities; homes and
businesses powered by clean energy; and economic opportunities accessible to all New Yorkers.
Our Mission:
Advance clean energy innovation and investments to combat climate change, improving the health,
resiliency, and prosperity of New Yorkers and delivering benefits equitably to all.
Projected Emission Factors
for New York State Grid Electricity
White Paper
Prepared by:
New York State Energy Research and Development Authority
Albany, NY
H
illel Hammer
Senior Advisor for Energy and Environmental Analysis
with technical support and analysis by:
Energy and Environmental Economics
New York, NY
C
hrista Heavey
Associate Director
Hadiza Felicien
Consultant
Kushal Patel
Partner
NYSERDA Report 22-18 August 2022

ii
Preferred Citation
New York State Energy Research and Development Authority (NYSERDA). 2022 “Projected
Emission Factors for New York State Grid Electricity,” NYSERDA Report Number 22-18.
Albany, NY. nyserda.ny.gov/publications
Abstract
This white paper presents a method for producing average and marginal greenhouse gas emission
factors associated with generating electricity in New York, projected for 2025 through 2030, and
a method for extrapolating factors for 2022—2024 and 2031—2040 and beyond. NYSERDA is
also publishing in the annexed spreadsheet
a database of these factors developed fol
lowing this
method. The whitepaper includes a description of the variety of the emission factors produced
and recommendations for the applicability of the factor type by use-case and objective, as well
as a recommendation on how to apply the factors when calculating the value of greenhouse gas
emissions using the New York State Value of Greenhouse Gases factors and the damage-based
approach for evaluating the value of greenhouse gas emissions.
Keywords
New York electricity, greenhouse gas emission factors, marginal emission factors, valuing greenhouse
gas emissions
Acknowledgments
NYSERDA would like to thank the New York Department of Public Service staff for their review
and recommendations during the development of this report.
Table of Contents
Preferred Citation ..................................................................................................................... ii
Abstract .................................................................................................................................... ii
Keywords .................................................................................................................................. ii
Acknowledgments ................................................................................................................... ii

iii
List of Tables ............................................................................................................................iv
Acronyms and Abbreviations .................................................................................................iv
Summary ............................................................................................................................... S-1
1 Introduction ....................................................................................................................... 1
2 Scope and Approach ........................................................................................................ 3
2.1 Greenhouse Gases ....................................................................................................................... 3
2.2 Temporal Perspective ................................................................................................................... 4
2.2.1 Past, Present, and Future Emission Factors ........................................................................ 4
2.2.2 Temporal Resolution ............................................................................................................. 4
2.3 System-Average and Marginal Emission Factors ......................................................................... 5
2.3.1 System-Average Emission Factors ....................................................................................... 5
2.3.2 Marginal Emission Factors .................................................................................................... 6
2.3.2.1 Short-run Marginal Emission Factors .................................................................................... 6
2.3.2.2 Long-run Marginal Emission Factors .................................................................................... 7
2.4 Geographic Boundaries and Resolution ....................................................................................... 7
3 Origin and Use of Marginal Emission Factor Currently Applied in New York State ..... 9
4 Analysis Method and Recommended Application .........................................................11
4.1 Methodology ................................................................................................................................ 11
4.1.1 Electricity Production Simulation Modeling ......................................................................... 11
4.1.2 Marginal Emission Factors .................................................................................................. 12
4.1.2.1 Short-Run Marginal Emission Factors ................................................................................ 12
4.1.2.2 Long-Run Marginal Emission Factors ................................................................................. 15
4.1.3 Average Emission Factors .................................................................................................. 16
4.1.4 Fuel Cycle Factors by GHG ................................................................................................ 16
4.2 Results ........................................................................................................................................ 16
5 Applying Emission Factors .............................................................................................18
5.1 Selecting the Applicable Emission Factor Type by Use Case .................................................... 18
5.2 Societal Value ............................................................................................................................. 19
6 References .......................................................................................................................21
Appendix A. Previous Studies and Analyses ...................................................................... A-1
Appendix B. Production Model Simulation Scenario Selection and Interpolation ........... B-1
Endnotes .......................................................................................................................... EN-11
Data Annex (link to spreadsheet)

iv
List of Tables
Table 1. Emission Factor Results from DPS’ Modeling of the CARIS Base Case in MAPS ...... 10
Table 2. Short-Run Marginal Emission Factors, CO
2
, Statewide, 2030 (metric tons/MWh) ......... 17
Table 3. Recommended Use Cases for Each Emission Factor Type .............................................. 19
Acronyms and Abbreviations
BCA benefit-cost analysis
Btu British thermal units
CES Clean Energy Standard
CO
2
carbon dioxide
CH
4
methane
DPS New York State Department of Public Service
GHG greenhouse gas
kWh kilowatt-hours
lbs pounds
MWh megawatt-hours
MW megawatts
N
2
O nitrous oxide
NYISO New York Independent System Operator
NYS New York State
NYSERDA New York State Energy Research and Development Authority
PJM the Pennsylvania-New Jersey-Maryland interconnection
REC renewable energy credit

S-1
Summary
With the passage of the Climate Leadership and Community Protection Act (Climate Act)
1
, New York
State (NYS) established economy-wide greenhouse gas (GHG) emission reduction limits
2
and codified
a transition to a zero-emission electricity grid by 2040. To track progress towards these limits and send
the right market and regulatory signals, it is important to understand and report on the transition in GHG
emissions intensity of the electricity grid. Grid emissions intensity is measured by GHG emission factors,
which represent the amount of GHGs produced per unit of electricity generated. The primary objective
of this white paper is to recommend an approach to calculating emission factors associated with
electricity generation that is consistent with the Climate Act and applicable to a broader range
of current applications.
Currently, a state-wide, static marginal emissions factor of 0.55 short tons carbon dioxide (CO
2
)
per megawatt-hour of electricity generated
3
is used in many New York State Energy Research and
Development Authority (NYSERDA) studies and in the context of New York State Department of
Public Service (DPS) jurisdictional projects, programs, and policies, including benefit-cost analyses
that rely on marginal costs and benefits.
4, 5
With the implementation of the Climate Act, a new paradigm
is needed for considering emission factors. In response, NYSERDA has developed an updated analysis
that considers emission factors for methane (CH
4
) and nitrous oxide (N
2
O) in addition to CO
2
, and
upstream emissions associated with the extraction, production, and delivery of fossil fuels used for
electricity generation.
6
An example of how emissions are treated can be found in New York’s statutorily
required emissions inventory report.
7
In addition, this analysis includes average and marginal emission
factors for current and projected generation including monthly and diurnal temporal perspectives and
an exploration of the variation in emissions in different areas of the State.
Marginal emission factors represent the emissions associated with changes in generation resulting
from changes in load (increase or decrease). Marginal emission factors may be further broken
down to short-run marginal, representing instantaneous changes, or long-run marginal, to adjust
for required supply-side rebalancing to meet renewable power requirements under New York State’s
Clean Energy Standard.
8
S-2
Average emission factors can be used to describe the overall generation mix. Average emission
factors are appropriate for analyses where changes at the margin are less relevant, such as GHG
footprint assessments.
This paper presents the methods and data produced after considering different ways of calculating each
emission factor type, as well as relevant data sources, and recommends approaches appropriate for New
York State consistent with the Climate Act. These were developed in the context of the various potential
applications for emission factors.
In developing this white paper, we were guided by the following principles:
• The method(s) selected should be robust, with demonstrated reasonableness and acceptabilit
y
i
n other use cases.
• The method(s) should be flexible, to allow for different use cases, data availability, a
nd
other variations over time.
• The method(s) should balance complexity with overall usefulness, noting that increased complexity
a
nd precision may not necessarily be more accurate or provide additional benefits, and will likely
reduce flexibility and robustness
.
• T
he method(s) should consider the value of higher resolution outputs (temporal and locational)
,
al
ongside the increased complexity of calculating these resolutions.
• The method(s) should be consistent with and/or improve upon existing NYSERDA and/or DPS
work and leverage existing NYSERDA and/or DPS modeling to the extent possible
.
T
he selected method applied production simulation modeling prepared for the New York Power Grid
Study and updated to reflect the selected Tier 4 projects.
9, 10
Average factors were produced based on
the fraction of thermal generation. Marginal factors were produced using the Implied Marginal Heat Rate
method (described in Section 4) applied to projected hourly prices. The New York Independent System
Operator (NYISO) applied an Implied Marginal Heat Rate Method as part of its Integrating Public Policy
Task Force Carbon Pricing Proposal.
11, 12
Upstream emission factors for fossil fuels, reflecting the analysis of upstream emissions provided by
New York State Department of Environmental Conservation (DEC) for current emissions in the New
York State GHG Inventory
13
, were used to calculate fuel cycle emission factors (combustion plus
upstream) for CO
2
, CH
4
, and N
2
O.

S-3
This paper and accompanying workbook annexed to this paper provide the following:
• Average and marginal projected emission factors for CO
2
, CH
4
, and N
2
O.
• Marginal short- and long-run emission factors as month-hour values and aggregated annual averages
.
• A
nnual average emission factors.
We recommend the following:
• Fuel cycle emission factors, including combustion plus upstream emissions, should be
used as the primary emission factors in most analyses, consistent with the Climate Act.
• For average emission factors, annual values are sufficient. For marginal factors, we recommend
using month-hour values where appropriate corresponding data is available, and especially i
n
case
s where diurnal or annual changes are crucial (e.g., energy storage).
• We recommend that regional emission factors for upstate (New York State Independent
System Operator’s zones A-E) and downstate (NYISO zones F-K) be used wherever possible.
• To estimate grid transmission and distribution loss when applying factors to end uses, apply a loss
factor of 7.12% from generation to use (end-use consumption should be multiplied by 1.077 t
o
est
imate generation before multiplying by grid emission factors which are generation based).
14
• In the absence of marginal abatement cost information, the recommended New York State (NYS)
Value of GHG
15
for each GHG by year should be applied to the fuel cycle emission factors for CO
2
,
CH
4
, and N
2
O to calculate intensity value factors (in dollars per megawatt-hour) which can be applied
to load changes in order to estimate the societal value of changes in electricity-related emissions. The
intensity value factors for each GHG can be summed to calculate the total intensity value factors per
megawatt-hour.

1
1 Introduction
With the passage of the Climate Leadership and Community Protection Act (Climate Act),
16
New York
State established economy-wide greenhouse gas (GHG) emission reduction limits
17
and codified
a transition to a zero-emission electricity grid by 2040. To track progress towards these limits and
send the right market and regulatory signals, it is important to understand and report on the transition
in greenhouse gas (GHG) emission intensity of the electricity grid. Grid GHG emissions intensity
is measured by GHG emission factors, which represent the amount of GHGs produced per unit of
electricity generated.
To evaluate the impact of programs or policies on GHG emissions, New York must be able to
quantify GHG emission rates from its electricity mix, accounting for varying generation and other
factors. A key metric to understanding GHG emissions are emission factors. A GHG emission factor
for grid-supplied electricity represents the amount of GHGs produced per unit of electricity generated.
In other words, an emission factor considers the rate at which GHG emissions are produced from
electricity generation in units of mass per energy, such as metric tons per megawatt-hour (MWh)
generated. While the total amount of GHGs emitted during a given time period (e.g., one year) is
also an essential metric regarding the climate impact of electricity generation, emission factors
present an alternative view on the rate at which GHGs are emitted. Emission factors allow utilities,
regulators, policy makers, and other stakeholders to understand how a change in electric loads will
affect the amount of GHGs emitted. Emission factors can be used to evaluate how a change to the electric
load, such as an energy efficiency program, building electrification, electric vehicle charging, or customer
adoption of distributed energy resources, will affect emissions produced from electricity generation on a
per unit basis. In addition, in the absence of marginal abatement cost information, NYS Value of GHG
18
for each GHG ($/metric ton of each GHG) can be applied to the grid emission factors (metric ton of each
GHG/MWh) to calculate a resulting intensity of the value of grid emissions ($/MWh). This intensity can
be used to evaluate the societal costs and benefits of changing electric load.
Note that the methods presented here and the data provided do not supersede or replace any existing
legal requirement or regulation.
This white paper and the accompanying annexed spreadsheet present updated emission factors
representing NYSERDA best understanding of current and future projected GHG emissions
from electricity delivered in New York, and proposes approaches to apply the factors for benefits
2
reporting, benefit-cost analyses, and other uses. The analysis was prepared by Energy and
Environmental Economics, Inc. (E3) on behalf of and in collaboration with NYSERDA.
Note that the method for valuing GHG emissions described herein relies on marginal GHG emission
factors to evaluate how actions affect changes in emissions and to then evaluate the impact of those
emissions in the form of the cost of future climate change damage. Another approach to valuing GHG
emissions relies on the marginal abatement cost (MAC). The MAC, or target-consistent approach, to
valuing GHG reductions is based on the cost of reducing emissions to meet a specified policy goal or
target (such as a carbon reduction target or sectoral clean energy target)
19
. The MAC approach uses a
supply curve to show the costs of different strategies or program measures to mitigate GHG emissions,
ranked from lowest to highest, and the corresponding emissions reductions resulting from each tactic.
The value of GHG reductions in the MAC approach is selected as the marginal cost to reduce the last
unit of GHGs to meet a particular emissions target.
The MAC approach addresses concerns with the damage-based approach: by representing the cost
to reduce emissions rather than the cost of future climate change damage, the MAC eliminates the
uncertainty surrounding the impact and valuation of the future damage from GHGs. Additionally,
the MAC is not reliant on the selection of a discount rate as used to evaluate the social cost, which
also reduces uncertainty in the MAC. The MAC does require detailed supply curve data, which may
not be readily available for all sectors and technologies and can be primarily applied only where
policy goals or targets have been determined.
In its guidance document for the valuing of GHG emissions
20
, the New York State Department of
Environmental Conservation (DEC) notes that social cost, compared to the MAC, can be used in many
contexts for any amount of emissions reductions and is already being used by the federal government
in similar applications. Additionally, DEC noted that the sector-specific nature of the MAC makes it
challenging to consistently apply a value to emission reduction measures across sectors. However, as
described in the guidance document, DEC notes that alternative approaches may be more appropriate in
certain decision-making contexts for both resource valuation and benefit-cost analyses, with the electric
power sector cited as an example. Therefore, we note that there may be cases where the abatement curve
data are available and the objective is to compare the cost of alternatives. In such cases, it may be
preferable to use a MAC approach for decision making.

3
2 Scope and Approach
In developing these emission factors, NYSERDA applied the following guiding principles:
• The method(s) selected should be robust, with demonstrated reasonableness and acceptabilit
y
i
n other use cases.
• The method(s) should be flexible, to allow for different use cases, data availability, and other
variations over time.
• The method(s) should balance complexity with overall usefulness, noting that increased complexit
y
a
nd precision may not necessarily be more accurate or provide additional benefits, and will likel
y
r
educe flexibility and robustness
.
• The method(s) should consider the value of higher resolution outputs (temporal and
locational), alongside the increased complexity of calculating these resolutions.
• The method(s) should be consistent with and/or improve upon other New York State
work and leverage existing New York State modeling to the extent possible.
The next subsections outline the boundaries, scope, and other details of the selected approach,
using these guiding principles as basis for our recommendations.
2.1 Greenhouse Gases
This white paper addresses the three GHGs associated with electricity generation: carbon dioxide (CO
2
),
methane (CH
4
), and nitrous oxide (N
2
O). CO
2
is the GHG emitted in the largest quantities directly from
fossil fuel combustion
21
. CH
4
and N
2
O are also emitted from electricity production in smaller quantities.
The emission factor currently in use by NYSERDA—as described in Section 3—represents CO
2
only.
The factors developed for this paper include CO
2
, CH
4
, and N
2
O (including upstream emissions of
those GHGs, as described in Section 2.4) consistent with the Climate Act.
While some other GHGs may result from other aspects of power generation and delivery, their emissions
are not directly correlated with changes in electricity consumption. Note that for any assessment of
GHG emissions, all relevant GHGs should be included, and when evaluating measures which would
affect other sources beyond those correlated with demand as explored here, such as gas leakage or
transmission system emissions, all relevant GHGs should be included. Those topics are beyond
the scope of this white paper.
4
2.2 Temporal Perspective
Emission factors can be used to quantify the GHG emissions associated with electricity generation
on any time horizon: in the past, present, or in the future, and at a wide range of time scales (from
sub-hourly to annual).
2.2.1 Past, Present, and Future Emission Factors
While emission factors representing actual grid conditions that existed in past years or current grid
conditions (e.g., real-time) can be calculated from actual data and may have their applications, they
are not the focus of this white paper. The temporal scope of this white paper is projected emission
factors. Projected emission factors may be used to consider the projected impacts of policies or programs.
Because these are derived from electricity generation that has not yet occurred, and may extend many
years into the future, projected emission factors inherently require modeling and assumptions regarding
the future grid. While some actual data could be used, such as individual emission rates for current
generators in New York, the majority of the calculations are based on forecasts or projections for
how the grid will look at a given point in the future and how those rates would evolve.
Production cost modeling, which uses projected generation portfolios to simulate grid operation,
dispatch, and electricity prices in the future is a key component of the calculation of projected
emission factors. Production cost models will be described in more detail in Section 4.1.1.
2.2.2 Temporal Resolution
The scope of this white paper includes grid factors at an annual temporal resolution, as well as grid
factors representing a combination of the time of day and month. (Annual average marginal emission
factors in this report are calculated as generation-weighted averages of the hourly marginal emission
factors for the year.) Marginal grid resources can change on an hourly basis and an annual marginal
emissions factor would not reflect the variations in marginal units throughout a day or the year. Thus,
marginal emission factors require a higher resolution than annual in order to show temporal variation
and better understand marginal impacts for uses with patterns of variable load and especially when
targeting variable load such as storage or time-of-use programs. Generally, we recommend using more
detailed factors where practicable and especially in cases where variation is expected to be significant.
5
The month-hourly factors considered here are representative of the diurnal change throughout the year,
averaging factors for given hours in each month. While projecting hourly factors for each hour of the
year is possible, given the limitations of modeled projections, these would likely present false precision
(especially for far-future projections) and are not recommended for most applications. A seasonal, rather
than monthly perspective was also considered; however, applying seasonal data for an analysis would
normally require greater detail such as monthly load, and therefore simplifying the analysis to seasonal
resolution was not deemed to provide any further benefit beyond the month-hour approach. We believe
the month-hour average marginal approach strikes an appropriate balance of the above considerations
in cases where temporal variation is important, and annual average marginal values can be used in
other cases.
Longer averaging is possible (e.g., 3-year average), and could be useful for past data (e.g., normalizing
past data for weather or other factors), but is not expected to be beneficial for projected emission factors.
Shorter resolution such as sub-hourly can also have its uses but is not needed for most applications
and would require specialized analysis to produce and very detailed data on uses to apply.
2.3 System-Average and Marginal Emission Factors
Two main emission factor types were developed for this white paper: average and marginal.
2.3.1 System-Average Emission Factors
A system-average emission factor describes the amount of GHG emitted, on average, per unit of
electricity for a given time period throughout the generation system. The system-average factor for
a given period would represent the total GHG emissions divided by the total electricity generated.
System-average emission factors are best for considering emissions associated with the overall
generation composition, rather than characterizing the effect of changes in load or generation
(see discussion of marginal emission factors below). Although they do not represent the dynamic
nature of the grid, average emission factors are significantly easier to understand, calculate, and
aggregate than their marginal counterpart.
6
2.3.2 Marginal Emission Factors
Marginal emission factors measure the change in GHG output of the grid associated with variations in
generation mix and load. Marginal emission factors reflect the fact that a change in load does not impact
all generators equally. Specifically, a decrease or increase in generation due to a change in demand will
affect a single or limited number of generators—the “marginal resource(s)”. A marginal resource is the
final dispatched resource to meet the demand at a given time, and it sets the real-time
energy price. Resources with lower short-run marginal costs that are already scheduled to run in that
hour are not impacted by a change in load and continue to run as expected. Therefore, marginal emission
factors are typically used to consider changes in load, since these changes will impact generators on the
margin. Generators on the margin typically have higher emission factors than the average resource mix
and tend to have higher short run marginal costs than the other generating resources.
For example, suppose the marginal resource in a given hour is a gas plant with a CO
2
emission factor
of 0.4 metric tons/MWh. If additional load is added to the grid in that hour, and this gas plant can service
this load, then the marginal emissions factor in that hour is still 0.4 metric tons/MWh. However, if the
additional load requires another plant to come online, then the marginal emission factor would be based
on the CO
2
emission rate of that other plant. Consistent with the methodology described in this white
paper, the same dynamic would apply to the other GHGs.
To accurately estimate the impacts of a policy or program that would affect hourly load, marginal
emission factors should be used. However, it is important to note that marginal emissions factors
also have significant limitations, especially at larger scale. Marginal emissions factors are best used for
smaller changes in load or generation with relatively small impact on grid operations. However, many
of the programs that the emission factor may be used for (e.g., a benefit-cost analysis of the New
Efficiency: New York targets), would have a significant impact on grid operations that would stretch
beyond the accuracy of a marginal emissions factor. Therefore, when considering marginal emission
factors, there are two types: short-run and long-run.
2.3.2.1 Short-run Marginal Emission Factors
Short-run marginal emission factors represent what is happening on the grid at a given point in time.

7
2.3.2.2 Long-run Marginal Emission Factors
Long-run marginal emission factors are used to describe long-term impacts, accounting for structural
changes to the generation portfolio in response to long-range changes to load. Suppose a policy requires
that a certain fraction of electricity be generated from renewable energy sources over the course of a year
(such as New York’s Clean Energy Standard, or CES
22
). If there is a sustained increase in load during a
given hour, and therefore an increase in emissions, the long-term factor would consider any rebalancing
in electricity supply that must occur to comply with the policy. Therefore, long-run marginal emission
factors can be used to reflect any adjustments to supply that would happen beyond the short-term change
in emissions (reflected in the short-run marginal emission factor), but nonetheless still associated with
that change in load. This effect is illustrated in Figure 1.
Figure 1. Illustrative Example of Long-Run Marginal Emission Factors
2.4 Geographic Boundaries and Resolution
The focus of this white paper is electricity used in New York State, which includes power imported from
outside New York. In terms of the geographic resolution for applying factors to changes in load, there are
differences in power supply by region (e.g., by New York Independent System Operator’s (NYISO) zone)
that need to be considered, but there are also data limitations that constrain the ability to provide high
geographic resolution for projected factors with reasonable certainty and avoiding false precision. Given
data and modeling limitations for projected factors, we recommend using factors for upstate (NYISO
zones A-E) and downstate (NYISO zones F-K) regions as the appropriate balance of analysis limitations
and the need for geographic specificity.
8
Because the selected method is based on the price of wholesale electricity (see Section 4.1.2), the method
is agnostic to the actual source of generation, whether it is in- or out-of-state. The method then implicitly
incorporates imported power and reflects the efficiency and ensuing emissions associated with generating
imported power, similar to power generated within New York State.
In addition, since the Climate Act requires the inclusion of upstream emissions associated with the
use of fossil fuels, the use of an upstream factor for each fuel and GHG is considered here. Upstream
emissions include the emissions associated with extracting, producing, and delivering the fossil fuels
used to generate electricity. An example of how emissions are treated can be found in DEC’s statutorily
required emissions inventory report.
23
DEC has published upstream emissions rates for CO
2
, CH
4
, and
N
2
O associated with fossil fuels as part of New York’s GHG inventory.
24
These emission rates can be
used to provide the complete impact on emissions (fuel cycle emission factors, including combustion
and upstream emissions). While both combustion-only and fuel cycle emission factors were calculated,
fuel cycle emission factors should be used for most analysis.
While all upstream emissions associated with fossil fuels are included, as described in more detail below,
in-state emissions of natural gas from system leakage are not included in the emission factors provided
here as they are not directly correlated with marginal changes in load and are instead correlated with the
size and composition of the associated fuel delivery system which does not necessarily alter in response
to load changes. This means, for example, that a fixed amount of energy use can show declining amounts
of in-state leakage emissions as leak-prone pipe is gradually addressed. On the other hand, a conservation
deployment would show lower energy use but not lower emissions from in-state leakage if there were
otherwise no changes in pipeline type and miles or other associated system components from which
leakage occurs. As noted above, when evaluating measures which would affect other sources, such as gas
leakage or transmission system emissions, in addition to this analysis of electricity generation emissions,
all other relevant GHGs should be included. Those topics are beyond the scope of this white paper.

9
3 Origin and Use of Marginal Emission
Factor Currently Applied in New York State
NYSERDA and the New York State Department of Public Service (DPS) currently use a state-wide
short-run marginal emissions factor of 0.55 short tons CO
2
per MWh of electricity generated. This
marginal emissions factor was calculated by DPS in 2017
25
using scenario modeling in General
Electric’s Multi-Area Production Simulation (MAPS) model.
26
DPS leveraged the NYISO base
case scenario developed through Phase 2 of the Congestion Assessment and Resource Integration
Study (CARIS) from 2016. The CARIS2 base case simulated future energy production for New York
and neighboring regions the Pennsylvania-New Jersey-Maryland interconnection (PJM), New England,
and Ontario, and did not assume additional emission reductions later required by the Climate Act. DPS
analyzed two sensitivities to the CARIS2 base case in MAPS: one with a 1% decrease in New York
State load, and one with a 1% increase in state load. The marginal emission factor was calculated as
the change in CO
2
emissions divided by the 1% change in load, for the whole region and for New York
State individually. The analysis was run annually from 2017 through 2034, and then the resultant annual
marginal emission factors were averaged for all years. The results, which were reviewed by the Metrics,
Tracking and Performance Assessment Working Group in July 2017, are shown in Table 1. The working
group recommended that DPS and NYSERDA use the 1% energy decrease case for New York, PJM,
New England, and Ontario, which resulted in a marginal emissions factor of 0.55 short tons CO
2
per
MWh.
(Note that within the 2-significant figure precision presented, the result for increased and
decreased load in the region were the same: 0.55 short tons CO
2
/MWh.)
The marginal emission factor for New York of 0.55 short tons (equivalent to 0.50 metric tons) of CO
2
per MWh is applied statewide and is used as a static annual number, constant for all years (based on
the average of 2017–2034, not applied as a separate projected factors for future years). This marginal
emission factor only includes CO
2
emissions. Furthermore, this marginal emission factor does not
include any emissions upstream of the combustion.
Even though the value was calculated based on analysis for 2017—2034, this marginal emission factor
is applied for analysis of past and ongoing impacts. Since the analysis was prepared in 2017 based on
the 2016 CARIS base case, the marginal emission factor produced does not include currently ongoing
and expected future changes to New York’s energy portfolio, such as the requirement for 70% renewable

10
electricity by 2030, GHG emission limits, and other energy requirements and goals of the Climate Act.
27
The 2016 CARIS base case also did not include the previous goal of 50% renewable electricity by 2030.
NYISO created a separate Public Policy scenario to model the Clean Energy Standard, but this was not
reflected in the base case.
Table 1. Emission Factor Results from DPS’ Modeling of the CARIS Base Case in MAPS
Source: New York Department of Public Service, “Final Performance Metrics Report – Phase 1.”
Short Tons of CO
2
per MWh of Load Change - Decremental, Incremental, and Average
2017
2018
2019
2020
2021
2022
2023
2024
2025
2026
2027
2028
2029
2030
2031
2032
2033
2034
Avg.
NY Load/Energy Down 1%
NY, PJM, New
England, Ontario
0.47 0.57 0.54 0.56 0.50 0.56 0.40 0.22 0.66 0.52 0.74 0.49 0.82 0.65 0.57 0.53 0.62 0.51
0.55
New York 0.32 0.36 0.29 0.33 0.27 0.25 0.29 0.41 0.33 0.29 0.45 0.28 0.29 0.32 0.28 0.34 0.29 0.27
0.31
NY Load/Energy Up 1%
NY, PJM, New
England, Ontario
0.32 0.28 0.35 0.56 0.55 0.54 0.65 0.66 0.46 0.82 0.69 0.83 0.50 0.43 0.74 0.62 0.42 0.57
0.55
New York
0.30 0.26 0.33 0.28 0.24 0.32 0.34 0.31 0.33 0.30 0.35 0.42 0.31 0.31 0.38 0.35 0.32 0.29
0.32
Average
NY, PJM, New
England, Ontario
0.40 0.42 0.44 0.56 0.53 0.55 0.53 0.44 0.56 0.67 0.71 0.66 0.66 0.54 0.65 0.57 0.52 0.54
0.55
New York 0.31 0.31 0.31 0.31 0.25 0.29 0.31 0.36 0.33 0.30 0.40 0.35 0.30 0.31 0.33 0.34 0.31 0.28
0.32
New Efficiency:
New York uses this emission factor value for all calculations. Each utility evaluates
its efficiency programs under the Benefit-Cost Analysis (BCA) framework.
28, 29
The BCA has an
input for the emission factor at the plug load, which currently leverages the single statewide number
that is constant over time. New Efficiency: New York BCAs use the emission factor value for future
years to estimate potential benefits that will be generated by efficiency measures.

11
4 Analysis Method and Recommended Application
4.1 Methodology
This section describes the method applied by NYSERDA to produce the emission factors in this white
paper and attached database.
4.1.1 Electricity Production Simulation Modeling
Projected emission factors require modeling or forecasting of future grid operations. The production
simulation modeling described here formed the basis for all the projected emission factors presented.
Some production simulation models also produce emission factor outputs. However, in our experience,
these are typically not very reliable (they are only as accurate and precise as the data on generators)
and often still require significant post-processing to be useable.
As such, E3 and NYSERDA processed price forecasts for electricity generation from production
simulation modeling using the Implied Marginal Heat Rate method, described below, to estimate
marginal emission factors. Generation data from the same models was used to produce average
emission factors, as described below.
Price forecasts and generation data were taken from production simulation outputs produced by the
PROMOD model analyses prepared by Siemens for NYSERDA. These analyses were undertaken for
the New York Power Grid Study
30
and updated to analyze scenarios including the Champlain Hudson
Power Express (CHPE) and Clean Path New York (CPNY) renewable power transmission projects
recently approved as Tier 4 resources.
31
Electricity price outputs were provided from the Power Grid
Study for 2025 and 2030 in different scenarios and interpolated to produce a consistent set of emission
factors for each year from 2025 to 2030 (see Appendix B for a more detailed description of the PROMOD
scenarios and interpolation). Beyond 2030, emission factors can be estimated by linear interpolation to
zero, since achieving the 2040 clean electricity mandate would result in zero GHG emissions associated
with electricity by 2040.

12
4.1.2 Marginal Emission Factors
This section describes the process for producing direct (combustion) CO
2
marginal emission factors.
The hourly short-run and long-run marginal emission factors were aggregated up to month-hour factors
for upstate (NYISO zones A-E), downstate (NYISO zones F-K), and statewide for each year from 2025
through 2030.
These factors were further processed as described in Section 4.1.4 to produce fuel cycle emission
factors for all three GHGs, and in Section 4.1.5 to produce the combined value of GHG intensity
per megawatt-hour.
4.1.2.1 Short-Run Marginal Emission Factors
The Implied Marginal Heat Rate method, described below, was applied to the hourly electricity prices
for 2025 and 2030 by NYISO zone to calculate hourly short-run marginal emission factors for CO
2
based
on fuel combustion for electricity generation. This method uses energy prices to estimate the marginal
unit type, and thereby draw conclusions on the associated emissions. The method is based on the fact that
the marginal unit sets the electricity price in the market. Using fuel cost data, an “implied” heat rate can
be calculated for the marginal unit.
32
Since heat rates show the relative efficiency of thermal generators,
we can estimate the relative emissions rate of the marginal unit based on the GHG content of the fuel.
NYISO has applied an Implied Marginal Heat Rate method as part of its Integrating Public Policy Task
Force Carbon Pricing Proposal.
33, 34
The electricity price in a given hour is correlated to the short-run marginal cost of the marginal generator.
Effectively, the cost of fuel per unit of electricity plus the compliance cost per unit is equal to the price of
electricity excluding the variable operation and maintenance costs. Assuming that natural gas is the fossil
fuel type typically on the margin in New York State, we use the natural gas fuel price, the variable
operations and maintenance cost of a typical natural gas plant, the CO
2
emissions rate from natural gas
combustion, and any emissions compliance costs to extrapolate an implied heat rate for this marginal unit:
=
=
$
&
$
$
+
$

13
We then calculate a marginal emissions factor in that hour using the emissions intensity of natural
gas combustion:
=
=
This analysis used electricity price forecasts for 2025 and 2030 based on PROMOD production
simulation (described above in Section 4.1.1) and an assumed variable operations and maintenance cost
of $5.65/MWh in 2025 and $6.24/MWh in 2030 for a natural gas plant. Monthly natural gas fuel prices
in 2025 and 2030 for each NYISO zone were also leveraged from the PROMOD model inputs. The
Regional Greenhouse Gas Initiative (RGGI) compliance price was estimated to be $10.45 per short ton
of CO
2
in 2025 and $16.20 per short ton in 2030 (All dollar values shown as nominal.) The CO
2
emission
rate for natural gas combustion was 116.6 pounds (lbs) CO
2
per million Btu, from New York State’s
GHG Inventory,
35
as described in Section 4.1.4. The implied heat rate calculation may result in very
high values in some hours (i.e., when prices are very high), which would occur in instances of high
demand and could be exacerbated from low supply such as outages or bidding behavior. In this analysis,
the implied marginal heat rate is capped at 12,000 Btu/kWh in order to represent the possible upper
bound of a natural gas peaker plant, and corresponding emission factors are calculated based on this
cap. A heat rate of 12,000 Btu/kWh corresponds to a price of approximately $52/MWh in 2025 and
approximately $70/MWh in 2030 (nominal), depending on NYISO zone and associated natural gas
fuel price. The frequency of intervals resulting in implied heat rates that would have been above this
cap were very low in this analysis. (In 2025, 587 hours out of a total of 96,360 total hourly intervals
[11 NYISO zones with 8,760 hours per year each] had prices resulting in capped implied heat rates at
12,000 Btu/kWh. In 2030, only 16 hours across the 11 NYISO zones were capped.) In addition, implied
heat rates above 12,000 Btu/kWh are likely associated with units that are dispatched for reliability,
and are therefore not marginal units.
For a lower bound, the implied marginal heat rate is constrained at 0 Btu/kWh (corresponding to zero
emissions), if hourly prices are negative. A very low implied heat rate, below the reasonable limits of
the most efficient natural gas plant (approximately 6,000 Btu/kWh), indicates that a natural gas plant
is not the sole marginal generator—either renewable generation, hydro, storage, imports, or a mix of
renewable and fossil generation, is likely on the margin. In this analysis, we assume the low implied
heat rate indicates there is a mix of fossil and renewable generation on the margin (for example, due
14
to transmission constraints resulting in multiple marginal generators) and therefore use the resulting
implied heat rate, within the lower bound of 0 Btu/kWh, to calculate the corresponding emissions factor
for that mix. While the implied heat rate may be lower than that of a natural gas plant, the emission rate
of natural gas is still used for the grid emission factor calculation because the low heat rate will reflect the
potential mix of fossil, renewable, hydro, and/or storage generation on the margin, and thus result in an
emission factor reflecting this mix. This approach of using a lower bound of 0 Btu/kWh is consistent
with that used in the California Public Utilities Commission’s Avoided Cost Calculator (see Appendix A
Section 2.1).
The key benefit of the Implied Marginal Heat Rate method is its flexibility: it allows the user to make
educated assumptions about the electricity mix and potential marginal fuel types to draw conclusions
about what is on the margin, and thus calculate the marginal emissions factor based on the emissions
intensity of that generator type.
This analysis assumes that natural gas is the marginal fossil fuel type for New York State. In 2021,
natural gas generators were the marginal units in most intervals for New York, with oil on the margin
only 4% of the time.
36
Coal, previously also the marginal fuel type for a small number of hours, has now
been phased out in New York State. While oil may be on the margin in New York during a small number
of hours today, the PROMOD scenarios used for this analysis show natural gas as the primary fossil fuel
generation in New York in 2025 and 2030.
Imported power may also be responsible for some marginal generation. The majority of imported power
in NYISO comes from Quebec, Ontario, and PJM.
37
Quebec’s electricity mix is 94% from hydro, and
Ontario’s mix is primarily from nuclear and hydro, with natural gas and oil expected to be responsible
for only 12.2% total in 2022-2023.
38,39
In PJM, natural gas units were on the margin 71% of the time in
2021, with coal on the margin 14% and oil on the margin 1% of the time.
40
Therefore, we assume that
natural gas will continue to be the marginal thermal generator in the majority of hours where fossil fuels
are on the margin, both in New York and in imported power. Hours that have other fossil fuel generation
on the margin (e.g., oil or coal) are expected to be an increasingly small fraction of hours, so the implied
marginal heat rate method assumption still holds. These exception hours will have only negligible impacts
on the analysis since the number of hours is small in a given year and will be averaged across hours,
months, and NYISO zones to create the final set of emission factors.

15
This method circumvents potential complications associated with hydro, storage, and imports since the
marginal unit is not explicitly identified. Rather, the electricity prices are used to extrapolate a possible
heat rate and inform what type of generation is on the margin, and then calculate the corresponding
emission factor. While the method is flexible and easy to implement, it may overestimate the emissions
impacts when pumped hydro and other storage resources are on the margin: because storage resources
tend to charge when prices are low (and emissions are also likely low), and discharge when prices are
high, the Implied Marginal Heat Rate method assigns a heat rate and corresponding emission factor
that are also high. However, we anticipate that the impact of this is minimal since the hours that these
resources are on the margin are expected to be a small portion of total hours and the final emission
factors are aggregated by upstate/downstate and averaged by month-hour.
4.1.2.2 Long-Run Marginal Emission Factors
Hourly long-run marginal emission factors were calculated by adjusting the short-run marginal factors
according to the estimated net CES target (the increase in renewable fraction relative to the baseline)
in each year based on NYSERDA’s estimates. The short-run marginal emission factors for each hour
were multiplied by the fraction of non-renewable energy allowed by the policy (in other words, a
factor of 1 minus the renewable fraction required). A similar approach was used by the California
Energy Commission in development of California’s 2019 Building Efficiency Standards.
41
For New York, the CES requires 70% renewable energy by 2030; however, this is evaluated relative
to t
he baseline of renewable energy when the CES originally went into effect expected to be online in
each year. Therefore, long-run marginal emission factors were calculated as the short-run marginal
emission factor multiplied by 100% minus the net CES increment, where net CES increment is the
difference between the annual renewable requirement (i.e., 70% in 2030) and the assumed renewable
baseline for that year:
=
(
100% %
)
=
In 2030 the assumed renewable baseline is 25.7% of the state’s electricity. This means that the
incremental renewables must be 44.3% of the state’s electricity (70% target – 25.7% baseline = 44.3%).
Therefore, long-run marginal emission factors in 2030 were calculated as short-run marginal emission

16
multiplied by (100% – 44.3%). For years where there is not an explicit renewable energy target,
an estimate was based on the trajectory to meet any future targets. For example, in order to
calculate emission factors for New York in 2025, we assumed an interim target of 48%.
Note that since the long-run factors are based on the short-run factors, the same caveats and
limitations described above for short-run factors apply.
4.1.3 Average Emission Factors
The production modeling produced total generation by resource type, which was used to calculate the
fraction of GHG-free electricity compared to the total electricity mix in 2025 and 2030. Average emission
factors for CO
2
were calculated based on the estimated fraction of GHG-free electricity in each year and
assigning an average heat rate of natural gas generators, 7,732 Btu/kWh, and corresponding natural gas
CO
2
emission rate, to the remaining thermal electricity mix.
42
4.1.4 Fuel Cycle Factors by GHG
The short-run marginal, long-run marginal, and average emission factors for CO
2
at point of fuel,
described above, were scaled by the ratio of emission rates for other GHGs to CO
2
to produce emission
factors for CH
4
and N
2
O, and to include upstream emissions for CO
2
, CH
4
, and N
2
O. The combined
direct (combustion) and upstream emission factors form the fuel cycle emission factors.
DEC recently published current emission rates by fuel as part of New York State’s GHG Inventory.
43
The data includes upstream and combustion emission rates for CO
2
, CH
4
, and N
2
O emissions from coal,
oil, gasoline, and natural gas. The upstream emission rates reflect emissions associated with extraction,
processing, transportation, and combustion of each fuel in a given year. Since there are currently no
projections of changes in upstream emission rates, we apply the current factors for future projections
as well. This will be reevaluated in the future should projection data become available.
4.2 Results
The full detailed emission factors and resulting social cost intensities are included in the spreadsheet
annexed to this document, including emission factors by year for 2025-2030 for each GHG; annual
and month-hour; long-run, short-run, and annual average; and the combined intensity of GHG value
per megawatt-hour. A sample of hourly-monthly marginal factors (statewide average, short-run
marginal, CO
2
, 2030) are presented in Table 2.
17
Table 2. Short-Run Marginal Emission Factors, CO
2
, Statewide, 2030 (metric tons/MWh)
1 2 3 4 5 6 7 8 9 10 11 12 13 14 15 16 17 18 19 20 21 22 23 24
1 0.218 0.189 0.
175 0.171 0.174 0.194 0.223 0.233 0.231 0.212 0.216 0.247 0.266 0.281 0.275 0.273 0.240 0.276 0.294 0.297 0.247 0.240 0.225 0.223
2 0.150 0.132 0.134 0.126 0.129 0.145 0.148 0.153 0.170 0.151 0.149 0.122 0.142 0.122 0.152 0.171 0.145 0.220 0.284 0.278 0.229 0.212 0.196 0.166
3 0.177 0.166 0.181 0.174 0.166 0.204 0.195 0.193 0.208 0.161 0.161 0.160 0.133 0.154 0.161 0.200 0.194 0.266 0.302 0.327 0.307 0.234 0.198 0.203
4 0.141 0.141 0.140 0.146 0.133 0.156 0.135 0.112 0.097 0.071 0.063 0.067 0.055 0.066 0.084 0.126 0.124 0.133 0.164 0.182 0.147 0.141 0.145 0.144
5 0.133 0.136 0.130 0.131 0.126 0.135 0.109 0.101 0.117 0.097 0.097 0.093 0.083 0.099 0.106 0.108 0.111 0.155 0.155 0.183 0.175 0.149 0.139 0.121
6 0.223 0.219 0.232 0.237 0.225 0.229 0.213 0.193 0.189 0.180 0.183 0.176 0.192 0.198 0.195 0.212 0.223 0.232 0.276 0.307 0.319 0.262 0.236 0.241
7 0.283 0.278 0.270 0.273 0.276 0.283 0.277 0.275 0.271 0.252 0.256 0.260 0.263 0.260 0.277 0.291 0.297 0.306 0.306 0.313 0.319 0.306 0.289 0.286
8 0.259 0.259 0.259 0.264 0.260 0.270 0.261 0.244 0.241 0.231 0.233 0.243 0.259 0.260 0.263 0.268 0.268 0.266 0.282 0.297 0.283 0.279 0.271 0.264
9 0.178 0.180 0.192 0.195 0.189 0.221 0.205 0.175 0.165 0.156 0.153 0.147 0.167 0.199 0.208 0.240 0.204 0.249 0.308 0.351 0.235 0.211 0.195 0.190
10 0.159 0.149 0.179 0.162 0.156 0.192 0.182 0.170 0.141 0.125 0.127 0.142 0.150 0.173 0.211 0.209 0.180 0.256 0.334 0.276 0.215 0.200 0.191 0.177
11 0.227 0.197 0.191 0.198 0.188 0.227 0.245 0.231 0.217 0.171 0.173 0.180 0.200 0.229 0.249 0.265 0.272 0.370 0.377 0.328 0.268 0.262 0.245 0.245
12 0.219 0.198 0.185 0.184 0.177 0.194 0.224 0.232 0.202 0.176 0.171 0.179 0.202 0.208 0.231 0.262 0.270 0.334 0.343 0.326 0.307 0.265 0.249 0.237
Hour
Month

18
5 Applying Emission Factors
To apply emission factors for a specific project, program, or policy, the appropriate load must
be determined. If loads are available for the end use, the associated generation can be estimated
by accounting for grid transmission and distribution loss, applying a loss factor of 7.12% from
generation to use
44
(end-use consumption should be multiplied by 1.077 to estimate generation
before multiplying by grid emission factors which are generation based).
That incremental load can then be evaluated by estimating the appropriate incremental GHG emissions by
year and ensuing societal cost or benefit, as described in the following sections. For years beyond 2030,
we recommended that the annual emissions and values be interpolated from the 2030 result to zero in
2040 and assumed to be zero beyond 2040.
5.1 Selecting the Applicable Emission Factor Type by Use Case
Table 3 shows the recommended use cases for each emission factor type. In some cases, the specific New
York policy or program may dictate which emission factor type is necessary. Based on the applicable use
case, the appropriate emission factors for all three pollutants can be selected from the tables in the annex
to this document for each year out to 2030. Beyond 2030, emission factors (and associated GHG value)
can be interpolated to zero in 2040, with the assumption that the state achieves the required 100% clean
grid required by the Climate Act by 2040.
Alternatively, if the soci
etal value of GHG is desired, the intensity of the value of GHG ($/MWh) can be
applied directly to the change in generation. The intensity of the value of GHG is available in the annex to
this document for short-term and long-term marginal and for average emissions factors by year, similar to
the emission factors.

19
Table 3. Recommended Use Cases for Each Emission Factor Type
Emission
Factor Type
Recommended Use Cases
Short-run
marginal
1. Avoided emissions of new supply-side renewable generation that generates renewable
energy certificates (RECs).
a
2. When the change in load will not cause the energy portfolio to rebalance to meet a
compliance target, such as:
• Direct emissions change (e.g., determine the immediate emissions associated
with load increase in a given hour).
• Emissions associated with a short-term or one-time change in load, that is not a
recurring or prolonged change and wouldn’t result in additional renewable build.
• Load shifting resources that do not have a large impact on total load (example:
battery storage).
• Unanticipated changes in load – in the near-term, this can be evaluated using
short-run marginal emission factors, but in the long-term they would affect
renewable procurement and need to use long-run marginal emission factors.
Long-run
marginal
All other load modifying instances, since the energy portfolio will be expected to rebalance
and build new renewables to accommodate the change in load. Long-run marginal emission
factors are used as a proxy to re-running a capacity expansion model to determine new
renewable build. Examples include:
• Building electrification
• Electric vehicles
• Behind-the-meter solar (or other distributed generation that does not generate
RECs; therefore, just treated as a load modifier instead of clean energy supply).
• Energy efficiency
Average Use when considering load impacts that are part of the expected total, such as:
• Calculating the total emissions footprint of a home, building, city, etc.
a
A REC is a certificate, created by a tracking system, such as the New York Generation Attribute Tracking System
(NYGATS), that represents the attributes of one MWh of electricity generated from a renewable source like solar
or wind. These RECs, or certificates, are needed to substantiate environmental claims related to energy use, such
as for compliance with a State-mandated renewable compliance program, or for “voluntary” claims such as a
climate action pledge.
5.2 Societal Value
Some applications require evaluating the benefits or costs associated with grid GHG emissions, in
addition to the emissions themselves. DEC published guidelines for calculating the Social Cost of GHG,
providing values for CO
2
, CH
4
, and N
2
O emissions in dollars per metric ton of each GHG.
45
The social
cost, or damages-based approach, represents the total future damages caused by emitted GHGs which is
also the social value of avoided emissions. These Social Cost values ($/metric ton of each GHG) can be
multiplied by the grid emission factors (metric tons of each GHG/MWh) to calculate the intensity of the
value of GHG ($/MWh). This value represents the marginal societal cost of electricity generation, or
marginal societal benefit for a reduction in generation.
20
For each set of emission factors, the intensity of the value of GHG was calculated by multiplying the
annual NYS Value of GHG for each GHG in each year by the associated emission factor and combining
the resulting value for the three GHGs. NYSERDA recommends following the DEC recommendation to
use a 2% discount rate as the central value for decision-making, though users of this methodology should
be attentive to relevant regulatory requirements covering their analysis. In particular, the Public Service
Commission’s current BCA Order
46
directs the use of a 3% discount rate. The attached Annex includes
the social cost intensity using both a 2% and a 3% discount rate to facilitate decision-making. Users may
also wish to evaluate and present a full range of the value of GHG, including values based on 1%, 2%,
and 3% as recommended in DEC’s Estimating a Value of Carbon paper.
The social cost is very sensitive to the discount rate selected. For example, the social cost of CO
2
emissions in 2022 is estimated at $53 per metric ton using a 3% discount rate and $124 per metric
ton using a 2% discount rate. (All values shown are in 2020 dollars.)

21
6 References
Astrape Consulting. SERVM Software. Accessed February 18, 2021. https://www.astrape.com/servm/
The Brattle Group. (March 1, 2018). Calculation of Hourly MERs for 2017 Customer Cost Impact
Analysis. Memorandum to NYISO.
CPUC. Cost-effectiveness: Avoided Cost Calculator. 2020 ACC. Accessed January 20, 2021.
https://www.cpuc.ca.gov/general.aspx?id=5267
Eastern Research Group, prepared for NYSERDA and DEC. (December 20, 2021). Technical
Documentation: Estimating Energy Sector Greenhouse Gas Emissions Under New York State’s
Climate Leadership and Community Protection Act.
https://www.dec.ny.gov/docs/administration_pdf/energyghgerg.pdf
EIA. (March 2022). Electric Power Annual 2020. Table 8.1. Average Operating Heat Rate for Selected
Energy Sources. https://www.eia.gov/electricity/annual/
Energy and Environmental Economics, Inc. (E3). (July 2016). Time Dependent Valuation of Energy for
Developing Building Efficiency Standards: 2019 Time Dependent Valuation (TDV) Data Inputs and
Sources. Prepared for the California Energy Commission. https://www.ethree.com/wp-
content/uploads/2017/01/TN212524_20160801T120224_2019_TDV_Methodology_Report_7222016
.pdf
Energy and Environmental Economics, Inc. (E3). (December 2015). The Benefits and Costs of Net
Energy Metering in New York. https://www.ethree.com/wp-content/uploads/2017/01/E3-NY-
Legislative-NEM-Study-Report-121115-FINAL-SENT.pdf
Environmental Protection Agency (EPA). Continuous Emission Monitoring Systems. Accessed February
1, 2021. https://www.epa.gov/emc/emc-continuous-emission-monitoring-systems
Environmental Protection Agency (EPA). Emissions & Generation Integrated Resource Database
(eGRID). Accessed February 2, 2021. https://www.epa.gov/eGRID
Environmental Protection Agency (EPA). Sources of Greenhouse Gas Emissions: Electricity. Accessed
February 18, 2021. https://www.epa.gov/ghgemissions/sources-greenhouse-gas-emissions
GE MAPS. https://www.geenergyconsulting.com/practice-area/software-products/maps
Government of Quebec. All sources of energy. Accessed July 11, 2022.
https://www.quebec.ca/en/agriculture-environment-and-natural-resources/energy/energy-production-
supply-distribution/sources-energy
ISO New England. (April 2022). 2020 ISO New England Electric Generator Air Emissions Report.
https://www.iso-ne.com/static-assets/documents/2022/05/2020_air_emissions_report.pdf
22
Newell et al., The Brattle Group. (August 10, 2017). Pricing Carbon into NYISO’s Wholesale Energy
Market to Support New York’s Decarbonization Goals.
https://www.nyiso.com/documents/20142/2244202/2017-Brattle-NY-Carbon-Study.pdf/156a738d-
e471-ccad-e146-07ac593ec0c3
New England Power Pool Generation Information System. Accessed July 1, 2022.
https://www.nepoolgis.com/
New York Department of Public Service. (July 1, 2015). Staff White Paper on Benefit-Cost Analysis in
the Reforming Energy Vision Proceeding. CASE 14-M-0101.
New York Department of Public Service. (July 17, 2017). Metrics, Tracking and Performance
Assessment Working Group. Final Performance Metrics Report – Phase 1, Attachment A. Accessed
February 18, 2021.
http://documents.dps.ny.gov/public/MatterManagement/CaseMaster.aspx?MatterCaseNo=16-
01008&submit=Search+by+Case+Number
New York Independent Electricity System Operator (NYISO). (April 2018). 2017 CARIS Report:
Congestion Assessment and Resource Integration Studies.
https://www.nyiso.com/documents/20142/2226108/2017-CARIS2017-Report-FINAL.pdf/7d228b1b-
eb5a-8288-370d-1d4d07bc5168
New York Independent Electricity System Operator (NYISO). (2018). IPPTF Carbon Pricing Proposal.
Accessed July 22, 2022. https://www.nyiso.com/documents/20142/3911819/Carbon-Pricing-
Proposal%20December%202018.pdf
New York Independent Electricity System Operator (NYISO). (2019). Carbon Pricing: Calculating the
LBMPc presentation to the Market Issues Working Group May 30, 2019. Accessed July 22, 2022.
https://www.nyiso.com/documents/20142/6785167/5.30.2019_MIWG_Carbon_Pricing_LBMPc_FIN
AL.pdf
NYS DEC. (2021). Statewide Greenhouse Gas Emission Limits. 6 NYCRR Part 496.
NYS DEC. (Revised May 2022). Establishing a Value of Carbon: Guidelines for Use by State Agencies.
https://www.dec.ny.gov/docs/administration_pdf/vocapp22.pdf and
https://www.dec.ny.gov/docs/administration_pdf/vocguid22.pdf
NYS DEC. NYS Statewide GHG Emissions Report: Summary Report. Accessed July 3, 2022.
https://www.dec.ny.gov/docs/administration_pdf/ghgsumrpt21.pdf
New York State Energy and Research Development Authority (NYSERDA). MER Hourly 2015 –
draft.xlsx. Heat map produced by NYSERDA based on data from The Brattle Group. Accessed
February 10, 2021.
https://www.nyiso.com/search?q=MER&sortField=newest&resultsLayout=list&start=30
New York State Energy and Research Development Authority (NYSERDA). (2022). Integration
Analysis: Key Drivers and Outputs (updated May 24, 2022). Annex 2 to Appendix G of the New
York Climate Action Council Draft Scoping Plan. https://climate.ny.gov/Climate-Resources
23
New York State Energy and Research Development Authority (NYSERDA) and Resources For the
Future. (October 2020, Revised April 2021). Estimating the Value of Carbon: Two Approaches.
https://media.rff.org/documents/RFF_NYSERDA_Valuing_Carbon_Synthesis_Memo.pdf
Ontario Independent Electricity System Operator (IESO). (2022). Reliability Outlook: An adequacy
assessment of Ontario’s electricity system: July 2022 to December 2023.
https://www.ieso.ca/en/Sector-Participants/Planning-and-Forecasting/Reliability-Outlook
Patton, D. et al. (2022). 2021 State of the Market Report for the New York ISO Markets.
https://www.nyiso.com/documents/20142/2223763/NYISO-2021-SOM-Full-Report-5-11-2022-
final.pdf
PJM Interconnection. Data Miner 2. Accessed July 4, 2022.
https://dataminer2.pjm.com/feed/fivemin_marginal_emissions/definition
PJM Interconnection. (April 18, 2022). 2017-2021 CO2, SO2, and NOx Emissions Rates.
https://www.pjm.com/-/media/library/reports-notices/special-reports/2021/2021-emissions-
report.ashx
PJM Interconnection. (April 18, 2022). 2017-2021 CO2, SO2, and NOx Emissions Rates, Table 2.
https://www.pjm.com/-/media/library/reports-notices/special-reports/2021/2021-emissions-
report.ashx
Siemens, prepared for NYSERDA. Appendix E to Initial Report on New York Power Grid Study: Zero‐
Emissions Electric Grid in New York by 2040.
State of New York Public Service Commission. (January 21, 2016). Proceeding on Motion of the
Commission in Regard to Reforming the Energy Vision: Order Establishing the Benefit Cost
Analysis Framework. CASE 14-M-0101.
State of New York Public Service Commission. (October 15, 2020). Proceeding on Motion of the
Commission to Implement a Large-Scale Renewable Program and Clean Energy Standard: Order
Adopting Modifications to the Clean Energy Standard. CASE 15-E-0302.
State of New York Public Service Commission. (April 14, 2022). Proceeding on Motion of the
Commission to Implement a Large-Scale Renewable Program and Clean Energy Standard: Order
Approving Contracts for the Purchase of Tier 4 Renewable Energy Certificates. CASE 15-E-0302.

A-1
Appendix A. Previous Studies and Analyses
A.1 Previous New York Analyses
In addition to the marginal emission factor used currently by NYSERDA and DPS of 0.55 short
tons CO
2
/MWh, other studies have also explored how to calculate marginal emission factors for
New York State.
A.1.1 E3 Net Energy Metering Study (2015)
In 2015, as part of the Net Energy Metering (NEM) study, E3 calculated a marginal CO
2
emission
factor for New York State.
47
E3 used data from the U.S. Environmental Protection Agency’s (EPA’s)
Emissions & Generation Resource Integrated Database (eGRID)
48
to calculate the annual average
emission rates for natural gas, oil, and coal power plants in New York. Then, E3 used generation data
from the 2014 NYISO State of the Market Report to estimate what fraction of the time each fuel-type
was on the margin. Since most hydroelectric power in New York is pumped storage, the marginal factor
for intervals with hydro on the margin was assumed to be natural gas, as the pumped storage would have
used electricity–likely from marginal natural gas generation–to pump water and store for later generation.
Using the adjusted marginal generator and the emissions rate for each generator type from eGRID, E3
calculated a weighted annual average marginal emissions factor. This resulted in a marginal emission
factor of 0.54 short tons CO
2
/MWh, as shown in Table A-1.
Table A-1. E3’s Marginal Emission Factor Calculation in the 2015 NEM Study
Resource
% of Marginal
Intervals
Hydro
Adjustment
Pounds per
MWh
Tons per
MWh
Tons per MWh
(Weighted)
Nuclear 0 0
Hydro 45 0
Coal 7 7 2,075.2 1.04 0.05
NG 76 121 1,032.4 0.52 0.45
Oil 6 6 1,527.7 0.76 0.03
Wind 4 4
Other 0 0
Total
138
138
0.54
A-2
A.1.2 The Brattle Group Marginal Emission Factor Analysis for NYISO (2017)
In 2017, the Brattle Group also developed marginal CO
2
emission factors for New York.
49
NYISO
provided 5-minute marginal unit dispatch data for 2015 and 2016, which the Brattle Group used to
determine the marginal unit in each timestep and assign a corresponding emissions rate for that unit.
During intervals when multiple units were on the margin, a simple average was used. When large
hydroelectric power was on the margin, an emissions rate of zero was assumed if the Locational
Marginal Price (LMP) was less than $10/MWh. If hydro was on the margin and the LMP was greater
than $10/MWh, then the average of adjacent emissions rates in the dispatch curve was used. Because
pumped hydro dispatch occurs based on market prices and corresponding opportunity costs, it was
assumed that if hydro is on the margin, then the emission factor can be assumed to be that of the
fossil fuel unit it is displacing.
The lower bound applied here for hydro generation of $10/MWh (which, in 2030 nominal dollars, would
correspond to a heat rate of approximately 750 Btu/kWh) was not used in this NYSERDA study in this
whitepaper since (1) the low implied marginal heat rates may reflect a mix of generation on the margin,
and thus are reflected appropriately in the emission factor calculation by their low implied heat rate (the
implied marginal heat rate method does not identify the type of resource on the margin); (2) the lower
bound of 0 allows for a more conservative approach; and (3) a sensitivity analysis explored lower
bounds and found the impacts were small even if a lower bound similar to that in the Brattle study
was to be implemented.
The analysis produced hourly marginal emission factors for 2015 and 2016. The hourly results can be
displayed as a heat map, as shown in Table A-2 for NYISO Zone A in 2015.
50
The results were also
aggregated into a NYCA-wide load-weighted marginal emission factor for 2015 of 0.47 short tons
CO
2
/MWh.
51
These results were used in The Brattle Group’s 2017 study for NYISO on how a carbon
price could be used to meet the state’s Clean Energy Standard targets.

A-3
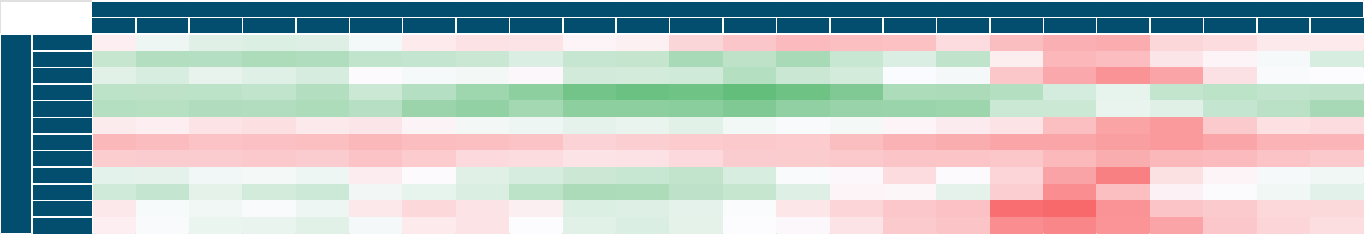
Table A-2. Heat Map of 2015 Marginal Emission Factors Produced for NYISO Zone A
Source: Heatmap produced by NYSERDA based on data from The Brattle Group, 2021
1 2 3 4 5 6 7 8 9 10 11 12 13 14 15 16 17 18 19 20 21 22 23 24
1 0.460 0.430 0.430 0.430 0.440 0.460 0.480 0.480 0.460 0.480 0.470 0.450 0.450 0.450 0.450 0.470 0.470 0.470 0.480 0.480 0.470 0.480 0.470 0.470
2 0.510 0.520 0.500 0.520 0.490 0.510 0.520 0.550 0.530 0.540 0.500 0.510 0.510 0.520 0.490 0.490 0.500 0.510 0.510 0.530 0.520 0.500 0.480 0.480
3 0.440 0.460 0.470 0.470 0.470 0.460 0.470 0.490 0.490 0.490 0.490 0.500 0.500 0.490 0.490 0.480 0.480 0.480 0.480 0.490 0.500 0.500 0.470 0.450
4 0.430 0.390 0.380 0.380 0.360 0.380 0.420 0.470 0.450 0.460 0.470 0.470 0.450 0.460 0.450 0.440 0.420 0.430 0.440 0.440 0.470 0.480 0.470 0.440
5 0.420 0.430 0.420 0.410 0.400 0.390 0.390 0.390 0.400 0.400 0.430 0.490 0.480 0.470 0.470 0.480 0.470 0.430 0.430 0.440 0.440 0.480 0.450 0.420
6 0.330 0.300 0.290 0.270 0.250 0.270 0.330 0.370 0.360 0.410 0.420 0.450 0.470 0.470 0.470 0.470 0.420 0.440 0.410 0.420 0.420 0.420 0.410 0.360
7 0.450 0.420 0.380 0.360 0.380 0.380 0.380 0.410 0.420 0.430 0.470 0.480 0.480 0.470 0.480 0.480 0.470 0.500 0.480 0.470 0.450 0.460 0.470 0.480
8 0.470 0.450 0.440 0.410 0.380 0.400 0.410 0.420 0.450 0.480 0.500 0.490 0.500 0.500 0.490 0.500 0.490 0.510 0.490 0.500 0.490 0.490 0.480 0.480
9 0.420 0.420 0.430 0.390 0.410 0.390 0.430 0.440 0.470 0.480 0.500 0.510 0.500 0.510 0.510 0.500 0.520 0.520 0.490 0.490 0.500 0.490 0.490 0.470
10 0.390 0.370 0.350 0.360 0.340 0.340 0.370 0.440 0.430 0.440 0.460 0.470 0.480 0.480 0.460 0.460 0.470 0.460 0.470 0.460 0.490 0.460 0.450 0.430
11 0.180 0.220 0.210 0.180 0.150 0.240 0.350 0.370 0.370 0.380 0.410 0.410 0.380 0.370 0.370 0.370 0.390 0.410 0.400 0.380 0.430 0.400 0.320 0.210
12 0.230 0.180 0.180 0.160 0.180 0.230 0.290 0.350 0.330 0.350 0.370 0.370 0.400 0.390 0.340 0.330 0.360 0.370 0.360 0.360 0.390 0.360 0.300 0.260
Hour
Month
A-4
A.2 Other Jurisdictions
A.2.1 California Public Utilities Commission
The California Public Utilities Commission (CPUC) produces projected emission factors in its Avoided
Cost Calculator (ACC).
52
The ACC is used by the CPUC, the investor-owned utilities (IOUs), and other
stakeholders to analyze the impacts of demand-side resources. The ACC is updated annually in the spring
(as of May 2022, the most recent version is from June 2021) and provides hourly outputs out to 2050. The
key output of the ACC is hourly avoided costs—meaning, the electricity system costs that are avoided
because of the load reduction from the demand-side resource—for energy, capacity, transmission,
distribution, and GHG.
The ACC also produces hourly emission factors for CO
2
, PM
10
, and NO
x
from 2021 to 2050,
calculated using the Implied Marginal Heat Rate method. This method, as described in
Section 4.1.2.1, uses electricity prices and fuel costs to infer a heat rate for the marginal generator,
and thus draw conclusions about the emissions rate on the margin. The ACC uses hourly electricity
price outputs (dollars per kilowatt-hour ($/kWh)) from production cost simulation modeling performed
for the state’s Integrated Resource Plan (IRP) using the SERVM model.
53
These prices are converted
into hourly marginal heat rates (in British thermal units (Btu) per kWh) using projected natural gas fuel
costs from the IRP. The ACC uses an upper bound of 12,500 Btu/kWh and a lower bound of zero to
cap the calculated implied marginal heat rates. The ACC then multiplies the hourly marginal heat
rates by the emissions factors (in lbs per MWh) from natural gas combustion for CO
2
, PM
10
, and
NO
x
to produce hourly marginal emission factors from 2021 through 2050.
A.2.2 PJM Interconnection
PJM Interconnection produces an annual emissions rate report each spring, providing calculated average
and marginal CO
2
emission factors for PJM from the previous five years. As of July 2022, the most
recent report encompasses electric generators in the PJM footprint from 2017 through 2021.
54
Since
September of 2021, PJM has also continuously updated 5-minute marginal emissions rates in its Data
Miner database.
55
These 5-minute emissions rates are provided at a nodal level, though are based on
the average annual emissions rates for each generator rather than reflecting the exact generator output
at that given moment in time.

A-5
For both the annual reports and its Data Miner database, PJM uses publicly available data to assign
each generator an emissions rate. First, PJM leverages data from EPA’s Continuous Emission Monitoring
Systems
56
(CEMS) database. The most recent PJM emissions report states that 98% of all PJM generation
was able to be assigned an emissions rate from CEMS or was from a non-emitting resource. When
CEMS data is not available, PJM uses EPA’s eGRID emission rates. Finally, for a small fraction of
PJM generation where CEMS or eGRID data is not available, PJM assigns a default emission factor
based on emissions from that fuel type.
PJM then uses 5-minute marginal unit dispatch data to assign a marginal emission rate for each interval.
The 5-minute emission factors are averaged within the on-peak period (defined as non-holiday weekdays
from 7 a.m. to 11 p.m.) and the off-peak period (all other hours) to produce marginal emission factors by
period for each month.
PJM also calculates system average emission factors for each month. The share of generation (MWh)
for each unit is multiplied by its emission factor, then summed and divided by total generation to get
a load-weighted average emission factor for PJM.
The marginal and average emission factors for each month are shown in Table A-3.
57
Table A-3. PJM’s Marginal CO
2
Emission Factors for 2017-2021 (lbs/MWh)
Source: PJM Interconnection, 2022
A-6
A.2.3 ISO New England
ISO New England produces an annual emissions report. As of June 2022, the most recent report available
is the 2020 report, published in April 2022.
58
This report calculates both a system average emission factor
and marginal emission factors and includes CO
2
as well as some criteria pollutants.
The system average emission factor is calculated simply as the total emissions from ISO New England
divided by total generation. The marginal emission factor analysis uses 5-minute marginal unit dispatch
data from the ISO, where the marginal unit is the generator that set the locational marginal price (LMP)
for each 5-minute interval. ISO New England then assigns emissions rates for each generator based on
available data from EPA’s CEMS database, the New England Power Pool Generation Information
System
59
(NEPOOL GIS), or EPA’s eGRID data.
Using the assigned emission rates, the ISO aggregates the marginal emission factors from the
5-minute intervals into on-peak periods (defined as weekdays, 8 a.m. to 10 p.m.) and off-pea
k
pe
riods (all other hours), as well as annual marginal emission factors. The report uses two approaches
for the annual marginal emission factors: a time-weighted emission factor, which is weighted based on
t
he amount of time each unit was on the margin, and a load-weighted emission factor, which is base
d on
t
he amount of load served by each unit. Furthermore, the report also shows the overall marginal emission
factor compared to marginal emission factors for emitting locational marginal units (LMUs) only, as we
ll
a
s marginal emission factors for the top five high electric demand days (HEDDs). New to the 2020 report
,
ISO New England also provides average emissions rates for net imports, which amounted to 20% of total
e
nergy for the year 2020. These rates for net imports are currently only provided as a ten-year average for
CO
2
, and not yet for NO
x
or SO
2
or in marginal emission rates calculations. Results from ISO New
E
ngland’s analysis are shown in Figure A-1.
60

A-7
Figure A-1. ISO New England's 2020 Emission Factors (lbs/MWh)

B-1
Appendix B. Production Model Simulation Scenario
Selection and Interpolation
Emission factors in this analysis were calculated based on existing available electricity prices modeled
by Siemens for NYSERDA for the Power Grid Study using the PROMOD model. The Power Grid
Study produced scenarios for 2025 and 2030 only. Each scenario had different assumptions on when
the Champlain Hudson Power Express (CHPE) and Clean Path New York (CPNY) renewable power
transmission projects would come online. The available scenarios included:
• A scenario with CHPE transmission line coming online in 2025.
• An updated scenario with the CHPE transmission line coming online in January 2026.
• A scenario with both approved Tier 4 transition projects, both assumed to be online in 2025.
• An updated Tier 4 scenario with CHPE online in January 2026 and CPNY online in
July 2027 – these are the most recent assumptions.
Since PROMOD analysis was not available for each year with the final dates for each project, in order
to produce electricity price assumptions for 2022 through 2040 that best represent the expected dates
each project would be online per the final analysis for those projects, the Power Grid Study scenarios
were used and interpolated as shown in Table B-1.
Table B-1. Power Grid Study Scenarios Applied for Emission Factor Analysis
Year(s)
Power Grid Study Scenarios
2022-2024
Short-run marginal emission factors were assumed to be the same as 2025. Long-run
marginal emission factors were adjusted by the corresponding Net CES for each year.
2025
2025 electricity prices were used from the Power Grid Study’s 2025 scenario
with CHPE coming online in January 2026 and CPNY online in July 2027.
2026 2026 electricity prices were linearly interpolated between two Power Grid Study
scenarios: a 2025 scenario that represented CHPE coming online in 2025 and
a 2030 scenario that represented CHPE coming online in 2026.
Jan-June 2027
July-December 2027
2027 electricity prices were linearly interpolated between two Power Grid Study
scenarios: a 2025 scenario that represented both CHPE and CPNY coming online
in 2025 and a 2030 scenario that represented CHPE coming online in January 2026
and CPNY coming online in July 2027.
2028-2029
2030
2030 electricity prices were used from the Power Grid Study’s 2030 scenario
with CHPE coming online in January 2026 and CPNY online in July 2027.
2031-2040 Emission factors from 2030 are interpolated linearly to zero by 2040.

EN-1
Endnotes
1
New York Senate Bill S6599 (2019).
2
6 NYCRR Part 496
3
NY DPS, Metrics, Tracking and Performance Assessment Working Group, Final Performance Metrics
Report – Phase 1, Attachment A.
4
State of New York PSC, Proceeding on Motion of the Commission in Regard to Reforming the Energy Vision:
Order Establishing the Benefit Cost Analysis Framework, CASE 14-M-0101.
5
NY DPS, Staff White Paper on Benefit-Cost Analysis in the Reforming Energy Vision Proceeding, 14-M-0101.
6
Eastern Research Group, Technical Documentation: Estimating Energy Sector Greenhouse Gas Emissions
Under New York State’s Climate Leadership and Community Protection Act.
7
DEC, NYS Statewide GHG Emissions Report: Summary Report.
8
State of New York PSC, Proceeding on Motion of the Commission to Implement a Large-Scale Renewable Program
and Clean Energy Standard: Order Adopting Modifications to the Clean Energy Standard, CASE 15-E-0302.
9
Siemens, Appendix E to Initial Report on New York Power Grid Study: Zero‐Emissions Electric Grid in New
York by 2040.
10
State of New York PSC, Proceeding on Motion of the Commission to Implement a Large-Scale Renewable
Program and Clean Energy Standard: Order Approving Contracts for the Purchase of Tier 4 Renewable
Energy Certificates, CASE 15-E-0302.
11
NYISO, IPPTF Carbon Pricing Proposal.
12
NYISO, Carbon Pricing: Calculating the LBMPc.
13
Eastern Research Group, Technical Documentation: Estimating Energy Sector Greenhouse Gas Emissions
Under New York State’s Climate Leadership and Community Protection Act.
14
NYSERDA, Integration Analysis -- Key Drivers and Outputs (updated May 24, 2022). Annex 2 to Appendix G
of the New York Climate Action Council Draft Scoping Plan.
15
DEC, Establishing a Value of Carbon: Guidelines for Use by State Agencies.
16
New York Senate Bill S6599 (2019).
17
6 NYCRR Part 496
18
DEC, Establishing a Value of Carbon: Guidelines for Use by State Agencies.
19
NYSERDA and Resources For the Future, Estimating the Value of Carbon: Two Approaches.
20
DEC, Establishing a Value of Carbon: Guidelines for Use by State Agencies.
21
EPA, Sources of Greenhouse Gas Emissions: Electricity.
22
State of New York PSC, Proceeding on Motion of the Commission to Implement a Large-Scale Renewable Program
and Clean Energy Standard: Order Adopting Modifications to the Clean Energy Standard, CASE 15-E-0302.
23
DEC, NYS Statewide GHG Emissions Report: Summary Report.
24
Eastern Research Group, Technical Documentation: Estimating Energy Sector Greenhouse Gas Emissions
Under New York State’s Climate Leadership and Community Protection Act.
25
New York Department of Public Service, Metrics, Tracking and Performance Assessment Working Group,
Final Performance Metrics Report – Phase 1, Attachment A.
26
GE MAPS
27
NYISO, 2017 CARIS Report: Congestion Assessment and Resource Integration Studies.
28
State of New York PSC, Proceeding on Motion of the Commission in Regard to Reforming the Energy Vision:
Order Establishing the Benefit Cost Analysis Framework, CASE 14-M-0101.
29
State of New York PSC, Staff White Paper on Benefit-Cost Analysis in the Reforming Energy Vision Proceeding,
14-M-0101.
EN-2
30
Siemens, Appendix E to Initial Report on New York Power Grid Study: Zero‐Emissions Electric Grid in
New York by 2040.
31
State of New York PSC, Proceeding on Motion of the Commission to Implement a Large-Scale Renewable Program
and Clean Energy Standard: Order Approving Contracts for the Purchase of Tier 4 Renewable Energy Certificates,
CASE 15-E-0302.
32
Patton, D. et al. 2021 State of the Market Report for the New York ISO Markets.
33
NYISO, IPPTF Carbon Pricing Proposal.
34
NYISO, Carbon Pricing: Calculating the LBMPc.
35
Eastern Research Group, Technical Documentation: Estimating Energy Sector Greenhouse Gas Emissions
Under New York State’s Climate Leadership and Community Protection Act.
36
Patton, D. et al.
37
Patton, D. et al.
38
Government of Quebec, All sources of energy.
39
Ontario IESO, Reliability Outlook: An adequacy assessment of Ontario’s electricity system: July 2022 to
December 2023.
40
PJM Interconnection, 2017-2021 CO
2
, SO
2
, and NO
x
Emissions Rates.
41
E3, Time Dependent Valuation of Energy for Developing Building Efficiency Standards: 2019 Time Dependent
Valuation (TDV) Data Inputs and Sources.
42
EIA, Electric Power Annual 2020.
43
Eastern Research Group, Technical Documentation: Estimating Energy Sector Greenhouse Gas Emissions
Under New York State’s Climate Leadership and Community Protection Act.
44
NYSERDA, Integration Analysis -- Key Drivers and Outputs.
45
Patton, D. et al.
46
State of New York PSC, Proceeding on Motion of the Commission in Regard to Reforming the Energy Vision:
Order Establishing the Benefit Cost Analysis Framework, CASE 14-M-0101.
47
E3, The Benefits and Costs of Net Energy Metering in New York.
48
EPA, Emissions & Generation Integrated Resource Database (eGRID).
49
The Brattle Group, Calculation of Hourly MERs for 2017 Customer Cost Impact Analysis, Memorandum to NYISO.
50
NYSERDA, Heat map produced based on The Brattle Group.
51
Newell et al., Pricing Carbon into NYISO’s Wholesale Energy Market to Support New York’s
Decarbonization Goals.
52
CPUC, Cost-effectiveness: Avoided Cost Calculator, 2020 ACC.
53
Astrape Consulting, SERVM Software.
54
PJM Interconnection, 2017-2021 CO2, SO2, and NOx Emissions Rates.
55
PJM Interconnection, Data Miner 2.
56
EPA, Continuous Emission Monitoring Systems.
57
PJM Interconnection, 2017-2021 CO2, SO2, and NOx Emissions Rate.
58
ISO New England, 2020 ISO New England Electric Generator Air Emissions Report.
59
New England Power Pool Generation Information System.
60
ISO New England, 2020 ISO New England Electric Generator Air Emissions Report.

NYSERDA, a public benefit corporation, oers objective
information and analysis, innovative programs,
technical expertise, and support to help New Yorkers
increase energy eciency, save money, use renewable
energy, and reduce reliance on fossil fuels. NYSERDA
professionals work to protect the environment
and create clean-energy jobs. NYSERDA has been
developing partnerships to advance innovative energy
solutions in New York State since 1975.
To learn more about NYSERDA’s programs and funding opportunities,
visit nyserda.ny.gov or follow us on Twitter, Facebook, YouTube, or
Instagram.
New York State
Energy Research and
Development Authority
17 Columbia Circle
Albany, NY 12203-6399
toll free: 866-NYSERDA
local: 518-862-1090
fax: 518-862-1091
nyserda.ny.gov

State of New York
Kathy Hochul, Governor
New York State Energy Research and Development Authority
Richard L. Kauman, Chair | Doreen M. Harris, President and CEO
