National Center for Family & Marriage Research
@ Bowling Green State University
Family Profile No. 15, 2018
First Divorce Rate in the U.S., 2016
Author: Krista K. Payne
Over the past forty years, the overall divorce rate has declined to the lowest level since 1970, dropping to 16.7 in 2016 (FP-17-24).
Americans often marry more than one time; 24% of ever-married women in 2016 were in a second or higher marriage (U.S.
Census Bureau, ACS, 1-yr est., 2016). We examine the first divorce rate, because first marriages are less likely to end through
divorce than are remarriages (Cohen, 2016). The first divorce rate is defined as the number of first marriages that ended in
divorce per 1,000 first marriages for women 18 years and older in 2014 using data from the American Community Survey. First
Divorce Rate, 2016 (FP-18-15) is an update to FP-16-19, FP-14-09, FP-11-09, and FP-10-06.
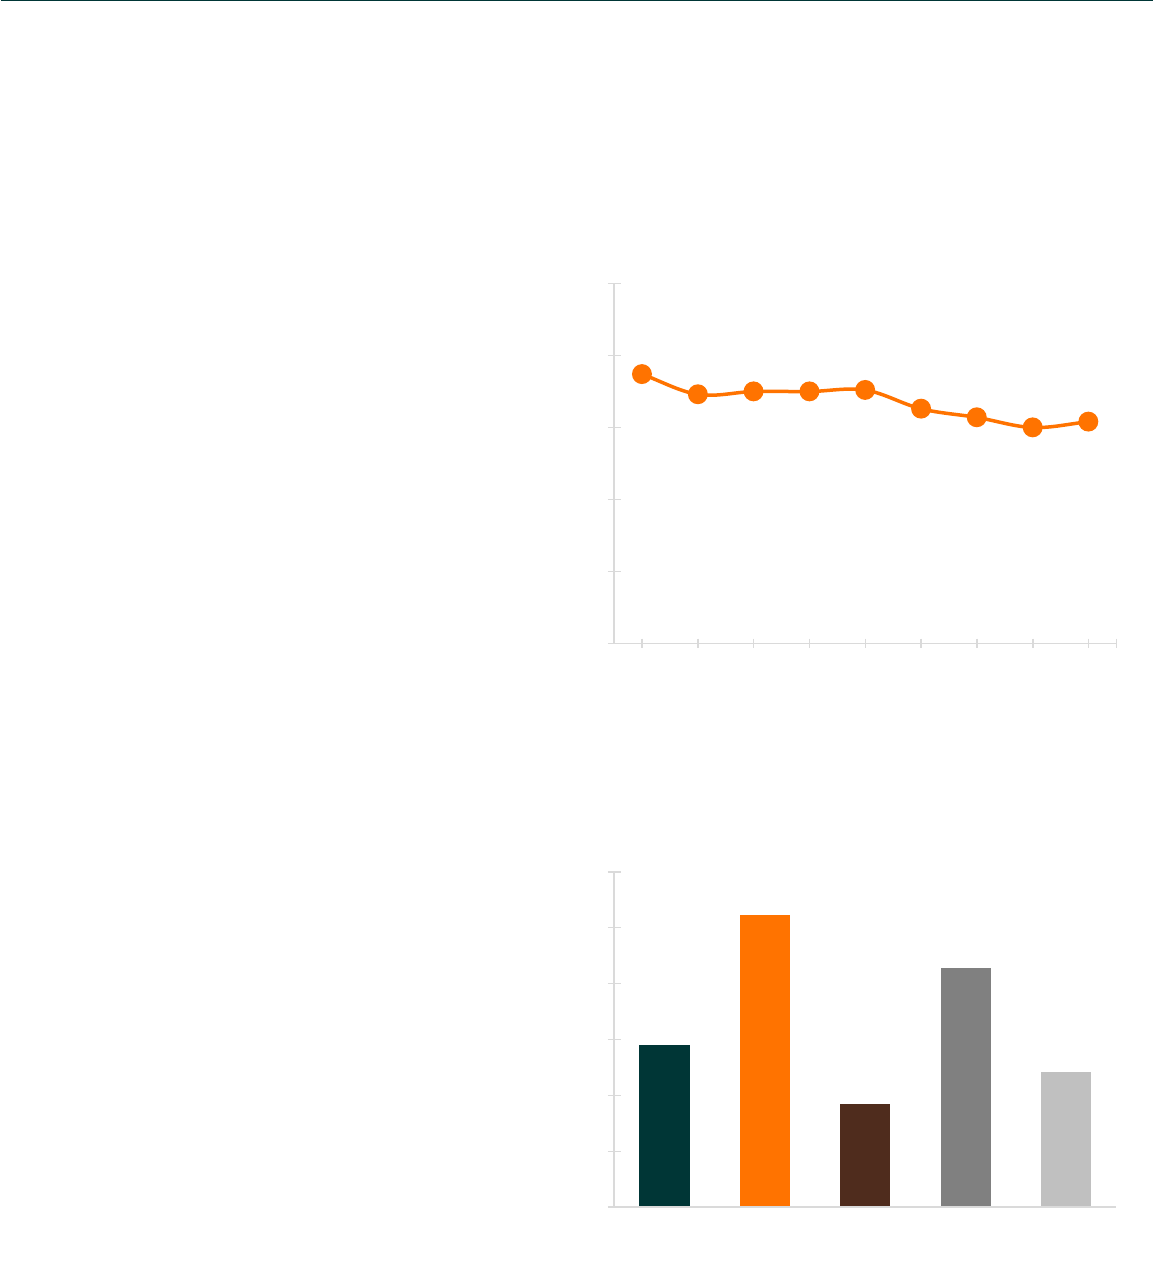
Trends in the First Divorce Rate
• The first divorce rate generally decreased from
2008 to 2015.
• From 2009 to 2012, the divorce rate plateaued at
around 17.5.
• After 2012, the first divorce rate declined, reaching
a seven-year low in 2015 of 15.0 divorces per 1,000
married women before rising slightly in 2016 to
15.4.
• There were 781,398 first divorces in 2016.
Figure 1. First Divorce Rate for Women 18 and Older, 2008-2016
Source: NCFMR analyses of U.S. Census Bureau, American Community
Survey, 1-yr. est., 2008-2016
First Divorce Rate by Race and Ethnicity
• In 2016, Black women had the highest first divorce
rate (26.1).
• Asian women experienced the lowest first divorce
rate (9.2).
• There is a nativity gap among Hispanics with
foreign-born Hispanics having a lower first divorce
rate (12.1) than native-born Hispanics (21.4).
Figure 2. First Divorce Rate for Women 18 and Older by Race and
Ethnicity, 2016
S
ource: U.S. Census Bureau, American Community Survey, 1-yr. est., 2016
Note: N.B. represents Native Born and F.B. represents Foreign Born.
18.7
17.3
17.5 17.5
17.6
16.3
15.7
15.0
15.4
0
5
10
15
20
25
2008 2009 2010 2011 2012 2013 2014 2015 2016
14.5
26.1
9.2
21.4
12.1
0
5
10
15
20
25
30
White Black Asian N.B.
Hispanic
F.B.
Hispanic

First Divorce Rate by Educational Attainment
• There continues to be a curvilinear relationship
between education and the first divorce rate. Women
with the least education (less than high school) and
the most education (a bachelor’s degree or higher)
have the lowest divorce rates.
• The first divorce rate is highest for women with some
college education.
Figure 3. First Divorce Rate for Women 18 and Older by Educational
Attainment, 2016
.
13.3
14.8
20.1
12.7
0
5
10
15
20
25
<H.S. H.S./GED Some College Bachelor's+
Source: NCFMR analyses of U.S. Census Bureau, American Community
Survey, 1-yr. est., 2016
References:
L. R. (2016). First divorce rate in the U.S., 2014. Family Profiles, FP-16-19. Bowling Green, OH: National Center for Family & Marriage Research.
https://www.bgsu.edu/ncfmr/resources/data/family-profiles/anderson-first-divorce-rate-2014-fp-16-19.html
Cohen, P. N. (2016). Multiple-decrement life tables from 2010-2012 American Community Survey data marital events. Retrieved from
https://familyinequality.wordpress.com/2016/06/08/life-table-says-divorce-rate-is-52-7/
Gibbs, L. & Payne, K. K. (2011). First divorce rate, 2010. Family Profiles, FP-11-09. Bowling Green, OH: National Center for Family & Marriage Research.
http://www.bgsu.edu/content/dam/BGSU/college-of-arts-and-sciences/NCFMR/documents/FP/FP-11-09.pdf
Hemez, P. (2017). Divorce rate in the U.S.: Geographic variation, 2016. Family Profiles, FP-17-24. Bowling Green, OH: National Center for Family & Marriage
Research. https://doi.org/10.25035/ncfmr/fp-17-24.
Payne, K. K. (2011). First divorces in the U.S., 2008. Family Profiles, FP-10-06. Bowling Green, OH: National Center for Family & Marriage Research.
http://www.bgsu.edu/content/dam/BGSU/college-of-arts-and-sciences/NCFMR/documents/FP/FP-10-06.pdf
Stykes, B., Gibbs, L., & Payne, K. K. (2014). First divorce rate, 2012. Family Profiles, FP-14-09. Bowling Green, OH: National Center for Family & Marriage
Research. http://www.bgsu.edu/content/dam/BGSU/college-of-arts-and-sciences/NCFMR/documents/FP/FP-14-09-divorce-rate-2012.pdf
Suggested Citation:
Payne, K. K. (2018). First divorce rate in the U.S., 2016. Family Profiles, FP-18-15. Bowling Green, OH: National Center for Family &
Marriage Research. https://doi.org/10.25035/ncfmr/fp-18-15
This project is supported with assistance from Bowling Green State University. From 2007 to 2013, support was also provided by the U.S. Department of Health and Human
Services, Office of the Assistant Secretary for Planning and Evaluation. The opinions and conclusions expressed herein are solely those of the author(s) and should not be construed
as representing the opinions or policy of any agency of the state or federal government.
http://www.bgsu.edu/ncfmr
ncfmr@bgsu.edu
(419) 372-3119
