
Audit Report
Beneficiaries Who Received
Vocational Rehabilitation Services
A-02-18-50544 | October 2021

MEMORANDUM
Date:
October 13, 2021
Refer To: A-02-18-50544
To:
Kilolo Kijakazi
Acting Commissioner
From:
Gail S. Ennis,
Inspector General
Subject:
Beneficiaries Who Received Vocational Rehabilitation Services
The attached final report presents the results of the Office of Audit’s review. The objective was
to determine whether beneficiaries who received Vocational Rehabilitation services attribute
those services to their work-related outcomes.
If you wish to discuss the final report, please contact Michelle L. Anderson,
Assistant Inspector General for Audit.
Attachment

Beneficiaries Who Received Vocational
Rehabilitation Services
A-02-18-50544
October 2021 Office of Audit Report Summary
Objective
To determine whether beneficiaries
who received Vocational Rehabilitation
(VR) services attribute those services
to their work-related outcomes.
Background
VR provides an individual who has a
physical or mental impairment the
support he/she needs to become
employed or maintain employment.
VR agencies in each State or
U.S. territory administer the VR
program to help individuals with
impairments become gainfully
employed.
While prior Office of the Inspector
General reports have noted work
outcomes after beneficiaries received
VR services, they could not definitively
link the outcomes to the VR services.
For this report, we surveyed
250 beneficiaries with successful and
250 beneficiaries with unsuccessful
work outcomes after receiving VR
services to determine whether they
attributed those services to their work-
related outcomes.
Findings
More beneficiaries in our population had unsuccessful work
outcomes after they received VR services than those who had
successful outcomes – 62 percent did not have successful work
outcomes while 38 percent did. The beneficiaries with successful
work outcomes were more likely to attribute the VR services they
received to their work-related outcomes. The beneficiaries with
unsuccessful work outcomes did not find VR services as helpful.
Some indicated they did not receive sufficient help from the VR
agencies or counselors.
The VR agencies are an important part of beneficiaries’ efforts to
return to work. While SSA reimburses VR agencies for services
provided, the Agency does not have authority over the quality of
those services. However, SSA regularly meets with State VR
agencies to discuss reimbursement policy and practices, so it has
opportunities to discuss concerns raised in our survey results with
the State agencies.
Recommendation
We recommend SSA inform State VR agencies about the results of
our survey, especially the survey responses that suggest VR
services were not fully effective in assisting beneficiaries to gainful
employment.
SSA agreed with our recommendation.

Beneficiaries Who Received Vocational Rehabilitation Services (A-02-18-50544)
TABLE OF CONTENTS
Objective .........................................................................................................................................1
Background ....................................................................................................................................1
Prior Office of Inspector General Reports ...........................................................................2
Audit Population .....................................................................................................................2
Results Of Review..........................................................................................................................2
Survey Results .........................................................................................................................3
Satisfaction Rating ............................................................................................................3
Employment After Vocational Rehabilitation Services Began ...................................4
Attribution of Employment to Vocational Rehabilitation Services ...........................4
Individualized Plan for Employment .............................................................................5
Assessment of Vocational Rehabilitation Services Received ......................................6
Reason for Unemployment Since Vocational Rehabilitation Services ......................8
SSA’s Relationship with State Vocational Rehabilitation Agencies .................................9
Earnings for Beneficiaries Who Did and Did Not Receive Vocational Rehabilitative
Services .....................................................................................................................................9
Recommendation ........................................................................................................................10
Agency Comments .......................................................................................................................10
– Scope and Methodology .................................................................................. A-1
– Survey Responses ............................................................................................ B-1
– Beneficiary Demographics ............................................................................. C-1
– State Vocational Rehabilitation Agency Analysis ....................................... D-1
– Agency Comments ............................................................................................... E-1

Beneficiaries Who Received Vocational Rehabilitation Services (A-02-18-50544)
ABBREVIATIONS
DCF Disability Control File
IPE Individualized Plan for Employment
OIG Office of the Inspector General
POMS Program Operations Manual System
Pub. L. No. Public Law Number
RSA Rehabilitation Services Administration
SGA Substantial Gainful Activity
SSA Social Security Administration
U.S.C. United States Code
VR Vocational Rehabilitation

Beneficiaries Who Received Vocational Rehabilitation Services (A-02-18-50544) 1
OBJECTIVE
Our objective was to determine whether beneficiaries
1
who received Vocational Rehabilitation
(VR) services attribute those services to their work-related outcomes.
BACKGROUND
VR provides an individual who has a physical or mental impairment the support he/she needs to
become employed or maintain employment. VR agencies in each State or U.S. territory
administer the VR program to help individuals with physical or mental impairments become
gainfully employed.
When an individual is being considered for services by a State VR agency, a rehabilitation
counselor evaluates the individual’s vocational potential, based on medical and vocational
findings, to determine his/her eligibility for services. Before it provides services, the VR agency
works with the individual to develop a customized
Individualized Plan for Employment (IPE) that
spells out, among other things, employment outcomes consistent with the goal of mainstream
employment, the services needed to achieve the employment outcomes, and the timeframes
needed to achieve the employment outcomes.
2
The Rehabilitation Act of 1973,
3
as amended, Title I, Parts A and B,
4
outlines the available
services a State VR agency provides. The services may include the following.
An assessment by qualified personnel to determine eligibility and VR needs, including, if
appropriate, personnel skilled in rehabilitation technology.
Job-related services, including job search and placement assistance, job retention services,
follow-up services, and follow-along services.
Vocational and other training services, including the provision of personal and vocational
adjustment services, books, tools, and other training materials.
Transportation, including training in using public transportation.
The
Social Security Act authorizes SSA to pay State VR agencies for the services they provide
beneficiaries who meet certain conditions.
5
For example, the services must have contributed to
the person achieving work at the substantial gainful activity (SGA) level for 9 continuous
months, and the person’s reduced reliance on program benefits must generate savings to the
trust or general fund.
1
We use the term “beneficiaries” throughout the report to refer to both Disability Insurance beneficiaries and disabled
Supplemental Security Income recipients.
2
An employment outcome could also be self-employment or supported employment in which the individual receives
temporary services, such as supplementary assessments, a job trainer at a work site, or social skills training to help
him/her retain employment.
3
Rehabilitation Act of 1973, Pub. L. No. 93-112, 87 Stat. 355.
4
Rehabilitation Act of 1973, Pub. L. No. 93-112, 87 Stat.363-371, §§ 100-111.
5
42 U.S.C. § 1382d.

Beneficiaries Who Received Vocational Rehabilitation Services (A-02-18-50544) 2
SSA does not manage State VR agencies. State VR agencies use existing rehabilitation
definitions and practices to operate under regulations issued by the Department of Education’s
Rehabilitation Services Administration. Per SSA, it conducts a teleconference each quarter with
all State VR agencies to provide policy and procedural information. The Agency also conducts
reviews to ensure it correctly reimburses State VR agencies for services beneficiaries received.
Prior Office of Inspector General Reports
In a June 2017 audit,
6
we reviewed the accuracy of SSA’s reimbursements to State VR
agencies and found SSA did not always verify that beneficiaries met the primary conditions for
reimbursement or obtain required documentation. In an October 2017 report,
7
we stated SSA
saved more funds when beneficiaries returned to work after they received VR services than it
paid for those services. The report also noted that, while SSA saved more than it spent overall
for VR services, many beneficiaries had higher costs for VR services when compared to the
program savings generated by forgoing Disability Insurance benefits or Supplemental Security
Income payments because they returned to work.
While our prior reports may have noted work outcomes after beneficiaries received VR services,
they could not definitively link those work outcomes to the VR services provided. This report
attempts to do so by asking the beneficiaries whether they attribute their work outcomes to the
VR services they received.
Audit Population
From SSA’s Disability Control File, we identified 20,478 beneficiaries who left State VR
agencies with recorded outcomes from March through May 2019 and who had not re-enrolled
with a State VR agency after their exit when we selected our data. Of these, 7,876 (38 percent)
successfully worked at the SGA level for 9 continuous months or longer before they exited VR
agencies, and 12,602 (62 percent) did not successfully work at the SGA level for 9 continuous
months. We surveyed 250 beneficiaries with successful work and 250 beneficiaries with
unsuccessful work outcomes to determine whether they attributed the VR services received to
their work-related outcomes (refer to Appendix C for our analysis of the beneficiaries’
characteristics). Of the 500 beneficiaries surveyed, 285 responded: 148 (59 percent) of the
250 beneficiaries with successful outcomes and 137 (55 percent) of the 250 beneficiaries with
unsuccessful outcomes. See Appendix B for the survey questions and responses.
RESULTS OF REVIEW
More beneficiaries in our population had unsuccessful work outcomes after they received VR
services than those who had successful outcomes – 62 percent did not have successful work
outcomes while 38 percent did. Per our survey, the beneficiaries with unsuccessful work
outcomes did not find VR services as helpful as those with successful work outcomes. While
SSA reimburses VR agencies for services provided, SSA does not have authority over the
quality of those services. Accordingly, while our survey indicates VR agencies could better
6
SSA, OIG, Vocational Rehabilitation Services Reimbursements for Supplemental Security Income and Disability
Insurance Beneficiaries, A-15-14-14095 (June 2017).
7
SSA, OIG, The Cost-effectiveness of Vocational Rehabilitation Services, A-02-17-14048 (October 2017).

Beneficiaries Who Received Vocational Rehabilitation Services (A-02-18-50544) 3
serve some beneficiaries, SSA has limited ability to effect change in the quality of VR services
its beneficiaries receive.
Survey Results
Satisfaction Rating
We asked the beneficiaries to rate the VR services they received on a scale from 1 to 10, with
1 being “it did not help me at all” and 10 being “it helped me greatly.” Beneficiaries with
successful work outcomes provided a mean rating of 7.6 while beneficiaries with unsuccessful
work outcomes had a mean rating of 4.7 (see Table 1).
Table 1: Satisfaction Rating of VR Services Received
Category 1 2 3 4 5 6 7 8 9 10 Mean
Rating
Successful
Work
Outcomes
9
4
8
2
9
8
13
14
15
62
7.6
Unsuccessful
Work
Outcomes
28
16
8
9
14
13
5
7
9
13
4.7
Note: Figures are based on the beneficiaries’ responses to Question 16 of the survey (see Appendix B). Of the
285 beneficiaries who responded to our survey, 19 did not respond to this question.
Beneficiaries with successful work outcomes generally provided favorable comments on the VR
services they received. The following are examples of their comments.
A beneficiary residing in Ohio stated, “I would say if anyone is interested to get back to work,
take advantage of the VR services available.”
A beneficiary residing in Wisconsin stated, the VR agency “. . . gave me confidence to try to
find a job. They made sure I was a good fit. I love my job so thank you! I feel like a part of
society.”
A beneficiary residing in Utah stated, “They were kind and genuinely interested in me and in
helping me.”
Beneficiaries with unsuccessful work outcomes generally provided less favorable comments on
the VR services they received. Of the beneficiaries with unsuccessful work outcomes who
provided a rating of five or less, most indicated they did not receive sufficient help from the VR
agencies or VR counselors. The following are examples of their comments.
A beneficiary residing in New York stated, “They need to do more for people with disability.
They were not providing enough help to people who need it. I had to find a job myself
without any help from my VR agency.”
A beneficiary residing in Hawaii stated, “Counselors were very nice but had nothing of any
value at all to offer. After 5 years of service, I still have no clue what VR actually does other
than keeping themselves employed.”

Beneficiaries Who Received Vocational Rehabilitation Services (A-02-18-50544) 4
A beneficiary residing in Texas stated, “Counselor that closed my case was thoroughly
unhelpful. She was difficult to reach and required very personally invasive information about
me to continue to help. My case was closed because I refused to seek her help further.”
Employment After Vocational Rehabilitation Services Began
State VR agencies should prepare disabled individuals to engage in employment or supported
employment and achieve economic self-sufficiency. We asked beneficiaries whether they
worked after they began receiving VR services. Beneficiaries with successful work outcomes
before they exited VR were much more likely to report being employed or having been
employed than those with unsuccessful outcomes. Specifically, 91 percent of the beneficiaries
with successful work outcomes reported they worked after they began receiving VR services,
compared to only 38 percent of beneficiaries with unsuccessful work outcomes.
8
Of those who reported they worked after they received VR services, the majority (76 percent of
the beneficiaries with successful and 45 percent of the beneficiaries with unsuccessful work
outcomes) reported they were working part time. Additionally, more beneficiaries with
unsuccessful work outcomes reported that they were not employed and not looking for a job at
the time they competed the survey.
9
Attribution of Employment to Vocational Rehabilitation
Services
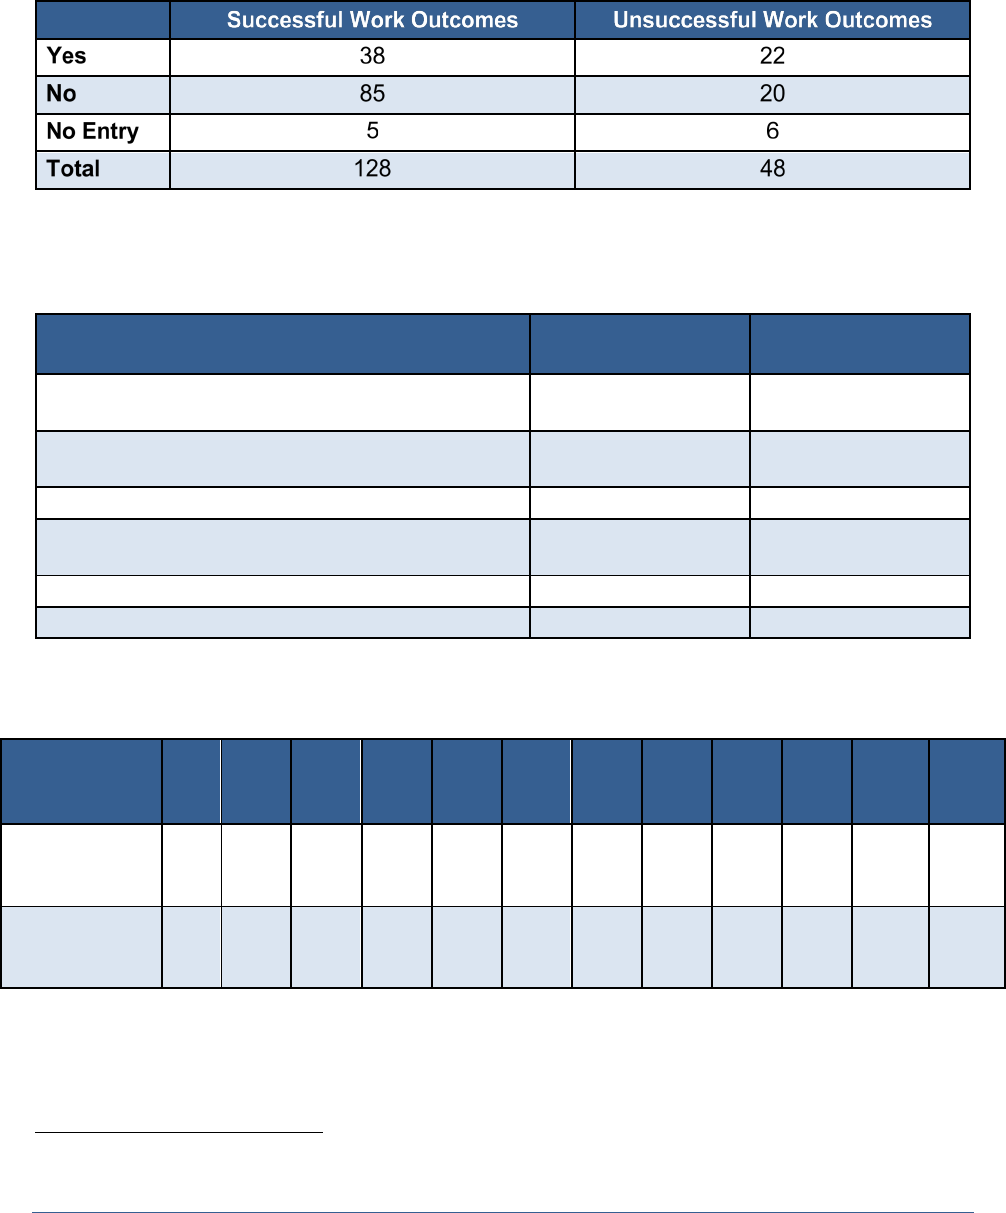
We asked beneficiaries who returned to work after they received VR services whether they
would have been able to do so without those services.
10
More beneficiaries with a successful
outcome attributed their employment outcome to the VR services they received.
Of the 122 beneficiaries with successful outcomes who responded to whether they would have
been able to return to work without the VR services they received, 79 (65 percent) replied no.
Of the 123 beneficiaries who responded to whether they would have been able to work for as
long as they had without VR services, 85 (69 percent) replied no.
Of the 46 beneficiaries with unsuccessful work outcomes who responded to whether they would
have been able to return to work without the VR services they received, 22 (48 percent) replied
no. Of the 42 beneficiaries who responded to whether they would have been able to work for as
long as they had without VR services, 20 (48 percent) replied no.
8
We also analyzed the demographical characteristics of 500 beneficiaries with different work outcomes: 250 with
successful work outcomes and 250 with unsuccessful work outcomes. We did not identify major differences between
beneficiaries who exited VR with successful work outcomes and those who exited with unsuccessful work outcomes
in terms of the type of disabilities, benefit entitlements, or educational level. See Appendix C for the results of our
demographical analysis.
9
Thirty percent of the beneficiaries with unsuccessful work outcomes reported they were not employed and not
looking for jobs when they competed the survey, compared to 3 percent of the beneficiaries with successful work
outcomes.
10
Based on their responses, 128 beneficiaries with successful work outcomes and 48 beneficiaries with unsuccessful
work outcomes indicated they returned to work after they received VR services.

Beneficiaries Who Received Vocational Rehabilitation Services (A-02-18-50544) 5
Individualized Plan for Employment
We asked beneficiaries whether their VR counselor worked with them to develop an IPE, which
spells out, among other things, employment outcomes consistent with the goal of mainstream
employment, the services needed to achieve the employment outcomes, and the timeframes
needed to achieve the employment outcomes. Ninety-one percent of beneficiaries with
successful outcomes reported they had IPEs, and 73 percent of beneficiaries with unsuccessful
work outcomes reported they had IPEs. Beneficiaries with successful work outcomes were
more likely to report that job placement was included in their IPEs (see Figure 1).
Figure 1: Services Included in the IPE
Note: Figures are based on the beneficiaries’ responses to Question 6 of the survey (see Appendix B). Only 224 of
the beneficiaries who responded to a previous question on whether they developed an IPE were asked to respond to
Question 6. Of the 224 possible respondents, 6 did not respond to Question 6. Beneficiaries could provide more
than one response to this question. Therefore, the total may exceed 100 percent.
22
32
65
56
69
54
11
24
35
51
59
60
0 10 20 30 40 50 60 70 80
Some other services
Transportation
Job placement
Vocational and other training services
Counseling, guidance, and referral services
Evaluation of rehabilitation potential
Percentage of Beneficiaries
Unsuccessful Work Outcomes Successful Work Outcomes

Beneficiaries Who Received Vocational Rehabilitation Services (A-02-18-50544) 6
Of those who developed an IPE when they enrolled in VR services, more beneficiaries with
successful work outcomes reported they received all services in their IPEs than those with
unsuccessful outcomes (87 to 73 percent).
Assessment of Vocational Rehabilitation Services Received
The survey asked the beneficiaries which services helped them return to work.
11
Only 137 of
the 148 beneficiaries with successful work outcomes responded to this question, and
73 (53 percent) reported that job placement was helpful.
Additionally, 120 of the 137 beneficiaries with unsuccessful work outcomes responded to the
same question, and 24 (20 percent) reported that job placement was helpful. Furthermore,
35 (29 percent) of the beneficiaries reported none of the VR services received were helpful
because VRs did not provide what was included in the IPE or the counselors did not provide the
help the individuals needed (see Figure 2).
Figure 2: Types of VR Services Beneficiaries Believed Were Helpful
Note: Figures are based on the beneficiaries’ responses to Question 9 of the survey (see Appendix B). Of the
285 possible respondents, 28 did not respond to Question 9. Beneficiaries could provide more than one response to
this Question. Therefore, the total may exceed 100 percent.
11
Beneficiaries could select multiple answers to this Question 6.
5
14
20
53
42
51
29
29
10
15
20
24
29
20
0 10 20 30 40 50 60
None were helpful
Some other services
Transportation
Job placement
Vocational and other training services
Counseling, guidance, and referral services
Evaluation of rehabilitation potential
Percentage of Beneficiaries
Unsuccessful Work Outcomes Successful Work Outcomes

Beneficiaries Who Received Vocational Rehabilitation Services (A-02-18-50544) 7
The survey also asked whether there were other services the beneficiaries did not receive that
would have helped them return to work.
12
Of those who responded yes, more beneficiaries with
unsuccessful work outcomes reported services they did not receive would have helped their
return to work.
13
For example, 48 percent of these beneficiaries reported job placement, which
they did not receive, would have helped them return to work, compared to 18 percent of the
beneficiaries with successful outcomes (see Figure 3).
Figure 3: Types of Services Beneficiaries Did Not Receive But Reported Could Have
Helped
Note: Figures are based on the beneficiaries’ responses to Question 10 of the survey (see Appendix B). Only 85 of
the beneficiaries who responded VR services they did not receive would have helped them return to work were asked
to respond to Question 10. All 85 responded to this question. Beneficiaries could provide more than one response to
this Question. Therefore, the total may exceed 100 percent.
12
Beneficiaries could select multiple answers to this Question 9.
13
Of the 137 beneficiaries with unsuccessful outcomes who responded to our survey, 52 (38 percent) believed VR
services they did not receive would have helped them return to work, compared to 33 of the 148 beneficiaries
(22 percent) with successful work outcomes.
18
39
18
42
21
6
25
37
48
50
31
23
0 10 20 30 40 50 60
Some other services
Transportation
Job placement
Vocational and other training services
Counseling, guidance, and referral services
Evaluation of rehabilitation potential
Percentage of Beneficiaries
Unsuccessful Work Outcomes Successful Work Outcomes

Beneficiaries Who Received Vocational Rehabilitation Services (A-02-18-50544) 8
Reason for Unemployment Since Vocational Rehabilitation
Services
The survey asked why beneficiaries had not worked since they began receiving VR services.
14
Of the beneficiaries with unsuccessful work outcomes,
15
20 percent responded the VR services
received did not prepare them to return to work. Most of the remaining beneficiaries reported
their disabling condition continued preventing them from working (see Figure 4).
Figure 4: Reasons for Unemployment After VR
Note: Figures are based on the beneficiaries’ responses to Question 15 of the survey (see Appendix B). Only 90 of
the beneficiaries who responded to a previous question on whether they did not work since they began receiving VR
services were asked to respond to Question 15. Of the 90 possible respondents, 9 did not respond to Question 15.
Beneficiaries could provide more than one response to this question. Therefore, the total may exceed 100 percent.
14
Beneficiaries could select multiple answers to Question 10.
15
Of the 137 beneficiaries with unsuccessful work outcomes who responded to our survey, 78 responded they had
not worked since they began receiving VR services.
20
10
10
10
50
20
6
4
20
68
0 10 20 30 40 50 60 70 80
I am not employed for other reason
I decided not to get a job
I am able to work but have not been able to find a job
The VR services I received did not prepare me for
returning to work
My disabling condition continues to prevent me from
working
Percentage of Beneficiaries
Unsuccessful Work Outcomes Successful Work Outcomes

Beneficiaries Who Received Vocational Rehabilitation Services (A-02-18-50544) 9
SSA’s Relationship with State Vocational Rehabilitation Agencies
Authorized by Title I of the Rehabilitation Act of 1973, the VR program is administered by the
Rehabilitation Services Administration (RSA), a division of the Department of Education, in
partnership with the States. The
Rehabilitation Act contains the general provisions States
should follow in providing VR services. Each State and territory designates a single VR agency
to administer the VR program, except where State law authorizes a separate agency to
administer VR services for blind individuals.
Recognizing the important role of the VR program, the
Social Security Act authorizes SSA to
pay State VR agencies for the costs of services they provide to disabled beneficiaries if the
services result in the beneficiaries achieving work at a specified earnings level. The following
shows the number and amount of VR payments SSA paid for Fiscal Years 2016 through 2020
(see Table 2).
Table2: Reimbursements SSA Made to State VR Agencies
Fiscal Year
Number of VR
Payments
Amount of VR
Payments
Average Cost Per
VR payment
2020
17,885
$233,102,368
$12,474
2019
14,573
$185,499,507
$12,729
2018
16,237
$215,417,317
$13,267
2017
9,924
$129,576,303
$13,057
2016
11,932
$181,403,973
$15,282
RSA tracks state VR agencies outcomes, including the percentage of clients
16
who have
employment outcomes after receiving VR services. Per the latest RSA data available,
17
State
VR agencies’ client employment outcomes ranged from a high of 72 percent with employment
outcomes after services received to a low of 38 percent. See Appendix D for each State’s
employment outcome.
Earnings for Beneficiaries Who Did and Did Not Receive
Vocational Rehabilitative Services
As noted earlier in this report, the beneficiaries with a successful outcome we surveyed were
more likely to attribute their employment outcome to the VR services they received. To further
determine whether VR services increased beneficiary employment outcomes, we compared
SGA-level earnings beneficiaries earned after becoming disabled for beneficiaries who received
VR services and those who did not.
More specifically, we compared 2019 and 2020 earnings for the 2,483 beneficiaries in our audit
population who became entitled to disability benefits in 2018 to 599,735 beneficiaries who
16
SSA beneficiaries are a portion of State VR agencies’ client base.
17
FY 2016 is the latest data publicly available.

Beneficiaries Who Received Vocational Rehabilitation Services (A-02-18-50544) 10
became entitled to disability benefits in 2018 and did not use VR services. The beneficiaries
who received VR services had higher levels of SGA-level earnings (see Table 2).
Table 3: SGA Earnings for Beneficiaries Who Did and Did Not Receive VR Services
SGA Earnings Level
Percent of
Beneficiaries
Who Received
VR Services
Percent of
Beneficiaries
Who Did Not
Receive VR
Services
2019 Earnings Exceeding 9 Times SGA
12.9
3.8
2019 Earnings Exceeding 12 Times SGA
7.2
2.5
2020 Earnings Exceeding 9 Times SGA
11.3
3.0
2020 Earnings Exceeding 12 Times SGA
7.8
2.1
RECOMMENDATION
We recommended SSA inform State VR agencies about the results of our survey, especially the
survey responses that suggest that VR services were not fully effective in assisting beneficiaries
and recipients to gainful employment.
AGENCY COMMENTS
SSA agreed with our recommendation. See Appendix E for the full text of SSA’s comments.
Mic
helle L. Anderson
Assistant Inspector General for Audit

Beneficiaries Who Received Vocational Rehabilitation Services (A-02-18-50544)
APPENDICES

Beneficiaries Who Received Vocational Rehabilitation Services (A-02-18-50544) A-1
– SCOPE AND METHODOLOGY
To accomplish our objectives, we:
Reviewed the applicable sections of the Social Security Act and Social Security
Administration’s (SSA) Program Operations Manual System.
Reviewed prior Office of the Inspector General reports on Vocational Rehabilitation (VR)
services.
Identified from the Disability Control File (DCF), 20,478 beneficiaries who exited State VR
agencies with recorded outcomes from March through May 2019 and who had not re-
enrolled with a State VR agency after they exited as of the time of our data selection. Of
these, 7,876 had successful outcomes, meaning they worked at the substantial gainful
activity (SGA) level for 9 continuous months or longer, and 12,602 had unsuccessful
outcomes, meaning they did not work at the SGA level for 9 continuous months.
Randomly selected and reviewed records of 250 of the 7,876 beneficiaries with successful
outcomes and 250 of the 12,602 beneficiaries with unsuccessful outcomes.
Obtained information on the 500 beneficiaries’ gender, age, impairments, benefit
entitlements, education, VR agency location, and earnings after their exit from VR from the
Master Beneficiary Record, the Supplemental Security Record, Numident, DCF and eView.
Identified from the Master Beneficiary Record, Supplemental Security Record, and Disability
Analysis File, 599,735 beneficiaries who became entitled to disability benefits in 2018 and
did not use VR services and 2,483 beneficiaries who became entitled to disability benefits in
2018 and used VR services. We extracted earnings from the Master Earnings File for these
beneficiaries from 2019 to 2020 to determine whether they had earnings above the SGA
level.
Obtained from the Department of Education’s Rehabilitation Services Administration, the
latest available data on State employment outcomes by State VR agency.
To determine whether the beneficiaries attribute their work outcomes to the VR services they
received, we took the following steps.
Reviewed SSA records of the beneficiaries.
Shared our draft survey with SSA and incorporated its comments.
Mailed up to three surveys to the beneficiaries or their representative payees that consisted
of a series of questions regarding their State VR experience.
Contacted the beneficiaries or their representative payees, as needed, to verify incomplete
responses.
We determined the computer-processed data were sufficiently reliable for our intended use.
We conducted tests to determine the completeness and accuracy of the data. These tests
allowed us to assess the reliability of the data and achieve our audit objective.

Beneficiaries Who Received Vocational Rehabilitation Services (A-02-18-50544) A-2
We conducted our audit work in the New York Audit Division between September 2019 and
February 2021. The entity audited was the Office of Operations under the Office of the Deputy
Commissioner for Operations.
We assessed the significance of internal controls necessary to satisfy the audit objective. This
included an assessment of the five internal control components, including control environment,
risk assessment, control activities, information and communication, and monitoring. In addition,
we reviewed the principles of internal controls as associated with the audit objective. We
identified the following five components and seven principles as significant to the audit
objective.
Component 1: Control Environment
Principle 5: Enforce Accountability
Component 2: Risk Assessment
Principle 9: Identify, Analyze, and Respond to Change
Component 3: Control Activities
Principle 10: Design Control Activities
Principle 12: Implement Control Activities
Component 4: Information and Communication
Principle 14: Communicate Internally
Principle 15: Communicate Externally
Component 5: Monitoring
Principle 16: Perform Monitoring Activities
We conducted this performance audit in accordance with generally accepted government
auditing standards. Those standards require that we plan and conduct the audit to obtain
sufficient, appropriate evidence to provide a reasonable basis for our findings and conclusions
based on our audit objective. We believe the evidence obtained provides a reasonable basis for
our findings and conclusions based on our audit objective.

Beneficiaries Who Received Vocational Rehabilitation Services (A-02-18-50544) B-1
– SURVEY RESPONSES
Yes 72 67
No
72 65
No Entry
4 5
Total 148 137
Successful Work
Outcomes
Unsuccessful
Work Outcomes
I was unable to find a job.
23
20
I found a job but was unable to work
consistent hours because of my disability.
20
28
I found a job but decided to enroll in a VR
program to better prepare for my return to the
work force.
16
5
Something else happened.
13
14
Total
72
67
Successful
Work
Outcomes
Unsuccessful
Work
Outcomes
From Social Security personnel (Skip to Question
4)
39
30
From another place/person (Please name the
place/person below and then skip to Question 5)
105
101
No Entry
4
6
Total
148
137

Beneficiaries Who Received Vocational Rehabilitation Services (A-02-18-50544) B-2
Successful Work
Outcomes
Unsuccessful
Work Outcomes
My local Social Security office
30
19
A Social Security Publication
5
8
Social Security’s Websites (SSA.gov or
socialsecurity.gov)
4
1
Other Social Security sources
0
1
No Entry
0
1
Total
39
30
Successful Work
Outcomes
Unsuccessful
Work Outcomes
Evaluation of rehabilitation potential
69
54
Counseling, guidance, and referral
services
87
54
Vocational and other training services
71
46
Job placement
83
31
Transportation
41
22
Some other services
28
10
No Entry
3
3
1
Beneficiary might select more than one service for this question.

Beneficiaries Who Received Vocational Rehabilitation Services (A-02-18-50544) B-3
7. Did you receive all of the services included in your plan for employment? (If you answered
yes, skip to Question 9. If no, continue to Question 8.)
8. Why did you not receive all of the services included in your plan for employment?
Successful
Work
Outcomes
Unsuccessful
Work
Outcomes
I found a job before I was able to complete my plan
for employment
5
4
My health condition worsened
3
7
I decided not to get a job, so I did not think I
needed to complete my plan for employment
0
0
I did not receive all of the services for other
reasons
7
11
No entry
1
2
Total
16
24

Beneficiaries Who Received Vocational Rehabilitation Services (A-02-18-50544) B-4
9. What VR services were most helpful in preparing for your return to work? (Check all that
apply)
2
Successful Work
Outcomes
Unsuccessful
Work Outcomes
Evaluation of rehabilitation potential
40
24
Counseling, guidance, and referral
services
70
35
Vocational and other training services
58
29
Job placement
73
24
Transportation
28
18
Some other services
19
12
None were helpful
7
35
No Entry
11
17
Please briefly explain how these services helped you?
10. Would other services you did not receive have helped your return to work?
3
If yes, which services?
Successful Work
Outcomes
Unsuccessful
Work Outcomes
Evaluation of rehabilitation potential
2
12
Counseling, guidance, and referral
services
7
16
Vocational and other training services
14
26
Job placement
6
25
Transportation
13
19
Some other services
6
13
2
Beneficiary might select more than one service for this question.
3
Beneficiary might select more than one service for this question.

Beneficiaries Who Received Vocational Rehabilitation Services (A-02-18-50544) B-5
11. Have you worked since you began receiving VR services? (If yes, continue to Question 12,
if no skip to Question 15.)
12. What is your current job status?
Successful Work
Outcomes
Unsuccessful Work
Outcomes
Employed full-time
12
3
Employed part-time
96
21
Self-employed
3
2
Not employed now, but looking for a job
11
4
Not employed now and not looking for a
job at the moment
4
14
Working in other capacity
1
3
No entry
1
1
Total
128
48
13. Would you have been able to return to work without the VR services you received?
Please further explain why you answered Yes or No.
Beneficiaries Who Received Vocational Rehabilitation Services (A-02-18-50544) B-6
14. Would you have been able to work as long as you have without the VR services you
received? (Skip to Question 16)
Please further explain why you answered Yes or No.
15. Why have you not worked since you left the VR program?
4
Successful Work
Outcomes
Unsuccessful
Work Outcomes
My disabling condition continues to prevent
me from working
5
The VR services I received did not prepare
me for returning to work
1
14
I decided not to get a job
1
4
I am able to work but have not been able to
find a job
1
3
I am not employed for other reason
2
14
No entry
2
7
16. On a scale from 1 to 10, where 1 is “it did not help me at all” and 10 is “it helped me greatly,”
how much did the VR services you received help you in your efforts to return to work?
1 2 3 4 5 6 7 8 9 10 No
Entr
y
Total
Successful
Work
Outcomes
9
4
8
2
9
8
13
14
15
62
4
148
Unsuccessfu
l Work
Outcomes
28
16
8
9
14
13
5
7
9
13
15
137
4
Beneficiary might select more than one reasons for this question.

Beneficiaries Who Received Vocational Rehabilitation Services (A-02-18-50544) B-7
17. Please provide any additional comments you may have.
Summary Successful Work
Outcomes
Unsuccessful
Work Outcomes
Positive comments regarding VR
experience
36
12
Negative comments regarding VR
experience
21
39
Miscellaneous comments
13
22
No comments
78
64
Total
148
137

Beneficiaries Who Received Vocational Rehabilitation Services (A-02-18-50544) C-1
– BENEFICIARY DEMOGRAPHICS
We analyzed the demographical characteristics of 500 beneficiaries with different work
outcomes: 250 with successful work outcomes and 250 with unsuccessful work outcomes. We
did not identify major differences between beneficiaries who exited Vocational Rehabilitation
(VR) with successful work outcomes and those who exited with unsuccessful work outcomes in
terms of the type of disabilities, benefit entitlements, or educational level. Between the two
population groups, the ratio of males to females was higher in the group with successful
outcomes (60 percent compared to 40 percent) than in the group with unsuccessful outcomes
(55 percent compared to 45 percent). Additionally, the group with the successful outcomes has
a slightly younger average age of 39.9 years old, compared to 41.4 for beneficiaries with
unsuccessful outcomes.
Gender
Both populations had more males than females. However, the discrepancy is higher for the
successful outcome group, with a 20-percent point difference compared to a 10-percent point
difference for those with unsuccessful outcomes.
Table C–1: Gender
Gender Population
Percent in
Population
Successful
Work
Outcomes
Percent in
Successful Work
Outcomes
Population
Unsuccessful
Work
Outcomes
Percent in
Unsuccessful
Work Outcomes
Population
Male
288
58%
151
60%
137
55%
Female
212
42%
99
40%
113
45%

Beneficiaries Who Received Vocational Rehabilitation Services (A-02-18-50544) C-2
Age
The average age of beneficiaries with successful outcomes was slightly younger, at 39.9 years
old,
1
compared to 41.4 for beneficiaries with unsuccessful outcomes.
2
See the following for the
percentage of beneficiaries in each age group.
Table C–2: Age
Age
Group
Population
Percent in
Population
3
Successful
Work
Outcomes
Percent in
Successful
Work Outcomes
Population
Unsuccessful
Work
Outcomes
Percent in
Unsuccessful
Work Outcomes
Population
61 to 70
65
13%
32
13%
33
13%
51 to 60
92
18%
41
16%
51
20%
41 to 50
64
13%
32
13%
32
13%
31 to 40
114
23%
62
25%
52
21%
20 to 30
165
33%
83
33%
82
33%
Types of Disabilities
When we considered the types of disabilities
4
on work outcomes, we found that most
beneficiaries in both populations had mental impairments. We also identified more beneficiaries
with physical impartments in the unsuccessful outcome group and more beneficiaries with vision
or hearing impairments in the successful outcomes group.
Table C–3: Types of Disabilities
Type of
Disabilities
Population
Percentage
in
Population
5
Successful
Work
Outcomes
Percentage
in Successful
Work
Outcomes
Population
6
Unsuccessful
Work
Outcomes
Percentage in
Unsuccessful
Work
Outcomes
Population
7
Mental
301
60%
148
59%
153
61%
Physical
152
30%
71
28%
81
32%
Hearing/Vision
47
9%
31
12%
16
6%
1
The age of the beneficiaries in this group ranged from 21 to 67, with a median age of 37.
2
The age of the beneficiaries in this group ranged from 20 to 68, with a median age of 39.
3
The total percentage exceeds 100 percent because of rounding.
4
We obtained the disability information based on the disability diagnostic code found in the Master Beneficiary
Record and/or the Supplemental Security Record. Some beneficiaries have a primary and a secondary disability
diagnostic code. We used the primary diagnostic code to determine the type of disability.
5
The total percentage do not add to 100 percent because of rounding.
6
The total percentage do not add to 100 percent because of rounding.
7
The total percentage do not add to 100 percent because of rounding.

Beneficiaries Who Received Vocational Rehabilitation Services (A-02-18-50544) C-3
Benefit Entitlement
We identified a higher percentage of OASDI beneficiaries with successful outcomes (50
percent) than those in the unsuccessful outcomes groups (45 percent).
Table C–4: Benefit Entitlement
Benefit
Entitlement
Population
Percentage
in
Population
Successful
Work
Outcomes
Percent in
Successful
Work
Outcomes
Population
Unsuccessfu
l Work
Outcomes
Percent in
Unsuccessful
Work
Outcomes
Population
Old-Age,
Survivors and
Disability
Insurance
238 48% 125 50% 113 45%
Supplemental
Security Income
193 39% 94 38% 99 40%
Concurrent
69
14%
31
12%
38
15%
Educational
Table C–5: Education
Educational
Level
Population
Percentage
in
Population
Successful
Work
Outcomes
Percentage in
Successful
Work
Outcomes
Population
8
Unsuccessful
Work
Outcomes
Percentage in
Unsuccessful
Work Outcomes
Population
College
37
7%
22
9%
15
6%
Special
Education
Certificate
3 1% 3 1% 0 0%
Some
College
68 14% 31 12% 37 15%
High School
Graduate
162 32% 78 31% 84 34%
Some High
School
112 22% 56 22% 56 22%
Middle
School
13 3% 7 3% 6 2%
Unknown
105
21%
53
21%
52
21%
8
The total percentages do not add to 100 percent because of rounding.

Beneficiaries Who Received Vocational Rehabilitation Services (A-02-18-50544) D-1
– STATE VOCATIONAL REHABILITATION
AGENCY ANALYSIS
Table D–1: Percent with Successful Outcomes After VR Services
AR
71.8
62.9
1
ND
69.6
42.9
18
NE
68.1
25.0
39
AL
67.6
53.4
3
MS
65.2
18.5
43
GA
65.0
14.3
45
OR
64.9
53.3
4
WA
64.3
52.5
5
TX
63.9
46.6
9
CO
62.7
49.2
7
DE
62.4
N/A
N/A
RI
61.5
56.6
2
NJ
61.2
49.3
6
MD
60.8
29.0
35
MN
60.0
46.3
10
SC
59.8
39.7
23
MI
59.6
34.3
30
SD
59.5
0.0
47
NH
58.9
43.8
17
TN
58.4
20
45.4
12
CA
58.0
21
31.4
32

Beneficiaries Who Received Vocational Rehabilitation Services (A-02-18-50544) D-2
ID
57.8
22
28.5
37
NY
57.5
23
30.8
33
CT
57.5
24
35.3
28
WY
56.9
25
49.1
8
PA
56.1
26
38.3
26
WI
55.1
27
42.3
19
IN
55.0
28
34.7
29
MA
54.9
29
38.0
27
VT
54.5
30
N/A
N/A
WV
54.4
31
0.0
48
AK
54.3
32
45.1
14
NC
54.0
33
28.8
36
OK
53.8
34
23.3
40
IA
52.6
35
2.3
46
HI
52.2
36
20.8
42
VA
52.1
37
40.2
22
KY
50.6
38
38.9
25
IL
50.4
39
39.3
24
OH
50.2
40
41.1
21
NV
49.8
41
22.4
41
UT
49.4
42
44.4
15
LA
48.9
43
45.3
13
KS
46.7
44
44.0
16
ME
46.6
45
25.0
38
AZ
42.0
46
33.0
31
DC
41.0
47
17.1
44
FL
40.8
48
41.9
20
MT
38.9
49
N/A
N/A
MO
38.9
50
46.2
11
NM
37.7
51
29.8
34

Beneficiaries Who Received Vocational Rehabilitation Services (A-02-18-50544) E-1
– AGENCY COMMENTS
SOCIAL SECURITY
MEMORANDUM
Date:
September 29, 2021 Refer To:
TQA-1
To:
Gail S. Ennis
Inspector General
From:
Scott Frey
Chief of Staff
Subject:
Office of the Inspector General Draft Report "Beneficiaries Who Received Vocational
Rehabilitation Services" (A-02-18-50544) — INFORMATION
Thank you for the opportunity to review the draft report. We agree with the recommendation.
Please let me know if I can be of further assistance. You may direct staff inquiries to
Trae Sommer at (410) 965-9102.

Mission: The Social Security Office of the Inspector General (OIG) serves the
public through independent oversight of SSA’s programs and operations.
Report: Social Security-related scams and Social Security fraud, waste, abuse,
and mismanagement, at oig.ssa.gov/report
.
Connect: OIG.SSA.GOV
Visit our website to read about our audits, investigations, fraud alerts,
news releases, whistleblower protection information, and more.
Follow us on social media via these external links:
Twitter: @TheSSAOIG
Facebook: OIGSSA
YouTube: TheSSAOIG
Subscribe to email updates on our website.
