
D
IAGRAMMING
:
A
USG
IT
H
ANDBOOK
COMPANION GUIDE
VERSION 1.0
9/22/2020
P
UBLIC
Abstract: This companion guide is developed to aid USG organization’s cybersecurity professionals
concerning addressing the need to provide logical, physical and data flow diagramming in support of
engineering and/or architecting solutions to meet regulatory and USG requirements.

Public Page | 2 Public
Revision & Sign-off
Change Record
Date
Author
Version
Change Reference
20200805
Alfred Barker
1.0
Reviewed for Harmful Language.
Document Properties
Item
Details
Document Title
Diagramming: A USG IT Handbook Companion Guide
Document Type
Guideline (Internal Use Only)
Author
Alfred Barker
Document Manager
Alfred Barker
Creation Date
20200224
Last Updated
2020805
Document Classification
Public

Public Page | 3 Public
Introduction
The DIAGRAMMING: A USG IT HANDBOOK COMPANION GUIDE is developed to aid USG organization’s
information technology and cybersecurity professionals addressing the need to provide logical, physical
and data flow diagramming in support of engineering and/or architecting solutions to meet regulatory
requirements. Although this document’s focus is not enterprise architecture (Figure 1), it does support
the various views an architectural drawing would introduce. For example, the physical network
engineering diagrams provide support of the technical architecture; the logical network diagrams
support the information architecture; and the data flow diagrams support the business architecture.
Each layer providing a unique view into the enterprise.
Figure 1: Enterprise Architecture Example
Furthermore, in an effort to mature the USG IT Handbook by incorporating National Institute of
Standards and Technology (NIST) cybersecurity and privacy frameworks, diagramming has become a
principle requirement as defined in Sections 5.1.2 and 5.1.3. Beyond requirements, diagramming
provides the foundational supporting documentation (blue-print) for contingency planning, which is
integral to a mature and executable continuity of operations documentation.
As with all of our documents, they are dynamic and works in progress. If you discover an error or have
an additional standard or regulation that the community would benefit from mapping, please submit
your comment to cy[email protected]du
for correction or consideration.

Public Page | 4 Public
Diagramming
Easily the most useful – yet often most neglected – form of network documentation is the network
diagram. With it, planners, managers and auditors have access to a visual and textual map of the
network that can prove invaluable in a variety of situations including: troubleshooting, adds/changes
and future roadmap planning.
Common pitfalls when creating network diagrams include:
• Lacking a formal engineer/architect program (e.g., systems, network, database and
cybersecurity);
• Lacking agreements between network engineers/architects as to the overall layout;
• Failing to understand the target audience or regulatory requirements (e.g., internal and state
audit, business continuity);
• Missing or poorly managed network diagram documentation; and
• Maintaining revision information when the diagram is updated (e.g., the name of the person
who made the change, the date the document was last updated, a revision numbering scheme
that can show if the update was a cosmetic, minor or major add/change to the previous
document).
Regulatory Impact
Beyond the operational benefit from network and data flow diagrams, legislative and regulatory
mandates influence the need to create and maintain auditable diagrams. For example, network
documentation is extremely valuable to a Payment Card Industry Data Security Standard (PCI DSS)
assessor; so valuable in fact that is one of the first requirements listed in the PCI DSS. For example,
requirement 1.1.2 in the PCI DSS requires the assessor to validate that a current network diagram with
all connections to cardholder data, including any wireless networks, be available. The assessor is also
charged with ensuring that a process is in place to keep the diagram current. Beyond PCI DSS, from the
perspective of disaster recovery, a network diagram is a requirement of disaster recovery plans (DRP)
expressed in the following:
• Gramm-Leach-Bliley Act (GLBA) 16 CFR 314
• Federal Information Systems Modernization Act (FISMA)
• Health Insurance Portability and Accountability Act (HIPAA)
• Federal Financial Institutions Examination Council (FFIEC banking/finance)
• National Institute of Standards and Technology (NIST)
o SP 800-53 Rev 4 - Security and Privacy Controls
o SP 800-34 Rev 1 - Contingency Planning Guide
o Cybersecurity Framework (CSF)
o Privacy Framework (PF)
• And many privacy directives.
Responsibilities
Network Diagram
USG organizations shall maintain high-level diagrams showing wide-area network (WAN) topology, as
well as detailed local area network (LAN) diagrams showing configurations for each location and
Public Page | 5 Public
provided to the organization’s cybersecurity professional. Diagrams should utilize standard naming
conventions and iconology. WAN diagrams must state the connection type (e.g., DSL, T1, T3, ATM, etc.)
as well as bandwidth constraints (e.g., 256k/512k, 1MB, etc.) Servers and routers should follow naming
protocols established in the network devices security standards. All local-area network (LAN) diagrams
should include the IP addresses of all significant network devices and servers. Workstations can be
grouped in one icon expressing IP address ranges if appropriate. Diagrams should include effective date,
author, name of network, distribution list, etc.
Data Flow Diagrams
Data flow diagrams shall be maintained by the functional data administrator and provided to the
organization’s cybersecurity professional. As data flow drawings should be explained as a means of
understanding, those receiving data flow diagrams will participate in a meeting where the cybersecurity
professional shall explain the drawings. The data governance committee meeting minutes shall reflect,
for example, the review of the data flow diagrams. The review of the data flow diagram will be
conducted in an environment where the review can be recorded. Diagrams should include effective
date, author, system being diagrammed, distribution list, etc.
Updating Schedule
Network diagrams should be reviewed annually, updated and distributed whenever major modifications
are made. System inventories should be reviewed biannually and updated whenever major acquisitions
are made. The file structure documentation should be updated as new restricted root-directories are
created. Data flow diagrams shall be reviewed annually and updated whenever a new change, product,
service, application, process or vendor has created major change in data flow.
Figure 2: Local Area Network

Public Page | 6 Public
Defining the Diagram(s)
Diagrams are visual representations of a computer, telecommunications network or data-flow. Network
diagrams of a local area network (LAN) seen in Figure 2, for example, show components of a network
and how they interact, including routers, switches, firewalls, endpoints, etc. Whereas, data-flow
diagrams map out the flow of information for any process or system. Depending on its scope and
purpose, diagrams may contain a lot of detail or just provide a broad overview.
Logical network diagrams
A logical network diagram describes the way information flows through a network. Therefore, logical
network diagrams typically show subnets (including virtual local area networks (VLAN) IDs, subnet-
masks, and IP addresses), network devices like routers and firewalls, and routing protocols. In the Open
Systems Interconnection (OSI) model, logical network diagrams correlate with the information
contained in layer 3 (L3). Also known as the “network layer,” L3 is an abstraction layer that deals with
packet forwarding through intermediate routers. Level 2 shows the data links between adjacent nodes,
while level 1 shows the purely physical layout.
Physical network diagrams
A physical network diagram shows the actual physical arrangement of the components that make up the
network including cables and hardware. Typically, the diagram gives a bird’s eye view of the network in
its physical space, like a floorplan. With their capacity for showing how network components interact,
network diagrams can serve a variety of purposes. Network diagrams can be used to represent virtually
any network, which means that there’s a lot of variety.
Figure 3: Data Flow Diagram

Public Page | 7 Public
System Data Flow Diagram
A data flow diagram (DFD) maps out the flow of information for any process or system. It uses defined
symbols like rectangles, circles and arrows, plus short text labels, to show data inputs, outputs, storage
points and the routes between each destination. Data flow charts like Figure 3 can range from simple,
even hand-drawn process overviews, to in-depth, multi-level DFDs that dig progressively deeper into
how the data is handled. They can be used to analyze an existing system or model a new one. Like all the
best diagrams and charts, a DFD can often visually “say” things that would be hard to explain in words,
and they work for both technical and nontechnical audiences, from developer to CEO.
Examples of data flow diagrams are:
• E-communications: email, secure messaging, instant messaging
• On-boarding: new accounts process
• Compliance Data Processing: privacy protected data flow
• Any process or procedure…
Designing Network Diagrams
As stated earlier, begin with Layer 3, which show the IP subnets and all Layer 3 network devices like
routers, firewalls, and load balancers. The Layer 3 diagram must show all of the important network
segments and subnets and how they’re interconnected.
Network diagramming rules and tips:
• Layout is important and should represent the flow of traffic in a broad sense. Another layout
consideration is to always draw your network segments either horizontally or vertically.
• The Layer 3 diagram should show any high availability mechanisms and redundant network
components or redundant paths. It’s customary to show router redundancy protocols as an
elongated ellipse that covers the router links included in the high availability group.
• The other important thing about Layer 3 diagrams is that they should only include Layer 3
objects. You can show a switch on a Layer 3 diagram only if it’s a Layer 3 switch, and then only
because it functions as a router.
• Another useful thing to put into a Layer 3 diagram is organizational boxes. If there are security
zones or interesting groupings of users by function or servers by application, put them together
on the picture, put a box around them, and label the box clearly. It’s then easy to see the exact
network path those users take to reach their servers.
• In more complicated network designs, use a base Layer 3 diagram showing the VLANs, routers,
and firewalls. Then I create several other diagrams to lay over the base diagram.
Network documentation is extremely valuable, so valuable in fact that is one of the first requirements
listed in the Payment Card Industry Data Security Standard (PCI DSS). For example, documenting card
data flows on top of the network diagram can serve to be invaluable. Diagrams are designed with
varying levels of detail, which are:
• Level 0 diagram (context level) – shows complete systems, inputs and outputs from/to external
factors. This is the level chosen to diagram third-party (vendor) relationships in support of
GLBA’s “Safeguard Rules” .
• Level 1 diagram – Illustrates primary processes, data stores and linked destinations.
Public Page | 8 Public
• Level 2 diagram – expansion of detail in level 1 diagram.
The following are some simple examples of possible level 0, level 1 and level 2 diagrams.
Level 0 Diagram
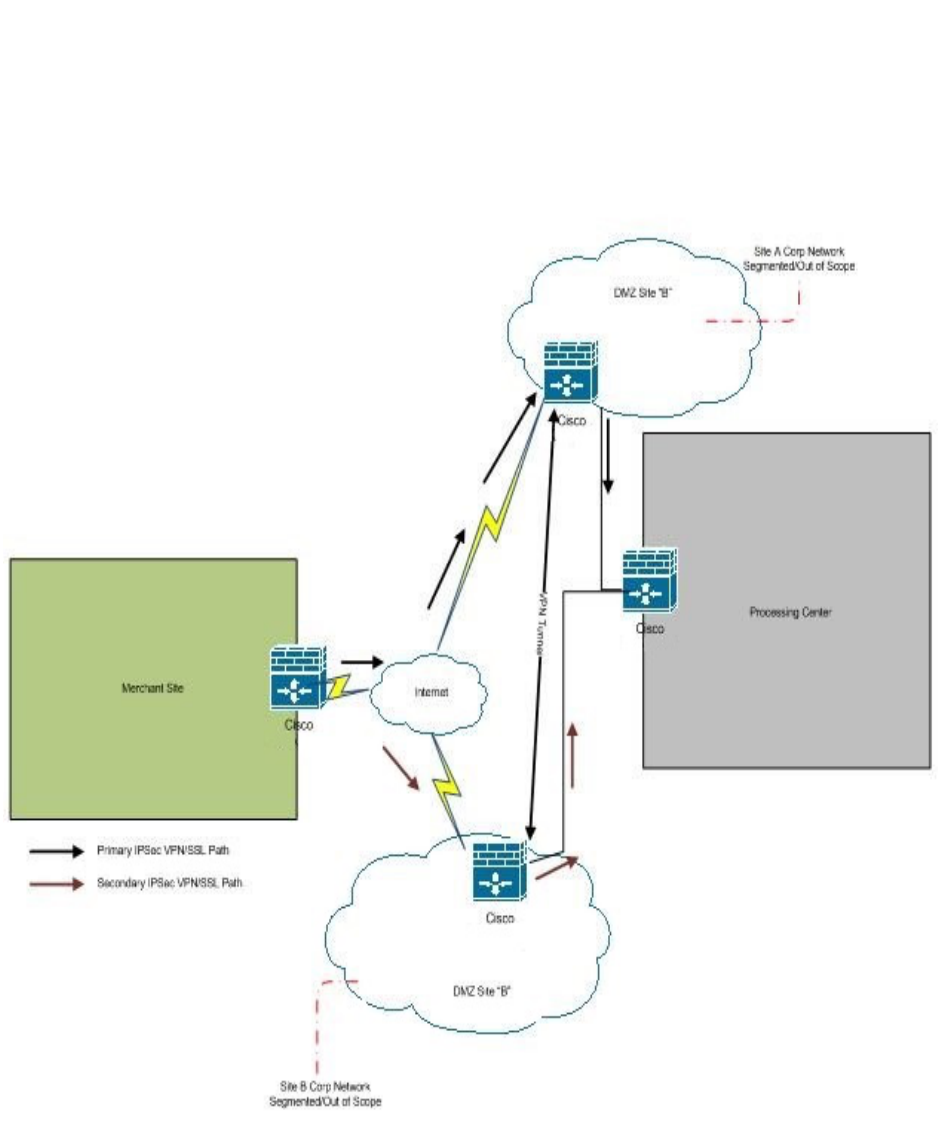
The diagram in Figure 4 identifies key locations on the network and the arrows highlight the expected
flow of data (the example provided is card data processing).
Figure 4: Level 0 Diagram
In a GLBA or PCI DSS assessment scenario for example, this level of diagram helps to identify and narrow
the key locations that should be the focus or scope of the assessment; however, it does not provide
much insight into the number of devices or logical layout of the physical sites.

Public Page | 9 Public
Level 1 Diagram
The diagram in Figure 5 indicates primary connection points and devices in the data flow.
Figure 5: Level 1 Diagram
This diagram expands the level 0 diagram and highlights the key components at each physical location as
well as a view into the logical layout within each physical location. USG organizations may choose to
include additional detail like hostnames and IP addresses of network devices. Depending on the
complexity of your network, this level of diagram may satisfy auditor or assessor.
Level 2 Diagram
The diagram in Figure 6 could be created for each physical site by expanding the level of detail to all
network components and devices including the telecom room, demarcation points, network cabling,
workstations and following the example of PCI DSS - point-of-sales (POS) terminals.

Public Page | 10 Public
Figure 6: Level 3 Diagram
This diagram expands the level 1 diagram and highlights devices and the logical layout within the
merchant store location. Some diagrams can be very creative and even be documented on top of a floor
map.
Designing Layer 3 Diagrams
In review, levels are degrees of information, where layers are OSI specific. To be able to draw a logical
layer 3 network diagram, you should know exactly what information is presented, for example:
• Subnets
o Names
o VLAN IDs
o Network address and subnet mask
• L3 Devices
o At least routers, firewalls, VPN devices
o Most important servers (Front-end, back-end and infrastructure servers… etc.)
o Server IP addresses

Public Page | 11 Public
o Logical interfaces
• Routing protocol information
The following information should not be presented in L3 diagrams because it really belongs to another
layer, and therefore should be presented in that level’s documentation:
• Basically all L2 and L1 information
• L2 switches (Only the management interface should be presented)
• Physical connections
Creating Network Diagram
1. Identify the equipment. At first, don’t worry about connections. Instead, just list all the
workstations, servers, routers, firewalls, and other components that are part of the network. If
you’re using network diagramming software, you can accomplish this by simply dragging shapes
onto the canvas.
2. Group the shapes. To begin arranging your diagram, move related shapes closer to one another.
Shapes may be related either logically or physically, depending on what kind of diagram you’re
drawing.
3. Add connections. A line between two shapes shows that they are connected, typically by the
flow of information.
4. Label. Include any additional information (Figure 7).
a. Don’t forget a diagram key: Since there is no agreed upon industry standard when
creating a network diagram, the use of lines, circles, and clouds can vary widely from
one organization’s diagram to the next. It’s absolutely critical that a diagram key be put
in place to explain what the various lines, colors and shapes are meant to represent.
b. Data Classification of diagrams should be indicated as “Sensitive.”
Figure 7: Diagramming Label
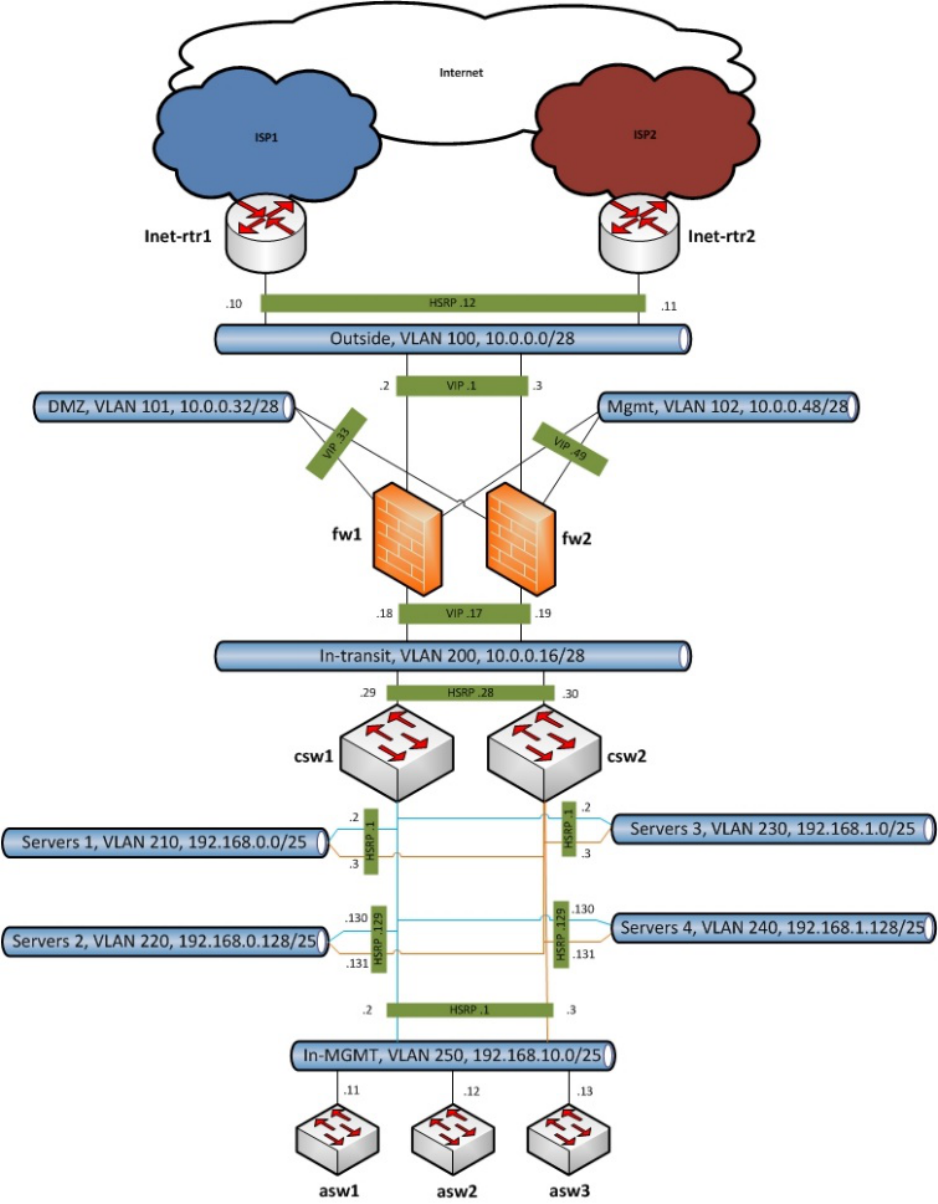
5. Final formatting. Adjust the placement, size, color, and other diagram attributes or elements
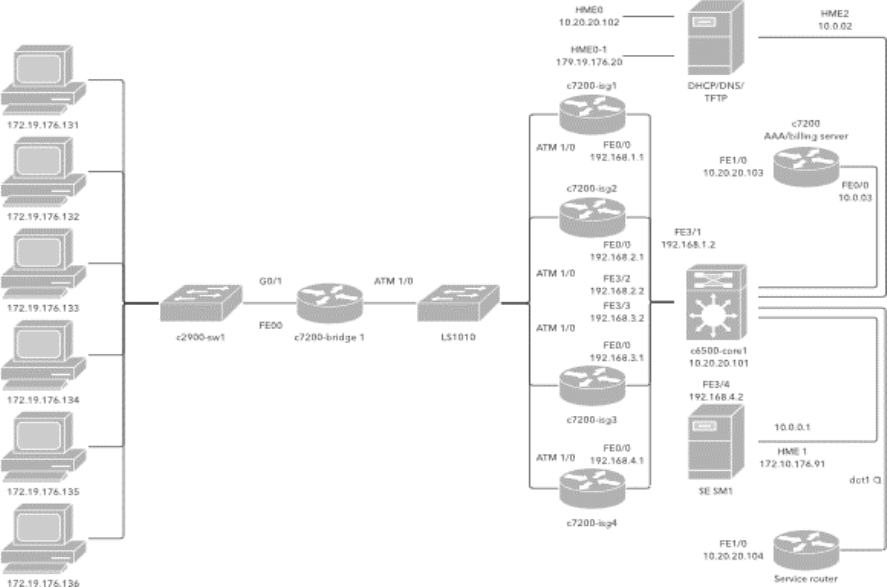
until satisfied. Figure 8 is an example of a layer 3 (level 1) network diagram; whereas, Figure 9 is
an example of a layer 3 (level 2) network diagram.
LOGO
Title:
Data Classification: SENSITIVE
Revisions:
Institution:
Drawn By:
Date:
Revision:
Approved By:
Sheet # ________ of __________
Public Page | 12 Public
Figure 8: Layer 3 Diagram (Level 1)

Public Page | 13 Public
Figure 9: Layer 3 Diagram (Level 2)

Public Page | 14 Public
Designing Data Flow Diagrams
The purpose of a DFD is to show the scope and data flow boundaries of a system as a whole. It may be
used as a communications tool between a systems analyst and any person who plays a part in the
system that acts as the starting point for redesigning a system. It is usually beginning with a context
diagram as the level 0 of DFD, a simple representation of the whole system. To elaborate further from
that, we drill down to a level 1 diagram with lower level functions decomposed from the major functions
of the system. This could continue to evolve to become a level 2 diagram when further analysis is
required. Please bear in mind that the level of details for decomposing particular function really
depending on the complexity that function.
Figure 10: Context-Level Diagram

Public Page | 15 Public
The context diagram in Figure 10 provides an overview and it is the highest level in a data flow diagram,
containing only one process representing the entire system. It should be split into major processes
which give greater detail and each major process may further split to give more detail.
DFD Context-Level Diagram rules and tips:
• Each process should have at least one input and an output and each data store should have at
least one data flow in and one data flow out.
• Data stored in a system must go through a process and all processes in a DFD must go to
another process or a data store.
• The context diagram must fit in one page with no cross lines.
• The process name in the context diagram should be the name of the information system, and
each set of symbols must use a unique name.
Diagram Notations
Elements within the simplified DFD in Figure 11 will be used to define diagram notations.
Figure 11: Diagram Notation
External Entity - An external entity is a person, department, outside organization or
other information system that provides data to the system or receives outputs from
the system. External entities are components outside of the boundaries of the
information systems. They represent how the information system interacts with the
outside world. They are a rectangle that either supply data or receive data but do not process data.
External entities also are called terminators because they are data origins or final destinations. An
external entity must be connected to a process through a data-flow.
Process - A rounded rectangle represents a process. A process is a business activity
or function where the manipulation and transformation of data takes place. A
process can be decomposed to finer level of details, for representing how data is
being processed within the process. Every process has a name that identifies the
function it performs consisting of a verb, followed by a singular noun (e.g., Apply Payment, Calculate
Commission, Verify Order).
Data Store - A data store or data repository is used in a data-flow diagram to
represent a situation when the system must retain data because one or more
processes need to use the stored data in a later time. Data can be written into the
data store, which is depicted by an outgoing arrow and/or read from a data store,
which is depicted by an incoming arrow. Data stores must be connected to a process with a data-flow
and each data store must have at least one input data-flow and at least one output data-flow (even if
the output data-flow is a control or confirmation message).

Public Page | 16 Public
Data Flow - A data-flow is a path for data to move from one part of the information
system to another. A data-flow may represent a single data element such the
Customer ID or it can represent a set of data element (or a data structure) such as:
Customer_info (LastName, FirstName, SS#, Tel #, etc.).
Rule of Data Flow - One of the rules for developing DFD is that all flow must begin with and end at a
processing step. This is quite logical because data can't transform on its own without being a process. By
using the thumb rule, it is quite easily to identify the illegal data flows and correct them in a DFD.
• An entity cannot provide data to another entity without some processing occurred.
• Data cannot move directly from an entity to a data story without being processed.
• Data cannot move directly from a data store without being processed.
• Data cannot move directly from one data store to another without being processed.
Frequently-Made Mistakes - A second class of DFD mistakes arise when the outputs from one processing
step do not match its inputs, and they can be classified as:
• Black holes - A processing step may have input flows but no output flows.
• Miracles - A processing step may have output flows but no input flows.
• Grey holes - A processing step may have outputs that are greater than the sum of its inputs.
