Selected Health Status Indicators
Jointly produced to assist those seeking to improve health care in rural Alabama
By
The Office of Primary Care and Rural Health,
Alabama Department of Public Health
and
The Alabama Rural Health Association
Special thanks to the National Rural Health Association for funding assistance in the production of this publication.
April 2013
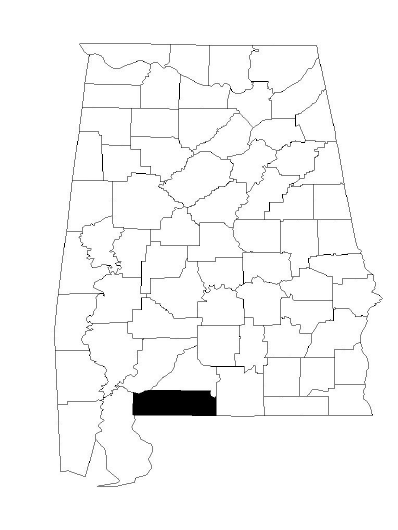
ESCAMBIA COUNTY

SELECTED HEALTH STATUS INDICATORS
United States, Alabama, and Escambia County
Indicators United States Alabama Escambia County
2011 Population Number Pct. of Total Number Pct. of Total Number Pct. of Total
Total 311,591,917 100.0 4,802,740 100.0 38,095 100.0
African American (alone) 40,750,746 13.1 1,271,695 26.5
12,244
32.1
White (alone) 243,470,497 78.1 3,368,118 70.1
23,866
62.6
American Indian (alone) 3,814,772 1.2 33,298 0.7
1,296
3.4
Asian (alone) 15,578,383 5.0 57,155 1.2
103
0.3
Hispanic 52,045,277 16.7 193,868 4.0
768
2.0
Age 19 Years or Less 82,809,903 26.6 1,265,680 26.4
9,562
25.1
Age 65 Years or More 41,394,141 13.3 672,586 14.0
5,827
15.3
Age 85 Years or More 5,737,173 1.8 77,743 1.6
591
1.6
Population Change Number
Pct. Change Number
Pct. Change Number
Pct. Change
1910 – 2010
91,972,266 to
308,745,538
235.7
2,138,093 to
4,779,736
123.6
18,889 to
38,319
102.9
2010 – 2040 Projected
308,745,538 to
380,016,000
23.1
4,779,736 to
5,567,024
16.5
38,319 to
37,286
-2.7
Age 65+: 2010 – 2040 Projected
40,267,984 to
79,719,000
98.0
657,792 to
1,199,853
82.4
5,812 to
7,711
32.7
Hispanic: 1990 – 2011
22,354,059 to
52,045,277
132.8
24,629 to
193,868
687.2
169 to
768
354.4
Income Related Indicators Number
Measure Number
Measure Number
Measure
Population Below Poverty Level –
2011
48,452,035
15.9%
896,117
19.1% 8,893 25.5%
Children Under 18 Below Poverty
Level - 2011
16,386,500
22.5%
307,310
27.6% 2,691 31.5%
Population Under 200% Poverty Level
(2006-2011)
97,686,522 32.7% 1,783,196 38.5% 17,416 49.4%
Per Capita Personal Income – 2011 N.A. $41,560 N.A. $34,880 N.A. $28,227
Medicaid Eligible Population – 2011 N.A. N.A. 1,070,781 22.3% 10,615 27.9%
Medicaid Eligible Children (Under 21)
- 2011
N.A.
N.A.
618,137
46.9% 6,246 62.6%
Medicaid Births - 2011 N.A. N.A. 31,498 53.1% 351 74.8%
Access to Health Care Indicators Number Measure Number Measure Number Measure
1
Primary Care Physicians – 2012 (Per
10,000 Population)
208,807
6.8 (2010)
3,056
6.4 18 4.7
Dentists – 2013 (Per 10,000 Pop.) 155,700 5.0 (2010) 2,141 4.4 8 2.1
Psychiatrists – 2012 (Per 10,000 Pop.) 39,738 1.3 326 0.7 0 0.0
General Hospital Authorized Beds –
2013 (Per 10,000 Population)
N.A. N.A. 16,475 34.3 98 25.7
Is there a hospital providing
obstetrical service in the county?
N.A. N.A.
YES in 31 counties
NO in 36 counties
Yes

SELECTED HEALTH STATUS INDICATORS - continued
United States, Alabama, and Escambia County
Indicators United States
Alabama
Escambia County
Access to Health Care Indicators –
continued
Number Measure Number Measure Number Measure
1
Households With No Vehicle 10,397,000 9.1% (2010) 119,611 6.6% (2010) 1,014
7.5% (2008-
2010)
Uninsured Population Under 65 Years
of Age - 2010
46,556,803 17.7% 681,437 16.9% 5,738 19.5%
Dialysis Patients and Dialysis Patients
per Dialysis Station – 2013
N.A N.A. 7,584 3.2 58 2.4
Cause of Death Indicators (Includes
all causes with 950 or more deaths
statewide.)
Number in
2009 - 2011
Rate per
100,000 Pop.
Number in
2009 - 2011
Rate per
100,000 Pop.
Number in
2009 - 2011
Rate per
100,000 Pop.
1
All Causes 7,418,471 800.9 143,493 1,000.6 1,309 1,141.0
Septicemia 105,990 11.4 2,644 18.4 13 N.A.
Cancer 1,717,684 185.4 30,564 213.1 275 239.7
Colon, Rectum, and Anus 157,259 17.0 2,694 18.8 16 13.9
Liver and Intrahepatic Bile Ducts 61,176 6.6 966 6.7 14 N.A.
Pancreas 109,887 11.9 1,813 12.6 16 13.9
Trachea, Bronchus, and Lung 473,090 51.1 9,644 67.2 100 87.2
Breast (female) 122,508 26.0 1,974 26.8 22 39.6
Prostate (male) 84,578 18.6 1,611 23.1 14 N.A.
Non-Hodgkin’s Lymphoma 60,904 6.6 960 6.7 5 N.A.
Leukemia 68,157 7.4 1,148 8.0 8 N.A.
Diabetes Mellitus 211,058 22.8 3,840 26.8 52 45.3
Parkinson’s Disease 65,704 7.1 1,075 7.5 7 N.A.
Alzheimer’s Disease 247,188 26.7 4,498 31.4 47 41.0
Major Cardiovascular Diseases 2,339,340 252.6 46,705 325.7 417 363.5
Heart Diseases 1,793,441 193.6 35,879 250.2 315 274.6
Hypertensive Heart Disease 100,218 10.8 1,226 8.5 14 N.A.
Ischemic Heart Diseases 1,140,484 123.1 16,558 115.5 212 184.8
Acute Myocardial Infarction 367,267 39.7 7,593 52.9 74 64.5
Heart Failure 173,711 18.8 5,769 40.2 17 14.8
Cerebrovascular Diseases (Stroke) 387,249 41.8 7,786 54.3 62 54.0
Pneumonia 152,507 16.5 2,755 19.2 12 N.A.
Chronic Lower Respiratory Diseases 418,815 45.2 8,498 59.3 77 67.1
Chronic Liver Disease and Cirrhosis 96,000 10.4 1,539 10.7 16 13.9

SELECTED HEALTH STATUS INDICATORS - continued
United States, Alabama, and Escambia County
Indicators United States Alabama Escambia County
Cause of Death Indicators (Includes
all causes with 950 or more deaths
statewide.)
Number in
2009 - 2011
Rate per
100,000 Pop.
Number in
2009 - 2011
Rate per
100,000 Pop.
Number in
2009 - 2011
Rate per
100,000 Pop.
1
Nephritis, Nephrotic Syndrome,
and Nephrosis
145,142 15.7 3,410 23.8 19 16.6
Renal Failure 131,884 14.2 3,183 22.2 18 15.7
Accidents 361,657 39.0 7,307 51.0 69 60.1
Motor Vehicle Accidents 106,225 11.5 2,723 19.0 22 19.2
Poisoning and Exposure to Noxious
Substances
98,353 10.6 1,571 11.0 15 N.A.
Intentional Self-Harm (suicide) 113,558 12.3 1,983 13.8 9 N.A.
Assault (homicide) 49,011 5.3 1,181 8.2 17 14.8
Causes of Death Groupings of Special Interest
Cause of Death Indicators
Number in
2009 - 2011
Rate per
100,000 Pop.
Number in
2009 - 2011
Rate per
100,000 Pop.
Number in
2009 - 2011
Rate per
100,000 Pop.
1
Firearm Deaths (intentional self-harm,
assault, legal intervention, and
undetermined intent)
95,182 10.3 2,387 16.6 14 N.A.
Drug-Induced Deaths 119,779 12.9 1,812 12.6 43 37.5
Alcohol-Induced Deaths 76,466 8.3 748 5.2 15 N.A.
Cancer Incidence and Rates by Site and County
Indicators United States Alabama Escambia County
Cancer Site
Number in
2000 - 2009
Rate per
100,000 Pop.
Number in
2000 - 2009
Rate per
100,000 Pop.
Number in
2000 - 2009
Rate per
100,000 Pop.
1
All Sites N.A. N.A. 225,026 459.9 2,014 473.1
Lung N.A. N.A. 37,608 76.1 356 82.6
Colorectal N.A. N.A. 24,344 49.8 230 53.8
Oral N.A. N.A. 6,187 12.5 66 15.1
Melanoma N.A. N.A. 8,152 17.0 49 12.2
Prostate N.A. N.A. 33,711 155.8 282 151.7
Breast (Female, only) N.A. N.A. 31,171 117.3 256 112.2
Cervix N.A. N.A. 2,190 9.0 17 8.8

SELECTED HEALTH STATUS INDICATORS - continued
United States, Alabama, and Escambia County
Indicators United States Alabama Escambia County
Natality Related Indicators Number Measure Number Measure Number Measure
1
Infant Mortality 2009-2011 – (Per
1,000 Births)
74,908 6.2 1,516 8.3 12 8.2
Low Weight Births – 2011 (Percent of
All Births)
325,563 (2010) 8.1 % 5,908 10.0 % 54 11.4%
Births to Teens (10-19) – 2011
(Percent of All Births)
372,175 (2010) 9.3 % 6,697 11.3 % 72 15.3%
Births With Less Than Adequate
Prenatal Care – 2011 (Percent of All
Births)
N.A. N.A. 15,986 27.2 % 142 30.5%
Caesarian Births – 2011 (Percent of
All Births)
1,309,182 32.8 % 20,980 35.4 % 233 49.4%
Tobacco Use During Pregnancy –
2011 (Percent of All Births)
N.A. N.A. 6,289 10.6 % 81 17.2%
Births to Undereducated Women –
2011 (Percent of All Births)
N.A. N.A. 9,295 15.7 % 69 14.7%
Births to Unmarried Women – 2011
(Percent of All Births)
1,633,471
40.8%
(2010)
24,946 42.1% 237 50.2%
Preterm Births – 2009 - 2011 (Percent
of All Births)
478,790
12.0%
(2010)
29,096 16.0% 292 20.1%
Births for Which Diabetes was
Reported as a Risk Factor – 2007-
2011 (Per 1,000 Live Births)
201,218
50.5
(2010)
13,510 45.5 115 48.7
Other Indicators Number
Measure
Number
Measure
Number
Measure
Age 25+ With Less Than High School
Education – 2007-2011
29,518,935 14.6 % 567,670 18.1 % 6,842 26.3%
Public School Graduation Rates - 2011 N.A.
78.0 %
(2010)
45,221 71.8 % 342 76.3%
Receiving Medicare Disability – 2010
(Percent of Total Population)
7,735,377 2.5 % 203,252 4.3 % 1,883 4.9%
Adult Obesity – 2010 (Percent of Total
Population Aged 20 Years or More)
56,369,496 25 % 1,153,068 33 % 10,300 36%
Adult Smoking - 2010 (Percent of
Total Population Aged 18+ Years)
32,838,970 14 % 838,874 23 % 6,817 23%
Excessive Drinking - 2010 (Percent of
Total Population Aged 18+ Years)
18,765,126 8 % 437,673 12 % 1,778 6%
Life Expectancy at Birth - 2011 78.7 years 75.7 years 72.8 years
Sexually Transmitted Disease Cases
Reported – January 2012 through
March 2013 (Per 10,000 Pop.)
N.A. N.A. 47,608 99.1 322 84.5

SELECTED HEALTH STATUS INDICATORS - continued
United States, Alabama, and Escambia County
Indicators United States Alabama Escambia County
Other Indicators Number Measure Number Measure Number Measure
1
New HIV Cases – 2009 through 2011
(Per 100,000 Population) NOTE:
Number of cases is not released in
counties where this is less than five.
145,614 15.7 2,093 14.6 8 N.A.
Child Abuse and Neglect Cases
Reported to Child Protective Services
for Investigation– October 2009
through September 2011 (Per 1,000
population Under Age 18)
N.A. N.A. 39,581 17.5 303 17.5
Adults Involved in Reported Abuse
and Neglect Cases – October 2010
through September 2012 (Per 10,000
Adults Aged 18+ Years.
N.A. N.A. 8,729 23.9 75 25.3
1
Rates, percentages, etc based upon fewer than 16 events may not be statistically reliable for specific analyses. “N.A.” is given for such indicators. Numbers of events, as well as
measurements, are indicated using “N.A.” for some indicators in accordance with the data owner’s policy of not publishing smaller numbers of events.
Sources of Information and Special Notes
2011 Population Estimates: Alabama State Data Center, The University of Alabama, 2011 Population Estimates and Projections, http://cber.cba.ua.edu/edata/est_prj.html
and, 2011 Population Estimates Data, http://www.census.gov/popest/data/index.html
Population Change 1910-2010: U.S. Census Bureau, County Population Census Counts 1900-90, http://www.census.gov/population/cencounts/al190090.txt for 1910 data;
U.S. Census Bureau, American FactFinder, Census 2010 Summary File 1 (SF 1) 100-Percent Data for 2010 data.
Population Change 2000-2040: U.S. Census Bureau, National Population Projections, Interim Projections 2000-2050 based on Census 2000.
http://www.census.gov/population/www/projections/natproj.html. Alabama State Data Center, Alabama County Population 2000-2010 and Projections 2015-2040.
http://cber.cba.ua.edu/edata/est_prj.html
Hispanic Population Change 1990-2011: U.S. Census Bureau, American FactFinder, Census 1990 Summary File 1 (STF 1) 100-Percent Data for 1990 data and 2011
Population Estimates Data, http://www.census.gov/popest/data/index.html.
Population Below Poverty Level - 2011: U.S. Census Bureau, Small Area Income and Poverty Estimates,
http://www.census.gov/did/www/saipe/data/statecounty/data/2011.html
Children Under 18 Below Poverty Level - 2011: U.S. Census Bureau, Small Area Income and Poverty Estimates,
http://www.census.gov/did/www/saipe/data/statecounty/data/2011.html
Population Under 200% Poverty Level (2006-2011): American Community Survey, 5-year data for 2007-2011, Table C17002.

2011 Per Capita Personal Income: U.S. Bureau of Economic Analysis, Interactive Tables: Local Area Personal Income, Table CA1-3.
http://www.bea.gov/iTable/iTable.cfm?ReqID=70&step=1#reqid=70&step=1&isuri=1
Medicaid Eligible Population - 2011: Alabama Medicaid Agency, 2011 Statistics by County. http://medicaid.alabama.gov/CONTENT/2.0_Newsroom/2.6_Statistics.aspx
Medicaid Eligible Children (Under 21) - 2011: Alabama Medicaid Agency, 2011 Statistics by County.
http://medicaid.alabama.gov/CONTENT/2.0_Newsroom/2.6_Statistics.aspx
Medicaid Births - 2011: Alabama Department of Public Health, Center for Health Statistics, Special query of the 2011 Birth Statistics File.
Primary Care Physicians in 2012: Medical Licensure Commission, Licensed Physician Data Base – 2012. National data is for 2010 and is obtained from the American
Medical Association’s 2010 Physician Master File. National data was obtained from the Agency for Healthcare Research and Quality’s on-line publication, Primary Care
Workforce Facts and Stats #1, at http://www.ahrq.gov/research/pcwork1.htm. All data has been adjusted to exclude licensed retirees and include only those actively practicing
primary care. (In this publication, primary care physicians include family practitioners, internal medicine specialists, pediatricians, gerontologists, and obstetricians and
gynecologists.)
Dentists in 2013: Board of Dental Examiners of Alabama, Licensed dentists data base - 2013. National data is for 2010 and is obtained from the Bureau of Labor Statistics at
http://www.bls.gov/emp/ep_table_102.htm.
Psychiatrists in 2012: Medical Licensure Commission, Licensed Physician Data Base – 2012. National data is for 2010 and is obtained from the American Medical
Association, Physician Characteristics and Distribution in the US 2012, Table 1.2.
Hospital Beds in 2013: Alabama Department of Public Health, Division of Provider Services, Healthcare Facilities Directory – Hospital Section. March 21, 2013.
http://www.adph.org/HEALTHCAREFACILITIES/Default.asp?id=5349.
Obstetrical Hospitals: Center for Health Statistics 2013 Birth Master File, special inquiry, February 28, 2013.
Households With No Vehicle in 2010: U.S. Census Bureau, American FactFinder, American Community Survey – 2010 or 2008-2010 or 2006-2010, Table B08210 –
Household Size by Vehicles Available. Estimates are for 1-year, 3-years, or 5-years according to the population of each county.
Uninsured Persons Under Age 65 - 2010: U.S. Census Bureau, Model-based Small Area Health Insurance Estimates (SAHIE) for Counties and States.
http://www.census.gov/did/www/sahie/index.html
Dialysis Patients and Dialysis Patients per Dialysis Station – 2013: Dialysis patients data by county was obtained by special request from Network 8, Inc.
(http://www.esrdnetwork8.org) dated May 31, 2011. Dialysis stations by county was obtained from the Healthcare Facilities Directory, Alabama Department of Public Health
(http://ph.state.al.us/facilitiesdirectory/(S(qc1vsw45hfl2iw45vbzbwini))/Default.aspx).
Cause of Death Indicators: Alabama Department of Public Health, Center for Health Statistics, Special queries of the 2009, 2010, and 2011 Mortality Statistics Files for
Alabama data. Centers for Disease Control and Prevention, CDC Wonder Interactive Program, Detailed Mortality files for 2009 and 2010 (http://wonder.cdc.gov/
). Deaths –
Preliminary Data for 2011, Vol. 61, Number 6, October 10, 2012, Table 2. (Cause of death data included in this publication is not age-adjusted)
Cancer Incidence and Rates by Site and County – Alabama Cancer Facts & Figures 2011, Alabama Statewide Cancer Registry, Alabama Department of Public Health,
Tables 3, 4, and 5. http://www.adph.org/ascr/assets/2011FactsFigures.pdf
Infant Mortality Rate - 2009-2011; Alabama Department of Public Health, Center for Health Statistics, http://www.adph.org/healthstats/assets/Total_Inf_Mort09_11.pdf.
National Data: CDC WONDER Online Data Inquiry System, 2009 and 2010 Birth and Detailed Mortality data, http://wonder.cdc.gov/, National Vital Statistics Reports, Deaths:
Preliminary Data for 2011, http://www.cdc.gov/nchs/data/nvsr/nvsr61/nvsr61_06.pdf and Recent Trends in Births and Fertility Rates Through December 2011,
http://www.cdc.gov/nchs/data/hestat/births_fertility_december_2011/births_fertility_december_2011.pdf.
Low Weight Births - 2011: Alabama Department of Public Health, Center for Health Statistics, Special query of the 2011 Birth Statistics File and CDC WONDER Online Data
Inquiry System, 2010 Births. (Births weighing less than 2,500 grams or 5 pounds and 8 ounces are defined as being of low weight.)
Births to Teenagers (Age 10-19) - 2011: Alabama Department of Public Health, Center for Health Statistics, Special query of the 2011 Birth Statistics File and CDC
WONDER Online Data Inquiry System, 2010 Births.
Births With Less Than Adequate Prenatal Care - 2011: Alabama Department of Public Health, Center for Health Statistics, Special query of the 2011 Birth Statistics File.
(The Kotelchuck Index is used in determining adequacy of prenatal care. This index primarily considers the date when prenatal care was begun and the number of visits in
determining adequacy.)
Caesarian Births - 2011: Alabama Department of Public Health, Center for Health Statistics, Special query of the 2011 Birth Statistics File and CDC WONDER Online Data
Inquiry System, 2010 Births.
Births With Tobacco Use During Pregnancy - 2011: Alabama Department of Public Health, Center for Health Statistics, Special query of the 2011 Birth Statistics File.
Births to Undereducated Women - 2011: Alabama Department of Public Health, Center for Health Statistics, Special query of the 2011 Birth Statistics File.
(Women are considered to be “undereducated” when their years of education is at least two years less than what would be expected for someone of their age.)
Births to Unmarried Women - 2011: Alabama Department of Public Health, Center for Health Statistics, Special query of the 2011 Birth Statistics File. National data:
National Vital Statistics Reports, Vol. 61, No. 1, August 28, 2012, Final Data for 2010, Supplemental Tables, http://www.cdc.gov/nchs/data/nvsr/nvsr61/nvsr61_01_tables/pdf
Preterm Births – 2009 - 2011: Alabama Department of Public Health, Center for Health Statistics, Special query of the 2009-2011 Birth Statistics Files. National data:
National Vital Statistics Reports, Vol. 61, No. 1, August 28, 2012, Final Data for 2010, Supplemental Tables, http://www.cdc.gov/nchs/data/nvsr/nvsr61/nvsr61_01_tables/pdf
Preterm births are those with a calculated gestation of less than 37 full weeks of pregnancy.
Births for Which Diabetes was Reported as a Risk Factor – 2007- 2011: Alabama Department of Public Health, Center for Health Statistics, Special query of the 2007-
2011 Birth Statistics Files. National data: National Vital Statistics Reports, Vol. 61, No. 1, August 28, 2012, Final Data for 2010, Supplemental Tables,
http://www.cdc.gov/nchs/data/nvsr/nvsr61/nvsr61_01_tables/pdf
Age 25+ With Less Than High School Education – 2007-2011: U.S. Census Bureau, American FactFinder, American Community Survey for 2007-2011, Table B15002.
Public School Graduation Rates – 2011: Alabama Kids Count Data Book – 2012, pp.31-98. http://www.alavoices.org/files/12_AKC-DataBook.pdf National data: National
Center for Education Statistics.
The number of students who graduated from public high schools in Alabama in 2011 with regular, advanced, and credit-based diplomas expressed as a percentage of the total
number of students who enrolled as first year freshmen four years earlier (or in 2007-2008). While the denominator used in computing the rate includes graduates, completers,
students still enrolled, students withdrawn but still enrolled, students who enrolled but failed to attend, dropouts, and “others,” it does not include students in the class of 2007-
2008 who were retained from later classes. Data are adjusted for students who transferred into, and out of, the cohort over the four-year period. This method of measuring the
graduation rate is referred to as the “four-year cohort graduation rate” and reflects efforts to conform to the National Governor’s Association recommendation in 2005 that states
implement a common measure of graduation beginning with the 2010-2011 academic year. However, the methodology used in computing the cohort graduation rate remains
subject to variation from one state to another
Persons Receiving Medicare Disability - 2010: Centers for Medicare and Medicaid Services, Medicare Aged and Disabled by State and County as of July 1, 2010.
http://www.cms.gov/Research-Statistics-Data-and-Systems/Statistics-Trends-and-Reports/MedicareEnrpts/Downloads/County2010.pdf
Adult Obesity - Percent of Population Aged 20+ in 2010: County Health Rankings & Roadmaps. The adult obesity measure represents the percent of the adult population
(age 20 and older) that has a body mass index (BMI) greater than or equal to 30 kg/m2. Estimates of obesity prevalence by county were calculated by the CDC’s National

Center for Chronic Disease Prevention and Health Promotion, Division of Diabetes Translation, using multiple years of Behavioral Risk Factor Surveillance System (BRFSS)
data. BRFSS data are representative of the total non-institutionalized U.S. population over 18 years of age living in households with a land-line telephone.
Adult Smoking - Percent of Population Aged 18+ in 2010: County Health Rankings & Roadmaps. This measure was calculated by the National Center for Health Statistics
using data from the Centers for Disease Control and Prevention’s Behavioral Risk Factor Surveillance System (BRFSS), a random-digit dial survey. BRFSS data are
representative of the total non-institutionalized U.S. population over 18 years of age living in households with a land-line telephone. The estimates are based on seven years of
data.
Excessive Drinking - Percent of Population Aged 18+ in 2010: County Health Rankings & Roadmaps. This measure was calculated by the National Center for Health
Statistics using data from the Centers for Disease Control and Prevention’s Behavioral Risk Factor Surveillance System (BRFSS), a random-digit dial survey. BRFSS data are
representative of the total non-institutionalized U.S. population over 18 years of age living in households with a land-line telephone. The estimates are based on seven years of
data.
Life Expectancy at Birth - 2011: Alabama Department of Public Health, Center for Health Statistics, special request and Deaths – Preliminary Data for 2011, Vol. 61,
Number 6, October 10, 2012, Table 6.
Sexually Transmitted Disease Cases – January 2011 through March 2012: Alabama Department of Public Health, Division of STD Prevention and Control, Statistics, 2011
and 2012. http://www.adph.org/STD/Default.asp?id=1080
New HIV Cases – 2009 through 2011: Alabama Department of Public Health (ADPH), HIV Surveillance Branch. Any analyses, interpretation or conclusions reached from this
data are those of the user and not the HIV Surveillance Branch. National data: HIV Surveillance Report, Diagnosis of HIV Infection in the United States and Dependent Areas,
2011, Vol.23, Table 1a. Note that national data is estimated to account for reporting delays and missing transmission.
Child Abuse and Neglect Cases Reported to Child Protective Services for Investigation – October 2009 through September 2011: Alabama Department of Human
Resources, Child Protective Services, special request for FY 2010 and FY 2011. Please note that it is possible for there to be more than one report on the same family and the
number of reports does not correspond with the number of children since reports can involve more than one child in a family.
Adults Involved in Reported Abuse and Neglect Cases – October 2010 through September 2012 : Alabama Department of Human Resources, Adult Protective Services,
special request for FY 2011 and FY 2012. Please note that it is possible for there to be more than one report on the same adult.
This and other county reports are available online at www. Arhaonline.org or www.adph.org/ruralhealth/
PERMISSION IS GRANTED TO DUPLICATE OR OTHERWISE USE ALL OR ANY PORTION OF THIS REPORT
For additional information please contact the Office of Primary Care and Rural Health Development at (334) 206-5396 or the Alabama Rural
Health Association at (334) 546-3502.
