September 2019
Financial Alignment Initiative
South Carolina Healthy Connections Prime:
First Evaluation Report
Final
Prepared for
Sai Ma
Nancy Chiles Shaffer
Thomas Shaffer
Centers for Medicare & Medicaid Services
Center for Medicare & Medicaid Innovation
Mail Stop WB-06-05
7500 Security Boulevard
Baltimore, MD 21244-1850
Submitted by
Edith G. Walsh
RTI International
307 Waverly Oaks Road, Suite 101
Waltham, MA 02452-8413
RTI Project Number 0214448.001.007.000.000.006
[This page intentionally left blank.]
FINANCIAL ALIGNMENT INITIATIVE
SOUTH CAROLINA HEALTHY CONNECTIONS PRIME:
FIRST EVALUATION REPORT
By
RTI International
Catherine Ormond, MS
Matt Toth, MSW, PhD
Jennifer Howard, PhD
Lanre Adisa, BA
Emily Vreeland, MS
Ira Dave, MSPH
Yiyan Liu, PhD
Paul Moore, MA
Emily Gillen, PhD
Giuseppina Chiri, PhD
Wayne Anderson, PhD
Melissa Morley, PhD
Angela M. Greene, MS, MBA
Project Director: Edith G. Walsh, PhD
Federal Project Officers: Sai Ma, Nancy Chiles Shaffer, and Thomas Shaffer
RTI International
CMS Contract No. HHSM-500-2014-00037i TO#7
August 2019
This project was funded by the Centers for Medicare & Medicaid Services under contract no.
HHSM-500-2014-00037i TO #7. The statements contained in this report are solely those of the
authors and do not necessarily reflect the views or policies of the Centers for Medicare & Medicaid
Services. RTI assumes responsibility for the accuracy and completeness of the information
contained in this report.
_________________________________
RTI International is a registered trademark and a trade name of Research Triangle Institute.
Acknowledgments
We would like to thank the State officials who contributed information reflected in this
Evaluation Report through interviews during site visits and quarterly telephone calls. We also
thank the Medicare-Medicaid enrollees, managed care plan staff, consumer advocates, and other
stakeholders who also answered our questions about their experience and perspectives on the
demonstrations. We gratefully acknowledge the many contributions of CMS staff, especially our
Project Officers, Sai Ma, Nancy Chiles Shaffer, and Thomas Shaffer, and our former COR,
Daniel Lehman. We also thank other staff at RTI International, who helped to gather information
and produce tables for this report. Christopher Klotschkow, Michelle Bogus, Catherine Boykin,
and Roxanne Snaauw provided excellent editing and document preparation.

v
Contents
Section Page
Executive Summary ...................................................................................................................ES-1
1. Overview .................................................................................................................................1
1.1 Evaluation Overview .....................................................................................................1
1.1.1 Purpose ...............................................................................................................1
1.1.2 What it Covers ...................................................................................................1
1.1.3 Data Sources ......................................................................................................2
1.2 Model Description and Demonstration Goals ................................................................4
1.3 Changes in Demonstration Design.................................................................................6
1.4 Overview of State Context .............................................................................................7
2. Integration of Medicare and Medicaid ..................................................................................11
2.1 Joint Management of Demonstration ...........................................................................11
2.2 Overview of Integrated Delivery System ....................................................................12
2.2.1 Healthy Connections Prime Plans ....................................................................12
2.2.2 Provider Arrangements and Services ...............................................................12
2.2.3 Training and Support for Plans and Providers .................................................15
2.3 Major Areas of Integration...........................................................................................16
3. Eligibility and Enrollment.....................................................................................................17
3.1 Introduction ..................................................................................................................17
3.2 Enrollment Process ......................................................................................................17
3.2.1 Eligibility .........................................................................................................17
3.2.2 Phases of Enrollment .......................................................................................18
3.2.3 Passive Enrollment Experience ........................................................................20
3.2.4 Integration of Medicare and Medicaid Enrollment Systems ...........................21
3.2.5 Contacting and Locating Enrollees ..................................................................21
3.3 Summary Data .............................................................................................................22
4. Care Coordination .................................................................................................................25
4.1 Care Coordination Model ............................................................................................25
4.1.1 Assessment .......................................................................................................26
4.1.2 HCBS Waiver Services and Coordination .......................................................29
4.1.3 Care Planning Process......................................................................................30
4.2 Information Exchange ..................................................................................................33
5. Beneficiary Experience .........................................................................................................35
5.1 Introduction ..................................................................................................................35
5.2 Impact of the Demonstration on Beneficiaries ............................................................36
5.2.1 Overall Satisfaction with Healthy Connections Prime ....................................36
5.2.2 New or Expanded Benefits ..............................................................................38
5.2.3 Medical and Specialty Services .......................................................................39
5.2.4 Care Coordination Services .............................................................................40
vi
5.2.5 Beneficiary Access to Care and Quality of Services .......................................41
5.2.6 Person-centered Care and Patient Engagement ...............................................43
5.2.7 Personal Health Outcomes and Quality of Life ...............................................43
5.2.8 Experience of Special Populations...................................................................44
5.2.9 Beneficiary Protections ....................................................................................45
6. Stakeholder Engagement ......................................................................................................49
6.1 Overview ......................................................................................................................49
6.2 Organization and Support ............................................................................................50
6.2.1 Stakeholder Council .........................................................................................50
7. Financing and Payment .........................................................................................................53
7.1 Rate Methodology ........................................................................................................53
7.1.1 Rating Categories and Risk Adjustments ........................................................53
7.1.2 Savings Percentage ..........................................................................................54
7.1.3 Performance Incentives ....................................................................................55
7.1.4 Medical Loss Ratio ..........................................................................................56
7.2 Financial Impact...........................................................................................................56
7.2.1 Early Implementation Experience....................................................................56
7.2.2 Rate Methodology Design Implications ..........................................................57
7.2.3 Cost Experience ...............................................................................................58
8. Service Utilization ................................................................................................................61
8.1 Overview of Benefits and Services ..............................................................................62
8.2 Impact Analyses on the Demonstration Eligible Population .......................................63
8.2.1 Descriptive Statistics on the Demonstration Eligible Population ....................71
8.2.2 Impact Analyses on the Demonstration Eligible Population with SPMI .........71
8.2.3 Service Use for Enrollee and Non-Enrollee Populations in South
Carolina ............................................................................................................73
8.2.4 Service Use by Demographic Characteristics of Eligible Beneficiaries ..........74
9. Quality of Care ......................................................................................................................79
9.1 Quality Measures .........................................................................................................79
9.2 Quality Management Structures and Activities ...........................................................81
9.2.1 State and CMS Quality Management Structures and Activities ......................82
9.2.2 Healthy Connections Prime MMP Quality Management Structure and
Activities ..........................................................................................................82
9.2.3 Independent Quality Management Structures and Activities ..........................83
9.3 Results for Selected Quality Measures ........................................................................83
9.3.1 HEDIS Quality Measures Reported for Healthy Connections Prime
Plans .................................................................................................................83
10. Cost Savings Calculation ......................................................................................................87
10.1 Evaluation Design ........................................................................................................88
10.2 Medicare Expenditures: Constructing the Dependent Variable ...................................90
10.3 Results ..........................................................................................................................93
10.3.1 Regression Analysis .........................................................................................95
vii
10.4 Discussion ....................................................................................................................98
11. Conclusions ...........................................................................................................................99
11.1 Implementation-related Successes, Challenges, and Lessons Learned .......................99
11.2 Demonstration Impact on Service Utilization and Costs ...........................................100
11.3 Next Steps ..................................................................................................................101
References ....................................................................................................................................R-1
Appendices
A Comparison Group Methodology for South Carolina Demonstration Year 1 ................... A-1
B Analysis Methodology ........................................................................................................B-1
C Descriptive Tables ..............................................................................................................C-1
D Sensitivity Analysis Tables ................................................................................................ D-1
E Summary of Predemonstration and Demonstration Design Features for Medicare
and Medicaid Beneficiaries in South Carolina ................................................................... E-1

viii
List of Tables
Number Page
1 Healthy Connections Prime MMP profiles .......................................................................... 13
2 Transition of HCBS waiver functions from State to MMP ................................................. 14
3 Healthy Connections Prime enrollment phases ................................................................... 19
4 Percentage of members that Healthy Connections Prime plans were unable to reach
following three attempts, within 90 days of enrollment, by quarter .................................... 22
5 Key events affecting enrollment and percentage enrolled in Healthy Connections
Prime .................................................................................................................................... 23
6 Total percentage of enrollees whose assessment was complete within 90 days of
enrollment ............................................................................................................................ 28
7 Members with care plans within 90 days of enrollment ...................................................... 32
8 Care coordination staffing ................................................................................................... 33
9 Beneficiary overall satisfaction, 2017 ................................................................................. 37
10 Care coordination, 2017 ....................................................................................................... 41
11 Rate cell Medicaid payments per member per month, demonstration year 1 and
demonstration year 2 ............................................................................................................ 54
12 Savings percentages by demonstration year ........................................................................ 55
13 Average, minimum, and maximum HCC score by MMP during demonstration year
1 (February 1, 2015–December 31, 2016) ........................................................................... 59
14 Summary of South Carolina demonstration impact estimates for demonstration
period (February 1, 2015–December 31, 2016) ................................................................... 62
15 Adjusted means and impact estimate for eligible beneficiaries in the demonstration
and comparison groups in South Carolina through December 31, 2016 ............................. 66
16 Adjusted means and impact estimate for eligible beneficiaries in the demonstration
and comparison groups in South Carolina through the demonstration period
February 1, 2015–December 31, 2016................................................................................. 70
17 Selected HEDIS measures for Healthy Connections Prime plans, 2016 ............................. 84
18 Data sources for monthly Medicare expenditures ............................................................... 90
19 Adjustments to Medicare expenditures variable .................................................................. 91
20 Mean monthly Medicare expenditures for Healthy Connections Prime eligibles and
comparison group, predemonstration period and demonstration period 1,
unweighted ........................................................................................................................... 95
21 Mean monthly Medicare expenditures for Healthy Connections Prime eligibles and
comparison group, predemonstration period and demonstration period 1, weighted .......... 95
22 Demonstration effects on Medicare savings for eligible beneficiaries—Difference-
in-difference regression results, Healthy Connections Prime eligibles and
comparison group ................................................................................................................ 96
23 Adjusted means and overall impact estimate for eligible beneficiaries in the
demonstration and comparison groups, Healthy Connections Prime eligibles and
comparison group ................................................................................................................ 97

ix
List of Figures
Number Page
1 Demonstration effects on service utilization for eligible beneficiaries in South
Carolina—Difference-in-differences regression results for the demonstration
period, February 1, 2015–December 31, 2016 .................................................................... 64
2 Demonstration effects on long-stay nursing facility use for eligible beneficiaries in
South Carolina—Difference-in-differences regression results for the demonstration
period, February 1, 2015–December 31, 2016 .................................................................... 64
3 Demonstration effects on RTI quality of care measures for eligible beneficiaries in
South Carolina—Difference-in-differences regression results for the demonstration
period, February 1, 2015–December 31, 2016 .................................................................... 68
4 Demonstration effects on service utilization for eligible beneficiaries with SPMI in
South Carolina—Difference-in-differences regression results for the demonstration
period, February 1, 2015–December 31, 2016 .................................................................... 72
5 Demonstration effects on quality of care and care coordination for eligible
beneficiaries with SPMI in South Carolina—Difference-in-differences regression
results for the demonstration period, February 1, 2015–December 31, 2016 ..................... 73
6 Percent with use of selected Medicare services ................................................................... 75
7 Service use among all demonstration eligible beneficiaries with use of service per
1,000 user months ................................................................................................................ 76
8 Service use among all demonstration eligible beneficiaries per 1,000 eligible
months .................................................................................................................................. 77
9 Mean monthly Medicare expenditures, predemonstration and demonstration period,
Healthy Connections Prime eligible and comparison group, February 2013–
December 2016 .................................................................................................................... 93
10 Mean monthly Medicare expenditures (weighted), predemonstration and
demonstration period, Healthy Connections Prime eligibles and comparison group,
February 2013–December 2016........................................................................................... 94
x
[This page intentionally left blank.]
xi
Glossary of Terms
ACL Administration for Community Living
ACSC Ambulatory care sensitive condition
ADL Activities of daily living
CAHPS Consumer Assessment of Healthcare Providers and Systems
CICO Coordinated and Integrated Care Organizations
CLTC Community Long Term Care (SCDHHS’s division previously responsible
for HCBS services for demonstration enrollees)
CMS Centers for Medicare & Medicaid Services
CMT Contract Management Team
CTM Complaint Tracking Module
DinD Difference-in-Difference
DMH South Carolina’s Department of Mental Health
D-SNP Dual Eligible Special Needs Plan
EQRO External Quality Review Organization. For Healthy Connections Prime, it
is the Carolinas Center for Medical Excellence (CCME).
FFS Fee-for-service
HCBS Home and community-based services
HCC Hierarchical Condition Category
HEDIS Health Effectiveness Information and Data Set
HOS Health Outcomes Survey
HRA Health risk assessment
IC Implementation Council
ICP Individual care plan
IRE Medicare Independent Review Entity
LIS Low income subsidy
xii
LTC Long term care
LTSS Long-term services and supports
MA Medicare Advantage
MARx Medicare Advantage Prescription Drug System
MAXIMUS the enrollment broker for Healthy Connections Prime
MCO Managed care organization
MDS Minimum Data Set
MFFS Managed fee-for-service
MFP Money Follows the Person
MLR Medical loss ratio
MMCO Medicare-Medicaid Coordination Office
MMP Medicare-Medicaid Plan. In South Carolina, the MMPs are Absolute Total
Care (Centene), Advicare Advocate (through August 2016), Molina
Healthcare, and First Choice VIP Care Plus by Select Health of South
Carolina.
MOU Memorandum of Understanding
MT Multidisciplinary team, also known as Interdisciplinary Care Team
OSA Office for the Study of Aging at the University of South Carolina
NF Nursing facility
PACE Program of All-Inclusive Care for the Elderly
PCP Primary care physician or provider
Phoenix SCDHHS’ electronic Medicaid HCBS waiver case management system
PMPM per member per month
POC Plan of care
Prime Advocate Healthy Connections Prime’s ombudsman, who is also the LTC
Ombudsman for the State.
SCDHHS South Carolina Department of Health and Human Services
xiii
SDRS State Data Reporting System
SHIP State health insurance program
SPA State Plan Amendment
SPMI Serious and persistent mental illness
Waiver-like services Flexible benefits that MMPs may provide to Healthy Connections Prime
enrollees. They are often used prior to enrollment into an HCBS waiver.
xiv
[This page intentionally left blank.]
ES-1
Executive Summary
The Medicare-Medicaid Coordination Office and the Innovation Center at the Centers for
Medicare & Medicaid Services (CMS) have created the Medicare-Medicaid Financial Alignment
Initiative to test, in partnerships with States, integrated care models for Medicare-Medicaid
enrollees. CMS contracted with RTI International to monitor the implementation of the
demonstrations and to evaluate their impact on beneficiary experience, quality, utilization, and
cost. The evaluation will include a final aggregate evaluation report and individual State-specific
evaluation reports.
South Carolina and CMS launched the Healthy Connections Prime demonstration in
February 2015 to integrate care for Medicare-Medicaid beneficiaries throughout the State. Four
health plans were competitively selected to operate Medicare-Medicaid Plans (MMPs). MMPs
receive capitated payments from CMS and the State to finance all Medicare and Medicaid
services. MMPs also provide care coordination, a new palliative care benefit, and flexible
benefits.
Beneficiaries who are 65 years or older and living in the community are eligible for the
demonstration, which operated in 39 of the 46 counties in the State as of December 2017.
Participants in three home and community-based services (HCBS) waiver groups are also
eligible to participate.
This First Evaluation Report for the South Carolina demonstration describes
implementation of the Healthy Connections Prime demonstration and early analysis of the
demonstration’s impacts. The report includes findings from qualitative data for February 1, 2015
through December 31, 2017, with key qualitative information through mid-2018, and
quantitative results from February 1, 2015 through December 31, 2016. Data sources include key
informant interviews, beneficiary focus groups, the Consumer Assessment of Healthcare
Providers and Systems (CAHPS) survey results, Medicare claims data, the Minimum Data Set
nursing facility assessments, MMP encounter data, and other demonstration data. Future analyses
also will include Medicaid claims and encounters as those data become available.
Highlights
Eligibility and Enrollment
• In December 2017, approximately 20,726 beneficiaries were eligible for the
demonstration and 11,511 beneficiaries were enrolled. Beneficiaries eligible for
passive enrollment into the demonstration included Medicare-Medicaid beneficiaries
who received their Medicare benefits under fee-for-service. Medicare-Medicaid
beneficiaries enrolled in Medicare Advantage could also choose to disenroll from
their Medicare Advantage plan and opt into the demonstration.
• Initially in 2013, MMPs developed financial plans, built infrastructure, and hired staff
to support Healthy Connections Prime based on the State’s estimate of 53,000 eligible
beneficiaries, which included beneficiaries enrolled in Medicare Advantage plans
who were ineligible for passive enrollment. By 2016 and 2017, although MMPs had
ES-2
streamlined staffing and support for the demonstration, two of the three plans cited
financial concerns in sustaining their participation in the demonstration, due to lower
than expected enrollment and higher than expected costs.
• The demonstration experienced delays and pauses in passive enrollment due to
legislative actions at the start, and subsequently while the State’s leadership
considered including the demonstration population in a new managed long-term
services and supports (MLTSS) program. These delays resulted in a lack of
momentum to build enrollment and, consequently, a concern by MMPs and
stakeholders about the viability and future of the demonstration.
• In July 2018, CMS, the State, and all three plans agreed to extend the demonstration
through December 2020. The agreement included a plan to increase the eligible pool
by introducing passive enrollment to Dual Eligible Special Needs Plan (D-SNPs)
enrollees. It also reduced the savings percentages applied to the capitated rates that
CMS and the State pay to the plans effective 2018 and eliminated some
administrative requirements of the plans.
Care Coordination
• Evaluation of social determinants of health is an important factor in the
demonstration’s home-based enrollee assessments along with the beneficiary’s
mental, cognitive, and physical health. Care coordinators connect enrollees with
community-based groups to provide services that can enable enrollees to live safely in
their homes in this very rural State. Plans provide varying degrees of additional
flexible benefits primarily focused on nursing facility diversion.
Beneficiary Experience
• 2017 CAHPS survey results show that 54 to 66 percent of enrollees rated their
satisfaction with the three plans as a 9 or 10 (with 10 being the highest). Similarly,
almost all RTI focus group participants in South Carolina rated their plans a 9 or 10.
• 2016 and 2017 focus group participants were consistent in stating that the lack of
copays was the most important factor to improved access to care and quality of life.
Many noted that the funds not spent on copays were now used for food and other
essential items. Others noted that they were no longer turned away at providers’
offices for not having sufficient funds to receive care.
• Participants in focus groups generally knew their care coordinator by name and
described their reliance on their services. Focus group participants described ways in
which some care coordinators took extraordinary measures to accompany members to
appointments to ensure they received needed care.
• The volume of complaints and appeals has remained low throughout the
demonstration. The State’s long-term care ombudsman serves as the demonstration’s
Prime Advocate or ombudsman. In addition to working with plans to resolve disputes,

ES-3
she participates in the contract management team, and provides outreach to potential
enrollees. Plans reported the Prime Advocate is a major demonstration asset.
• Among those individuals who disenrolled from Healthy Connections Prime, surveys
and member exit interviews showed beneficiary preference to stay with their current
providers who were not in the MMPs’ networks. MMPs experienced some difficulty
attracting a wide provider network due, in part, to fear of managed care, and the
reluctance of some established health care networks to participate in the
demonstration.
Service Utilization
• As measured across all eligible beneficiaries, the demonstration resulted in a 19.0
percent reduction in the probability of inpatient admissions, a 16.9 percent reduction
in the probability of skilled nursing facility admission, an 18.5 percent reduction in
the probability of overall ambulatory care sensitive condition (ACSC) admissions,
and a 19.8 percent reduction in the probability of chronic ACSC admissions (see
Table ES-1). Conversely, the demonstration resulted in a 27.2 percent increase in the
probability of any new long-stay nursing facility use.
1
These reported changes, which
although appear large in percentage terms in comparison to the comparison group, are
actually quite small in absolute terms, reflecting usually less than a one percentage
point change in the probability of service use. Section 8 on service utilization and
Appendix B contain an explanation of the research design and populations analyzed.
• Results for those with serious and persistent mental illness on the probability of
inpatient or skilled nursing facility admission or ER visits were in the same direction
and to a similar degree as those for all eligible beneficiaries, as well as for the number
of evaluation and management visits.
1
This finding should be interpreted with caution as State-level eligibility determination delays for long-stay
nursing facility approval could have contributed to this finding. During the period covered by this report, long-
stay nursing facility residents were excluded from being eligible to enroll into the demonstration. However, due
to delays in determining nursing facility eligibility, individuals newly requiring long-stay nursing facility
services were enrolled in the demonstration, thus raising the probability of a long-stay nursing facility stay in the
demonstration group. Potentially, if beneficiaries with those long-stay nursing facility stays had been more
quickly identified, they would have been ineligible for demonstration enrollment.

ES-4
Table ES-1
Summary of South Carolina demonstration impact estimates for demonstration period
(February 1, 2015–December 31, 2016)
(p < 0.1 significance level)
Measure
All demonstration eligible
beneficiaries
Demonstration eligible
beneficiaries with SPMI
Probability of inpatient admission Decreased Decreased
Probability of ambulatory care
sensitive condition (ACSC)
admissions, overall
Decreased NS
Probability of ACSC admissions,
chronic
Decreased NS
All-cause 30-day readmissions NS Decreased
Probability of emergency room (ER)
visit
Decreased Decreased
Preventable ER visits Decreased NS
30-day follow-up after mental health
discharges
NS NS
Probability of skilled nursing facility
(SNF) admission
Decreased Decreased
Probability of any new long-stay
nursing facility (NF) use
Increased N/A
Physician evaluation and
management (E&M) visits
Decreased Decreased
N/A = not applicable; NS = not statistically significant; SPMI = serious and persistent mental illness.
SOURCE: RTI analysis of Medicare and Minimum Data Set data.
Cost Savings
• The results of preliminary Medicare cost savings analyses using a difference-in-
differences regression approach do not indicate savings or losses due to the South
Carolina demonstration over the period February 2015–December 2016. The cost
savings analyses do not include Medicaid data due to current data unavailability, but
these data will be incorporated into future calculations as they become available.
1
1. Overview
1.1 Evaluation Overview
1.1.1
Purpose
The Medicare-Medicaid Coordination Office (MMCO) and the Innovation Center at the
Centers for Medicare & Medicaid Services (CMS) have created the Medicare-Medicaid
Financial Alignment Initiative to test, in partnerships with States, integrated care models for
Medicare-Medicaid enrollees. The goal of these demonstrations is to develop person-centered
care delivery models integrating the full range of medical, behavioral health, and long-term
services and supports (LTSS) for Medicare-Medicaid enrollees, with the expectation that
integrated delivery models would address the current challenges associated with the lack of
coordination of Medicare and Medicaid benefits, financing, and incentives.
This report on the South Carolina capitated model demonstration under the Medicare-
Medicaid Financial Alignment Initiative, called Healthy Connections Prime, is one of several
reports that will be prepared over the next several years to evaluate the demonstration. CMS
contracted with RTI International to monitor the implementation of the demonstrations under the
Financial Alignment Initiative and to evaluate their impact on beneficiary experience, quality,
utilization, and cost. The evaluation includes a final aggregate evaluation (Walsh et al., 2013)
and individual State-specific evaluation reports.
The goals of the evaluation are to monitor demonstration implementation, evaluate the
impact of the demonstration on the beneficiary experience, monitor unintended consequences,
and monitor and evaluate the demonstration’s impact on a range of outcomes for the eligible
population as a whole and for special populations (e.g., people with mental illness and/or
substance use disorders, LTSS recipients). To achieve these goals, RTI collects qualitative and
quantitative data from South Carolina each quarter; analyzes Medicare and Medicaid enrollment,
claims, and encounter data; conducts site visits, beneficiary focus groups, and key informant
interviews; and incorporates relevant findings from any beneficiary surveys conducted by other
entities. In addition to this report, monitoring and evaluation activities will also be reported in
subsequent evaluation reports.
1.1.2
What it Covers
This report analyzes implementation of the Healthy Connections Prime demonstration
from its initiation on February 1, 2015 through December 31, 2017. For this reporting period,
quantitative data based on Medicare claims and encounter data and the nursing facility Minimum
Data Set 3.0 through 2016 are included. To capture relevant information generated at the
conclusion of the demonstration period or immediately afterward, this report also includes key
updated qualitative information through mid-2018. It describes the South Carolina Healthy
Connections Prime demonstration key design features; examines the extent to which the
demonstration was implemented as planned; identifies any modifications to the design; and
discusses the challenges, successes, and unintended consequences encountered during the period
covered by this report. It also includes data on the beneficiaries eligible and enrolled, geographic
areas covered, and status of the participating Medicare-Medicaid Plans (hereafter referred to as
2
Healthy Connections Prime plans or MMPs). Finally, the report includes data on care
coordination, the beneficiary experience, stakeholder engagement activities, and, to the extent
that data are available, analyses of utilization and quality, and a summary of preliminary findings
related to Medicare savings results in the first demonstration year.
1.1.3
Data Sources
A wide variety of information informed this First Evaluation Report of the Healthy
Connections Prime demonstration. Data sources used to prepare this report include the
following:
Key informant interviews. The RTI evaluation team conducted in-person site visits in
South Carolina in July 2015 and July 2016 and conducted in-depth telephone interviews in
October and November 2017. The team interviewed the following types of individuals: State
policy makers and the South Carolina Department of Health and Human Services (SCDHHS)
staff, CMS and State contract management team (CMT) members, Ombudsman Program
officials, MMP officials, MMP care coordinators, hospital and nursing facility providers,
advocates and other stakeholders.
Focus groups. The RTI evaluation team conducted eight focus groups in South Carolina
in 2016 and six in 2017. A total of 64 enrollees and 14 proxies participated in the RTI focus
groups. Participants were assigned to groups based on their LTSS and behavioral health services
use, race, ethnicity, and primary language. Focus groups were not conducted with beneficiaries
who opted out of the demonstration or who disenrolled.
Surveys. Medicare requires all Medicare Advantage plans, including Healthy
Connections Prime plans, to conduct an annual assessment of the experiences of beneficiaries
using the Medicare Advantage Prescription Drug CAHPS survey instrument. The survey was not
conducted in 2015 or 2016 due to low enrollment in the demonstration during those years. The
2017 survey for Healthy Connections Prime was conducted in the first half of 2017 and included
the core Medicare CAHPS questions and 10 supplemental questions added by the RTI evaluation
team. Survey results for a subset of 2017 survey questions are incorporated into this report.
Findings are available at the Healthy Connections Prime plan level only. The frequency count for
some survey questions may be suppressed because too few enrollees responded to the question.
Comparisons with findings from all Medicare Advantage plans are available for core CAHPS
survey questions but not for the RTI supplemental questions.
Demonstration data. The RTI evaluation team reviewed data provided quarterly by
South Carolina through the State Data Reporting System (SDRS). These data included eligibility,
enrollment, and information reported by South Carolina on its stakeholder engagement process,
accomplishments on the integration of services and systems, any changes made in policies and
procedures, and a summary of successes and challenges. This report also uses data for quality
measures reported by Healthy Connections Prime plans and submitted to CMS’ implementation

3
contractor, NORC.
2,3
Data reported to NORC include core quality measures that all Medicare-
Medicaid Plans are required to report, as well as State-specific measures that Healthy
Connections Prime plans are required to report. Due to some reporting inconsistencies across
plans in 2015, plans occasionally resubmit data for prior demonstration years; therefore, these
data are considered preliminary.
Demonstration policies, contracts, and other materials. This report uses several data
sources, including the Memorandum of Understanding (MOU) between the State and Centers for
Medicare & Medicaid Services (CMS) (Centers for Medicare and Medicaid Services and State of
South Carolina, 2013; hereafter, MOU, 2013); the three-way contract (U.S. Department of
Health & Human Services and the South Carolina Department of Health & Human Services,
2014; hereafter, South Carolina three-way contract, 2014); the Summary of Contract Changes
dated November 1, 2017, contract amendments dated July 1, 2018, and materials available on the
CMS website: https://www.cms.gov/Medicare-Medicaid-Coordination/Medicare-and-Medicaid-
Coordination/Medicare-Medicaid-Coordination-
Office/FinancialAlignmentInitiative/SouthCarolina.html; documents available on the Healthy
Connections Prime website: https://msp.scdhhs.gov/SCDue2/site-page/trainings-and-
presentations; data reported through the State Data Reporting System [RTI, SDRS]), and
documents on the CMS Medicare-Medicaid Coordination website (Centers for Medicare &
Medicaid Services, 2018).
Conversations with CMS and SCDHHS officials. To monitor demonstration progress,
the RTI evaluation team engages in periodic phone conversations with SCDHHS and CMS.
These might include discussions about new policy clarifications designed to improve plan
performance, quality improvement activities, and contract management team actions.
Complaints and appeals data. Complaint (also referred to as grievance) data are from
three separate sources: (1) complaints from beneficiaries reported by Healthy Connections Prime
plans to SCDHHS, and separately to CMS’ implementation contractor, NORC; (2) complaints
received by SCDHHS or 1-800-Medicare and entered into the CMS electronic Complaint
Tracking Module (CTM);
4
and (3) qualitative data obtained by RTI on complaints. Appeals data
are based on data reported by MMPs to SCDHHS and NORC, for Core Measure 4.2, and the
Medicare Independent Review Entity (IRE). Data on critical incidents and abuse reported to
SCDHHS and CMS’ implementation contractor by Healthy Connections Prime plans are also
included in this report.
Although a discussion of the South Carolina MMPs is included, this report presents
information primarily at the Healthy Connections Prime demonstration level. It is not intended to
2
Data are reported for February 2015 through December 2017.
3
The technical specifications for reporting requirements are in the Medicare-Medicaid Capitated Financial
Alignment Model Core Reporting Requirements document, which is available at
https://www.cms.gov/Medicare-Medicaid-Coordination/Medicare-and-Medicaid-Coordination/Medicare-
Medicaid-Coordination-Office/FinancialAlignmentInitiative/MMPInformationandGuidance/MMP
ReportingRequirements.html.
4
Data are presented for the time period February 2015 through December 2017.
4
assess individual plan performance, but individual plan information is provided where plan level
data are the only data available, or where plan level data provide additional context.
Service utilization data. Evaluation Report analyses used data from many sources. First,
the State provided quarterly finder files containing identifying information on all demonstration
eligible beneficiaries in the demonstration period. Second, RTI obtained administrative data on
beneficiary demographic, enrollment, and service use characteristics from CMS data systems for
both demonstration and comparison group members. Third, these administrative data were
merged with Medicare claims and encounter data, as well as the Minimum Data Set.
Although Medicaid service data on use of LTSS, behavioral health, and other Medicaid-
reimbursed services were not available for the demonstration period and therefore are not
included in this report, CMS administrative data identifying eligible beneficiaries with serious
and persistent mental illness (SPMI) was available, so that their Medicare service use could be
presented in this report. Future reports will include findings on Medicaid service use once data
are available.
1.2 Model Description and Demonstration Goals
The goals of Healthy Connections Prime are to alleviate fragmentation and improve
coordination of services for Medicare-Medicaid enrollees, enhance quality of care, and reduce
costs for both the State and the Federal government. This demonstration aims to improve the
entire beneficiary care experience by engaging beneficiaries in their care and ensuring that they
have the choice to self-direct services as appropriate. Improving the beneficiary experience can
lead to system-wide benefits such as better quality, improved transitions between care settings,
fewer health disparities, reduced costs for payers, and the elimination of cost shifting between
Medicare and Medicaid (MOU, 2013, p. 3). Healthy Connections Prime plans are responsible for
delivery and coordination of all medical, behavioral health, and LTSS for their enrollees, as well
as providing care coordination and the new palliative care benefit.
Period of demonstration. Healthy Connections Prime began on February 1, 2015 and
was due to expire on December 31, 2018. In July 2018, CMS, the State, and all three MMPs
agreed to extend the demonstration until December 31, 2020 (CMS, 2018a).
Financial model. Healthy Connections Prime plans are paid a blended, risk-adjusted
capitated rate covering all Medicare and Medicaid services. Medicare Parts A and B and
Medicaid payments reflect the application of savings percentages and quality withholds (see
Section 7.1, Rate Methodology).
Eligible population. Beneficiaries with full benefit Medicare and Medicaid and who are
age 65 or over and living in the community at the time of enrollment, are eligible for the
demonstration. This had been a population of special interest to the State which had reduced its
nursing facility admissions by increasing home and community-based services (HCBS). Except
for the State’s Program for All-Inclusive Care for the Elderly (PACE) that only covered four of
the State’s 46 counties, there had been no previous effort to integrate HCBS with primary care
and behavioral health services. The demonstration provided this opportunity.
5
Beneficiaries participating in the Community Choices, HIV/AIDS, or Mechanical
Ventilation Dependent waiver programs for HCBS are eligible for the demonstration. Individuals
who transition from a nursing facility into the community, and are otherwise eligible, may elect
to enroll in the demonstration. Individuals already enrolled who later enter a nursing facility may
remain in the demonstration (MOU, 2013, p. 10). Any Healthy Connections Prime enrollee
residing in a nursing facility for more than 90 days before transition from that facility also may
qualify for the State’s Money Follows the Person Rebalancing demonstration, called Home
Again. Upon transition, enrollees must enter one of the three participating waivers included in
Healthy Connections Prime. Once Healthy Connections Prime enrollees return to the
community, the MMP must offer them any enhanced HCBS covered through the Home Again
program (South Carolina three-way contract, 2014, p. 97).
Healthy Connections Prime plans. SCDHHS and CMS initially contracted with four
plans, originally known as Coordinated and Integrated Care Organizations (CICOs), Absolute
Total Care (Centene), Advicare Advocate, Molina Healthcare, and First Choice VIP Care Plus by
Select Health of South Carolina. In early 2016, after State-contracted testing showed that
beneficiaries preferred the name Medicare-Medicaid Plan (MMP), the CICO name was rarely
used. Advicare’s managed care product was purchased by WellCare Health Plans, Inc., and
withdrew from the demonstration effective August 31, 2016, leaving three MMPs in the
demonstration.
Geographic coverage. Initially, the demonstration operated in 41 of the State’s 46
counties. After Advicare’s departure, 39 of the 46 counties were covered by at least one of the
three remaining MMPs. At the end of 2017, the three MMPs each covered from 29 to 39 of the
46 counties. MMPs were unable to contract with sufficient numbers of providers in seven
counties in this very rural State; therefore, those counties are not included in the demonstration.
Beneficiaries in the counties with one MMP may opt into the demonstration, but, during the
period of this report, may not be passively enrolled. In July 2018, the State made the decision to
allow eligible beneficiaries in counties in which one plan operates to be passively enrolled into
that plan beginning fall 2018.
Care coordination. Care coordination is a central feature of the South Carolina
demonstration and plans are required to provide care coordination services to all enrollees. It
begins with a home visit and comprehensive assessment, followed by the development of a care
plan. A multidisciplinary team, dependent upon the needs and wishes of the enrollee and led by a
care coordinator, delivers care coordination to all enrollees (see Section 4.1, Care Coordination
Model).
Benefits. The demonstration provides coordination of primary care, acute care,
behavioral health services, and LTSS, and a new palliative care benefit. Beneficiaries enrolled in
the HCBS waivers receive their coordinated waiver benefits under the demonstration.
Enrollees who have a history of hospitalization or emergency department use due to pain
or symptom management and who have been diagnosed with certain conditions, such as cancer,
end-stage renal disease, or congestive heart failure, may receive the new palliative care benefit. It
is designed to improve the enrollee’s quality of life by providing pain management together with
curative treatment and, according to the State, by “adding an extra layer of support to the
6
enrollee.” The State has engaged various organizations to assist in developing education for
providers and plans and adopted use of the Charlson Comorbidity Index (Charlson, n.d.). Fine-
tuning the reporting specifications and tracking services has been particularly challenging in
providing this benefit according to both State officials and plans. By the end of 2017, the
demonstration was focused on the following activities: determining evidence of increase in
member advance care planning; tracking members from palliative care to hospice; and assessing
pre and post palliative care costs (SCDHHS, 2017). For more on this topic, see Section 5,
Beneficiary Experience).
Supplemental benefits and waiver-like services. Plans have supplemental benefits
available to members enrolled in their Healthy Connections Prime products that vary by plan.
Examples of such benefits include gym memberships, coverage of eyewear expense (e.g., $150
every 2 years), and a monthly allowance for over-the-counter drug products. At their discretion,
plans may also provide flexible benefits, known in South Carolina as “waiver-like” services to
enable enrollees to postpone institutionalization or prevent higher levels of care for frail
beneficiaries. These benefits typically include home modifications, respite, personal care or other
services and are provided to members who do not meet the level of care requirements to
participate in one of the three HCBS waivers included under the demonstration (SCDHHS). For
more on use of flexible benefits, please see Section 5, Beneficiary Engagement and Section 7,
Finance and Payment.
New service delivery models. A key feature of the South Carolina demonstration is the
transition of HCBS waiver roles and responsibilities from the State to the MMPs. The SCDHHS
Community Long Term Care (CLTC) division previously had responsibility for these functions
for the three waiver populations included in the demonstration. The phased transition process
was designed to systematically introduce these functions to the MMPs while preserving the
State’s authority until each MMP demonstrated readiness. For more on this activity, please see
Section 2.2.1, Provider Arrangements and Services.
Stakeholder engagement. The Healthy Connections Prime State team has engaged
stakeholders with meetings and presentations throughout the early design and implementation
phases of the demonstration. The Prime team and its contractors have convened work groups to
focus on particular aspects of the demonstration design and made presentations to providers,
provider and beneficiary organizations, and other stakeholders. The State’s contractors engaged
in outreach to stakeholders include SC Thrive, a Medicaid beneficiary outreach organization; the
Office for the Study of Aging at the University of South Carolina, a research and training
organization; and the State’s long-term care ombudsman, who is also the demonstration’s Prime
Advocate or ombudsman.
1.3 Changes in Demonstration Design
The demonstration’s three-way contract called for opt-in enrollment to begin on
January 1, 2015, and for passive enrollment to begin in April 2015. The South Carolina
legislature passed a proviso in spring 2015 to delay passive enrollment until April 2016, thus
requiring the demonstration to have 14 months of opt-in enrollment, resulting in a very limited
enrollment during that period (see Section 3, Eligibility and Enrollment for a discussion on this
topic). This delay also caused a postponement in the transition of the HCBS waiver function to
7
the MMPs from the State. Initially, these functions were to roll out in three phases, from January
2015 through December 2016 (South Carolina three-way contract, pp. 262–73). The delay in the
start of the demonstration and of passive enrollment necessitated a longer transition of the HCBS
waiver functions from the State to the MMPs that began in February 2015 and concluded in
April 2017. One of the HCBS waiver functions did not transfer from the State to the MMPs: by
mutual agreement between the MMPs and the State, oversight of beneficiary self-directed
attendant care workers continued to be delivered by the State. In November 2017, the three-way
contract was re-executed to update the demonstration year dates and to bring the contract into
alignment with certain State and Federal guidelines and program requirements (CMS, 2017a).
In July 2018, CMS and the State announced changes to the South Carolina demonstration
that include: (1) extending the demonstration to December 31, 2020 with all three MMPs,
(2) allowing passive enrollment of eligible beneficiaries who are enrolled in Medicare Advantage
plans, (3) allowing passive enrollment of eligible beneficiaries who reside in counties with only
one MMP, (4) reduction to shared savings effective 2018, and (5) a reduction in some reporting
and other administrative requirements. These changes fall outside the reporting period of this
report and will be discussed in future reports.
1.4 Overview of State Context
This section discusses South Carolina’s experience with managed care, available waiver
services, and effects of changes in State leadership. For a summary of predemonstration and
demonstration design features for Medicare and Medicaid enrollees in South Carolina, see
Appendix E.
State leadership and MLTSS consideration. In fall 2016, the State’s Medicaid Director
announced a suspension of passive enrollment into the demonstration, effective January 1, 2017.
The State engaged external subject matter experts to assess whether an MLTSS program,
including a population not limited to those over age 65, would be more practical for the State.
Subsequently, the Medicaid Director left that position and passive enrollment in the
demonstration was restored in August 2017, but discussions about possibly transitioning the
demonstration to a MLTSS program continued throughout 2017.
A new Medicaid Director was not confirmed until early 2018. During the period from fall
2016 through the informant interviews conducted in fall 2017, MMPs, providers, and
stakeholders were uncertain whether the demonstration would continue beyond December 2018.
It is not clear whether demonstration enrollees were aware of what stakeholders commonly
called “a cloud of uncertainty” over the demonstration. In July 2018, when CMS and the State
announced an extension of the demonstration through 2020, State officials explained that the
State was continuing to study the ramifications of implementing an MLTSS product for all
dually eligible beneficiaries in the State. Any implementation would begin after the close of the
demonstration.
Experience with managed care. From the beginning of the Healthy Connections Prime
demonstration, the RTI evaluation team heard reports that managed care was relatively new in
the State and that providers were generally distrustful of contracting with managed care
organizations, including Healthy Connections Prime plans. Individual providers, such as home
8
health agencies and nursing facility owners, were particularly hesitant to engage with plans and
often opted for single case contracts for an individual enrollee, rather than contracting more
broadly with the MMP. The basis of their concern was fear of not being paid on time or as
agreed. Providers and stakeholders reported that this concern was well founded. For example,
large practices and small individual providers told of not being paid for services rendered despite
prior authorizations or approvals by Medicare Advantage plans operating in the State.
Healthy Connections Prime plans reported that Medicare Advantage plans and their
brokers provided negative or misleading information to beneficiaries about the viability of the
demonstration. This activity increased during the period of uncertainty beginning in fall 2016,
when the State paused the passive enrollment process to consider a possible change to MLTSS.
The State advised MMPs to collect details about such incidents and inform CMS and the State.
CMS researched these incidents using a “secret shopper” contractor to pose as beneficiaries. The
Center for Medicare issued a technical assistance letter to one managed care plan and contacted
another plan’s account manager to clarify instructions and guidance regarding appropriate
marketing. Similar activity from other managed care plans, agents, and brokers continued and
CMS pursued all complaints; however, obtaining first-hand evidence for these types of activities
is extremely difficult.
The State had originally introduced managed care in 1996 through risk-based managed
care organizations (MCO) serving children, pregnant women, and adults with disabilities who
were not dually eligible. Services included primary, acute, some specialty care, and outpatient
behavioral health services. Enrollment was limited until 2006, when Healthy Connections
Choices, an enrollee support program, was introduced. Operated by the State’s enrollment
vendor, Maximus, Healthy Connections Choices advised Medicaid beneficiaries that they could
choose from three Medicaid delivery models: an MCO, a primary care case management
program, or the traditional fee-for-service (FFS) option. In 2011, South Carolina required
Medicaid beneficiaries to enroll in either an MCO or a Medical Home Network (MHN) and in
January 2014, the MHNs were transitioned to MCOs. Exempted from mandatory Medicaid
managed care are children in foster care, children with disabilities, Medicaid waiver enrollees,
beneficiaries receiving institutional care, and dual eligible beneficiaries.
The State contracts with five plans to provide services to Medicaid managed care
enrollees: Absolute Total Care (Centene), Molina of South Carolina, BlueChoice Health Plan,
WellCare of South Carolina, and First Choice Select Health. These MCOs pay providers
capitated rates for each enrollee assigned to their practices. Three of these MCOs (Absolute
Total Care, Molina of South Carolina, and First Choice Select) are Healthy Connections Prime
demonstration plans. Advicare was initially contracted as an MMP, but when its Medicaid
managed care product was purchased by WellCare in August 2016, it withdrew from the
demonstration. Accountable Care Organizations (ACOs) do not have a significant presence in
South Carolina, according to State officials.
In 2017, approximately 243,030 beneficiaries, about one-quarter of South Carolina’s
Medicare beneficiaries, received care through Medicare Advantage plans. UnitedHealth group,
Humana, and Aetna accounted for 92 percent of the coverage. Medicare-Medicaid beneficiaries
participating in Medicare Advantage may receive care through four special needs plans for
dually eligible beneficiaries (D-SNP) operating in South Carolina. In 2017, approximately
9
24,364 individuals received care through D-SNPs (Kaiser Family Foundation, 2017). Three
PACE plans are available in the State; enrollment in those plans was 439 as of December 2017
(CMS, 2018b).
HCBS waivers. For individuals with disabilities or complex care needs, South Carolina
operates nine HCBS waivers. Each waiver targets individuals with a unique set of disabilities
and provides appropriate services to them. Beneficiaries participating in three of the nine
waivers, the HIV/AIDS, Mechanical Ventilation Dependent, and Community Choices HCBS
waivers, are eligible to participate in the South Carolina demonstration. The Community Choices
waiver is designed for individuals who require a nursing home level of care and assistance with
their activities of daily living. These waiver enrollees may direct services including hiring their
own personal assistance, respite and companion service providers. Beneficiaries from the
remaining six HCBS waivers (Intellectual Disabilities and Related Disabilities, Head and Spinal
Cord Injury, Community Supports, Medically Complex Children’s, Pervasive Developmental
Disorder, and Psychiatric Residential Treatment Facility Alternative Chance) are not eligible to
participate (MOU, 2013).
Federal funding. South Carolina received $4.5 million in Federal funds in September
2014 to support Healthy Connections Prime planning and implementation. The State used these
funds to contract vendors to assist with developing the demonstration. Vendors include
Maximus, the State’s enrollment broker; Ikaso Consulting for marketing support; SC Thrive for
beneficiary education and outreach; and the University of South Carolina to develop and provide
courses for the MMPs, providers, and stakeholders. Federal funding for planning and
implementation continued in the second demonstration year ($2.8 million) and the State
contributed $0.9 million.
The State Long Term Care Ombudsman office, which functions as the demonstration’s
ombudsman or Prime Advocate, was awarded $246,493 in 2015 by CMS in collaboration with
the Federal Administration for Community Living (ACL). This office received $297,254 in 2016
and the same amount in 2017 to support these services.
10
[This page intentionally left blank.]

11
2. Integration of Medicare and Medicaid
This section provides an overview of the management structure that was created to
oversee the implementation of the demonstration and discusses in greater detail the organization,
geographic coverage areas, and the four initial Healthy Connections Prime plans that were
selected to integrate and deliver the Healthy Connections Prime. It also provides a general
description of the other functions (e.g., care coordination, eligibility, enrollment, quality
management, and financing) that SCDHHS, CMS, and the plans had to coordinate or integrate as
part of the implementation of the demonstration. Later sections provide more in-depth discussion
of the implementation successes and challenges associated with the integration of these
functions.
2.1 Joint Management of Demonstration
The CMS-State contract management team (CMT) monitors the MMPs and oversees
nearly every aspect of the demonstration including marketing, enrollment, grievances and
appeals, and the MMPs’ compliance with providing certain services within required timeframes.
The CMT is responsible for monitoring to ensure that State and CMS policies are integrated, to
respond to MMPs’ questions and concerns, and to identify areas for technical assistance.
The CMS team members initially included two representatives from the MMCO, one
Consortium for Medicare Health Plans Operations (CMHPO) staff, and one Consortium for
Medicaid and Children’s Health Operations (CMCHO) staff. By 2017, the MMCO and CMCPO
staff members participated. State members of the CMT include several core Healthy Connections
Prime team members, and, depending upon the discussion topic for the meeting, other key State
Highlights
• Medicare-Medicaid Plans (MMPs) provide the administrative structure to integrate the
financing and delivery of primary and acute care, behavioral health, and long-term
supports and services (LTSS).
• The slow rollout of the demonstration, due to the passive enrollment delay, provided
time for the MMPs to receive training and hone their skills in LTSS and HCBS waiver
services.
• Advicare, one of the four original MMPs, left the demonstration effective August 31,
2016. Most enrollees who had been covered by Advicare were transferred to other
MMPs. As of December 2017, 39 of the 46 counties were covered by the
demonstration.
• MMPs satisfied their provider network requirements despite hesitant participation by
some providers—including hospitals, nursing facilities, and personal care providers—
due to their fear of managed care. MMPs have used single-case contracting to provide
continuity of care of enrollees and to build relationships with providers.
12
staff. The State’s Prime Advocate or ombudsman for Healthy Connections Prime, who is in the
Long Term Care Ombudsman office in the State’s Office on Aging, joined the CMT in March
2015.
Noting their limited Medicare expertise, State staff reported they relied on the knowledge
of the CMS CMT members to provide details and context of various Medicare regulations and
requirements. MMP interviewees reported that they appreciated the CMT’s quick responses to
policy and procedural issues as a result of having Medicare, Medicaid, and State staff available
in the same meeting. All parties remarked on the effectiveness of this “team approach.” The team
initially met bi-weekly with each MMP to review activities, to provide them with feedback
reports to help them benchmark their performance, and to respond to questions.
As the demonstration has evolved, so have the activities of the CMT. By 2017, the CMT
was meeting monthly with each plan. The monthly, State-led operational meeting with all plans
discusses the MMPs’ operations reports that show monthly trends of (1) the ratio of care
coordinators to active enrollees; (2) enrollee counts of those receiving flexible or waiver-like
services; (3) open and closed grievances and appeals; (4) issues tracking by low, medium, and
high priority areas, and other relevant topics. This report also includes the results of MMPs’ exit
interviews with enrollees who have disenrolled from each plan.
2.2 Overview of Integrated Delivery System
2.2.1
Healthy Connections Prime Plans
After a competitive bidding process and extensive readiness reviews, South Carolina and
CMS contracted with four Medicare-Medicaid Plans (MMPs), (originally known as Coordinated
and Integrated Care Organizations or CICOs) to authorize, integrate, and coordinate the full
range of Medicare and Medicaid services including primary, acute, and behavioral health care,
and institutional and community-based LTSS, and a new palliative care benefit. The four MMPs
had extremely varied backgrounds; two had extensive experience with Medicaid managed care in
the State. Three did not have State experience integrating Medicare and Medicaid services in a
product such as a D-SNP; one had minimal experience (see Table 1). At the start, the
demonstration covered 41 of the 46 counties; after the Advicare departure 39 counties were
covered. For further discussion of the Advicare departure and the effect on enrollment, see
Section 3, Eligibility and Enrollment.
2.2.2
Provider Arrangements and Services
Plans noted that outside of the three main metropolitan areas (Charleston, Columbia, and
Greenville), most of the counties are rural and have a limited range of specialists, yet MMPs are
required to contract with a full complement of providers in most specialties in each county. Plans
pointed out that some counties do not have cardiologists or oncologists, which precluded the
MMP from operating in particular counties. MMPs believed that these requirements were too
stringent given the number of small counties in the State, and noted that providers located in a
neighboring county might be closer to a beneficiary than providers located in the beneficiary’s
home county. Nevertheless, MMPs contracted with a sufficient number of primary and specialty

13
providers to fulfill the CMS minimum network adequacy requirements prior to the start of the
demonstration.
Table 1
Healthy Connections Prime MMP profiles
Parent
company
Healthy
Connections
Prime MMP
No. of
counties
served as
of January
2016*
No. of counties
served as of
December 2017
Previous
experience with
Medicare
Advantage or
D-SNP
Previous
experience with
Medicaid
managed care
National
chain
Centene
Corporation
Absolute Total
Care (ATC)
32 35 No Yes Yes
Spartanburg
Regional
Healthcare
Advicare
Advocate**
39 0 No Yes No
Molina
Healthcare
Molina
Healthcare of
South Carolina
22 29 No Yes Yes
AmeriHealth
Caritas
Select Health of
South Carolina
38 39 Yes Yes Yes
* Total of 46 counties
** Advicare left the demonstration after its purchase by WellCare Health Plans, Inc., in August 31, 2016.
SOURCE: SCDHHS monthly enrollment dashboards (South Carolina 2018).
Provider reluctance. As discussed in Section 1.4, Overview of State Context, some
providers were reluctant to contract with MMPs, explaining that this was due to the poor
reputation of Medicare Advantage plans operating in the State. Other providers noted their lack
of experience with, and a general fear of, managed care plans. These factors contributed to
MMPs’ difficulty in developing robust provider networks with which they could develop value-
based purchasing agreements. See Section 7, Financing and Payment for more on this topic.
Con
tin
uity of care. Although skilled nursing facilities, individual providers, and some
large healthcare networks declined to enter into contractual arrangements with MMPs, they
chose to enter into single case contracting with MMPs as needed. The demonstration’s continuity
of care provision allows for enrollees to continue seeing their previous provider up to six months
prior to transitioning to a Healthy Connections Prime provider (SCDHHS, 2017). In RTI’s
annual site visit interviews, the team consistently heard from MMPs that most providers readily
engaged in single case agreements for enrollees as needed. The MMPs used these agreements to
build relationships with providers that often led to full contracts.
Behavioral health providers. Plans contracted with the State Department of Mental
Health (DMH) for the provision of behavioral health services in their community health centers
located in each county. Because of limited capacity of these providers and low utilization by
aging beneficiaries, the State encouraged MMPs to also contract with private behavioral health
providers. MMPs may, but are not required to, contract with the Department of Alcohol and

14
other Drug Abuse Services, which provides treatment for substance use; they also contract with
private providers for these services.
By summer of 2016, of the more than 9,000 enrollees, only 149 (1.7%) were receiving
services from DMH providers. By 2017, the State and the plans reported low overall utilization
of mental health and behavioral health services. Challenges included the State’s lack of capacity
to serve the aging population; the DMH’s reported reluctance to treat beneficiaries who have a
primary diagnosis of dementia; and providers’ focus on disruptive behavior, while conditions
such as depression were under-treated (please see Section 5, Beneficiary Experience for more
on this topic).
Transition of HCBS waiver services. A key feature of the South Carolina
demonstration is the transition of HCBS waiver roles and responsibilities from the State to the
MMPs. The SCDHHS Community Long Term Care (CLTC) division has had responsibility for
these functions for the three waiver populations included in the demonstration. The phased
transition process, developed with significant stakeholder input, was designed to systematically
introduce these functions to the MMPs while preserving the State’s authority until each MMP
demonstrated readiness. Table 2 shows the transition schedule for HCBS waiver functions.
Table 2
Transition of HCBS waiver functions from State to MMP
HCBS waiver functions
Phase I
February 2015
Phase II
September 2016
Phase III
April 2017
HCBS provider credentialing/monitoring State State
State; MMP may
choose responsibility
HCBS provider contracts State MMP MMP
HCBS care plan development & authorization
State with MMP
formal input
MMP with State
approval
MMP with State
approval
Oversight of State waiver case manager’s
participation in multidisciplinary team
MMP MMP MMP
HCBS provider rate setting State
MMP within State
guidelines
MMP within State
guidelines
HCBS claims processing via Care Call and
provider payments
1
State MMP MMP
1
LTC level of care assessments State State State
LTC level of care reassessments State MMP MMP
2
Self-directed attendant care and related
functions
State State State
3
HCBS = home and community-based services; LTC = Long term care; MMP = Medicare-Medicaid Plan.
1
Per mutual agreement, the State has retained responsibility for processing HCBS provider payments; MMPs’
Medicaid capitation includes HCBS; therefore, these payments are subsequently reconciled
2
Effective July 1, 2018, MMPs are responsible for approving the LTC reassessments.
3
The July 1, 2018 contract amendment lists the MMP as having this responsibility for Phase III although the State
will continue to have responsibility.
SOURCES: CMS amendment to South Carolina three-way contract (July 1, 2018) and South Carolina Healthy
Connections Prime Demonstration contract re-execution (November 1, 2017).
15
Phases 1, 2, and 3 were originally scheduled to be completed by December 2015, June
2016, and December 2016, respectively, but were adjusted due to the delay in passive
enrollment. Approximately 200 of the 1,800 beneficiaries (11.1%) who opted into the
demonstration during the first year were HCBS waiver participants. After the April and July
2016 passive enrollment waves, approximately 1,500 waiver participants joined the
demonstration. By December 2017, 1,738 waiver participants were enrolled. Section 4, Care
Coordination discusses the transition of HCBS waiver enrollee care management from provision
solely by the CLTC case managers to joint provision with the MMP care managers.
2.2.3
Training and Support for Plans and Providers
The State engaged the University of South Carolina’s Office for the Study of Aging to
train MMPs on HCBS and LTSS service provision, services that were new to them. This and
other trainings (e.g., assessment process, care planning, and dementia care), began in 2015 and
continued throughout 2016. Electronic copies of the trainings were subsequently available to
MMP staff. MMPs reported that the training was comprehensive and well-delivered. In addition
to trainings provided by the State’s contractor, MMPs track and report ongoing trainings their
staff receive on monthly reports submitted to the CMT. Providers such as nursing facility staff
and personal care providers, who were new to managed care, were also provided formal training
on the demonstration by the State’s training contractor. Plans and providers were also invited to
attend learning collaboratives and other related trainings provided by the Office for the Study of
Aging at the University of South Carolina. For more on this topic, please see Section 6,
Stakeholder Engagement.
An important element of MMP training for HCBS service provision related to Phoenix,
the State’s automated HCBS waiver case management and service authorization system. This
data system maintains records of essential functions, including all intake, assessment, and care
planning activities; it includes a section for home assessment data, caregiver supports, and
quality indicators. Phoenix has capacity for provider notes, correspondence among users, and
various features (e.g., alerts for follow-up appointments) can be built in to ensure compliance
with Federal regulations, State policies, or programs. The system also includes a method to
identify waiver participants at risk for missed in-home visits and those most at risk in the event
of natural disasters. CLTC program staff and developers expanded Phoenix and tailored it to the
needs of the demonstration.
Plans are required to use Phoenix as a centralized electronic record system to document
all assessments, individual care plans, provider information, caregiver support systems, waiver
case management, and quality assurance activities for demonstration enrollees. The State
maintains the system and may monitor enrollee data entered by plans and use it to generate
reports. Security is tailored to allow users access only to needed sections.
The Care Call feature of Phoenix automates prior authorizations of specific services and
provides real time service monitoring and billing. For example, upon starting and ending their
tasks, home care workers call a toll-free number to document services delivery or they may use
an application in their smartphones to report their hours worked for a particular enrollee. If Care
Call’s GPS system detects that the worker is not in the vicinity of the enrollee’s home, it triggers
a review of the worker’s hours and functions. Services are linked with the prior authorization to
16
ensure appropriateness of services and Care Call generates weekly electronic billing to MMIS
for those services.
2.3 Major Areas of Integration
Benefits. Beneficiaries may enroll in the demonstration, through the State’s enrollment
broker, to receive integrated Medicare and Medicaid benefits. Their benefits, including the new
care coordination, palliative care, and additional flexible benefits are coordinated by one MMP.
See Section 1.2, Model Description and Goals and Section 4, Care Coordination.
Quality. Four activities comprise the demonstration’s quality oversight: (1) joint
monitoring and oversight by the State and CMS, (2) external quality review activities conducted
by the External Quality Review Organization, (3) quality and performance improvement
initiatives undertaken by the plans, and (4) quality reporting and measurement (see Section 9,
Quality of Care).
Financing. Healthy Connections Prime plans are paid a blended, risk-adjusted capitated
rate covering all Medicare and Medicaid services. Medicare Parts A and B and Medicaid
payments reflect the application of savings percentages and quality withholds (see Section 7,
Financing and Payment).

17
3. Eligibility and Enrollment
3.1 Introduction
This section provides an overview of the enrollment process for Healthy Connections
Prime. Eligibility for the demonstration, enrollment phases, and the passive enrollment process
are included in this section. Enrollment data are presented and factors influencing enrollment
decisions are also discussed.
3.2 Enrollment Process
3.2.1
Eligibility
Full benefit Medicare-Medicaid enrollees aged 65 or older and living in the community at
the time of enrollment are eligible to enroll in Healthy Connections Prime. Beneficiaries
participating in the Community Choices, HIV/AIDS, or Mechanical Ventilation Dependent
waiver programs for home and community-based services (HCBS) are eligible for the
demonstration. Individuals who transition from a nursing facility into the community, and are
otherwise eligible, may elect to enroll in the demonstration. Individuals already enrolled who
later enter a nursing facility may remain in the demonstration (MOU, 2013, p. 10). Any enrollee
residing in a nursing facility for more than 90 days before transition from that facility also may
Highlights
• Legislative action that delayed the start of passive enrollment for 1 year prohibited the
demonstration from growing and expanding during this critical period.
• After passive enrollment occurred in two waves in 2016, it continued for beneficiaries
who aged in or otherwise became eligible for the demonstration. This supported
sustained enrollment as other enrollees left the demonstration when they became
ineligible through loss of Medicaid, moved out of the demonstration counties, or died.
• While the State considered a change to another model that might include the
demonstration population, it suspended passive enrollment for 7 months beginning
January 2017. This resulted in reduced overall enrollment and created concern among
plans and stakeholders about the demonstration’s viability. It was not clear if
beneficiaries were aware of this uncertainty.
• From the beginning of the demonstration through 2017, plans and stakeholders
reported negative behavior by Medicare Advantage plan representatives. Reportedly,
representatives provided incorrect information to beneficiaries about the status and
future of Healthy Connections Prime with the intent of attracting beneficiaries away
from the demonstration. CMS investigated these allegations.
• Limitations of the State’s eligibility system posed challenges for identifying eligible
beneficiaries, particularly those in nursing facilities.
18
qualify for the State’s Money Follows the Person (MFP) Rebalancing demonstration, called
Home Again (South Carolina three-way contract, 2014, p. 97). As of December 2017, no
demonstration enrollees had also qualified for or participated in the MFP demonstration.
During the initial planning stages of the demonstration, the State estimated 53,600
beneficiaries might be eligible for the demonstration. This figure was adjusted downward for a
number of reasons. While the State considered approximately 17,000 enrollees receiving
comprehensive benefits in other Medicare products (e.g., Medicare Advantage) eligible to opt in,
the evaluation does not consider these enrollees eligible for the demonstration while they are
enrolled in another product. Another 7,581 beneficiaries were residents of counties where none
of the MMPs had an approved provider network at the beginning of the demonstration. In
October 2015, the State estimated that approximately 27,000 beneficiaries met the CMS and RTI
definition for eligibility in the demonstration. This number included approximately 6,000
beneficiaries participating in the low income subsidy (LIS) program for their Medicare Part D
benefits. The number of eligible beneficiaries slowly decreased, and by mid-2016 the number
stabilized to approximately 20,000. Table 5 shows the number of eligible beneficiaries in the
span of the demonstration through December 2017.
MMPs entered into the three-way contracts, developed their Healthy Connections Prime
products, and contracted with providers, based on expectations of approximately 53,600
beneficiaries who would be eligible for the demonstration. With enrollment limited to opt-in
enrollment during the first year, enrollees in each of the four MMPs ranged from approximately
200 to 600 and totaled approximately 1,800. By December 2017, enrollment totaled
approximately 11,500, with 3,000 to 5,100 enrollees in each of the three plans. During RTI
interviews in each year, MMP officials expressed their concern and frustration about their
increased level of effort and reporting requirements with so few enrollees. Plans had expected at
least 12,000 enrollees each, but had fewer than half of that number. For further discussion on this
topic, see Section 7, Financing and Payment.
3.2.2
Phases of Enrollment
According to the three-way contract, the MMPs were to begin opt-in enrollment on
January 1, 2015. Subsequently, this was delayed by 1 month. SCDHHS sent an opt-in welcome
letter to all beneficiaries eligible for Healthy Connections Prime in late 2014 for the start of the
demonstration on February 1, 2015. Approximately 1,200 enrollees signed up in the first month
and that number increased and held to approximately 1,800 throughout the first year of the
demonstration prior to the initiation of passive enrollment. This number included about 200
HCBS waiver enrollees.
In the spring of 2015, shortly before the mailing of 60-day notices to eligible
beneficiaries to begin passive enrollment, the State legislature introduced legislation to delay the
start of passive enrollment until April 1, 2016, stipulating that participation in Healthy
Connections Prime would be limited to individuals who affirmatively elect to participate (South
Carolina Senate, 2015). Therefore, the demonstration had 14 months of opt-in enrollment prior to
the start of passive enrollment. This unexpected legislation upended the Healthy Connections
Prime team’s passive enrollment plans and the MMPs’ expectation for enrollments and required
both to drastically revise their projections and rework their strategies.

19
To encourage beneficiaries to opt into the demonstration during these 14 months prior to
the start of passive enrollment, the State engaged in several activities. The demonstration team
and its contractors made presentations at events to educate potential enrollees, approached
providers to join the demonstration, revised beneficiary materials to improve readability, and
surveyed disenrollees to understand their disenrollment reasons. Although there was marginal
success in enrollment opt-ins during this period, there were also significant disenrollments due to
beneficiaries becoming ineligible, moving out of coverage areas, and death. The State also
conducted outreach to LIS beneficiaries to attract them to the demonstration during their annual
enrollment period. The State reported that this effort to enroll this difficult to reach population
was not successful.
Passive enrollment began with two waves in April and July 2016 in the upstate and
coastal counties and the HCBS population (see Table 3). The 46 counties in the State are
designated geographically as upstate (or inland) counties and coastal counties. The former are
situated in the northwestern region that includes Columbia, the State capitol; coastal counties are
located in the southeastern part of the State that includes Charleston. Enrollees in the upstate
region were passively enrolled with an effective coverage date of April 1, 2016, and those in the
coastal counties began their coverage on July 1, 2016. Also included in the July coverage date
were beneficiaries who receive HCBS waiver services from SCDHHS. After the two initial
waves, ongoing passive enrollment continued in November 2016 as beneficiaries became eligible
for the demonstration (e.g., when they moved into demonstration counties, became dually
eligible for Medicare and Medicaid).
Table 3
Healthy Connections Prime enrollment phases
Population
Opt-in
enrollment
began
Initial passive
enrollment
schedule
Passive
enrollment
occurred
Ongoing
passive
enrollment
paused
Ongoing
passive
enrollment
resumed
Upstate (inland) region February 1, 2015 June 1, 2015 April 1, 2016 January 1, 2017 August 1, 2017
Coastal region February 1, 2015 August 1, 2015 July 1, 2016 January 1, 2017 August 1, 2017
HCBS enrollees February 1, 2015 October 1, 2015 July 1, 2016 January 1, 2017 August 1, 2017
N.B., dates are effective enrollment dates. Ongoing passive enrollment refers to passive enrollment of beneficiaries
who are newly eligible for the demonstration.
SOURCE: State enrollment schedules.
Beneficiaries who were passively enrolled received 60- and 30-day notices that explained
the benefits of the demonstration. SCDHHS utilized an intelligent assignment algorithm to
identify the best MMP to meet the needs of enrollees. The methodology included existing
provider relationships, previous history with an MMP product, and household members who
were assigned to a MMP (South Carolina three-way contract, 2014, p. 29). Beneficiaries could
select an MMP; if they did not select one, they were assigned, using the intelligent assignment
algorithm, to one that contracted with the prospective enrollee’s usual source of care. Enrollees
could opt out of the demonstration prior to passive enrollment or disenroll at any time; they
20
could also change MMPs, and beneficiaries who opt out of Healthy Connections Prime may
reenroll at any time as long as they still meet the eligibility requirements.
Advicare departure. Advicare’s MMP was included in the demonstration from the start.
When Advicare’s Medicaid managed care product was purchased by WellCare, Inc., the MMP
was disbanded and the company withdrew from the demonstration effective August 31, 2016.
The State and Advicare began informing enrollees and beneficiaries slated for passive enrollment
into Advicare as early as June 2016. Approximately 3,100 Advicare enrollees and prospective
enrollees were absorbed by the three remaining MMPs in counties that had at least two MMPs.
The remaining 460 Advicare members affected by the departure were enrolled into Healthy
Connections Medicaid and fee-for-service Medicare with Part D plans, because they lived in
counties where no or only one MMP was available. Beneficiaries living in counties in which one
MMP operated (420 beneficiaries) were given the opportunity to opt into the demonstration.
Passive enrollment suspension. In fall 2016, while the State considered a change to an
MLTSS model for this population, the Medicaid Director suspended passive enrollment into
Healthy Connections Prime effective January 2017. Subsequently, a new administration decided
to proceed with ongoing passive enrollment which resumed in August 2017. Please see
Section 1.4, Overview of State Context for background on this topic.
3.2.3
Passive Enrollment Experience
During the April and July 2016 waves of passive enrollment, approximately 7,100 new
beneficiaries were enrolled into Healthy Connections Prime, bringing total enrollment to 9,002
by August 2016, approximately 44 percent of those eligible.
The State undertook several efforts to understand the reasons for enrollees disenrolling
from the demonstration after they had opted in, and for opting out after they had been passively
enrolled. The State’s contractor, Clemson University, conducted a survey in spring 2015, and SC
Thrive, the State’s outreach contractor, conducted a second survey in July 2016 after the first
wave of passive enrollment. The State also analyzed its own data on cancelations and opt-outs to
understand any emergent patterns. Later, in spring 2017, MMPs conducted exit interviews of
their members who had disenrolled. All analyses found that beneficiaries opted out of the
demonstration primarily because they were satisfied with their provider and their provider was
not in the network of any of the MMPs.
Secondary issues for disenrollment had to do with confusion about some of the language
used in marketing materials and concerns about loss of Part D benefits. During the 2016 passive
waves, State officials, plans, and stakeholders reported confusion among beneficiaries when
individuals scheduled for passive enrollment received disenrollment notices from their Part D
prescription drug plans before they received Healthy Connections Prime passive enrollment
notices and materials. This generally prompted prospective enrollees to cancel their enrollment,
believing they would lose their Part D prescription drug plan. To mitigate this concern, CMS and
the State worked together to revise notices, making it clear that the demonstration included Part
D benefits. CMS worked to develop new scripts for 1-800-Medicare staff. When misinformation
from Part D plans was reported, CMS followed up with “secret shopper” calls. After the first
wave of passive enrollment MMPs began making early welcome calls to enrollees within 3 days
21
of receiving new enrollee data from the State. During the calls, MMP staff educated the new
enrollees and confirmed all benefits, including the Part D benefits that they have through the
MMP. This activity has continued for all subsequent new enrollees.
Another effort to improve beneficiary understanding related to language and marketing
came from beneficiary feedback regarding confusion about the demonstration’s benefits and how
they differ from the State’s Medicaid program, Healthy Connections. This confusion prompted
some beneficiaries to disenroll from the demonstration because they did not distinguish Healthy
Connections from Healthy Connections Prime. To try to differentiate the two products and
explain the benefits of Healthy Connections Prime, the demonstration team redesigned the
demonstration website and developed new marketing and outreach materials written in a simpler
language and format.
3.2.4
Integration of Medicare and Medicaid Enrollment Systems
The Healthy Connections Choices Customer Service Center is operated by the State’s
enrollment vendor, Maximus, which was trained by the State on the details of Healthy
Connections Prime. Beneficiaries may call the service center for options counseling and to
enroll. Maximus developed generic materials presenting enrollment options for eligible enrollees
(South Carolina SCDHHS, n.d., p. 2). The options counselor, SC Thrive, is also responsible for
assisting enrollees who wish to transfer to a different MMP.
SC Thrive is a beneficiary advocacy organization that provides education and outreach
activities throughout the State about a range of Federal and State programs. Contracted by the
State to add online enrollment in Healthy Connections Prime and outreach to eligible
beneficiaries, it provides individual in-person options counseling with someone to answer
questions and concerns, walk beneficiaries through the enrollment process, and provide a “warm
hand-off” (e.g., a person-to-person transfer from the counselor) to the enrollment broker to
complete the enrollment process. Additional information on beneficiary education and
engagement is provided in Section 5, Beneficiary Engagement.
3.2.5
Contacting and Locating Enrollees
As the first step in coordinating care for new demonstration enrollees, a care manager
contacts the enrollee to conduct a health risk assessment. (Please see Section 4.1.1, Assessments,
for more information on this topic). Table 4 displays the percentage of members that MMPs
were unable to reach within the first 3 months of enrollment. During 2015, these percentages
were relatively low, reflecting that all enrollees had opted into the demonstration in that year.
However, when passive enrollment began in the second quarter of 2016, MMPs began to have
difficulty contacting enrollees due to incomplete, erroneous, or outdated contact information.
The percentage of members that MMPs were unable to reach within 90 days of enrollment
increased to a high of 26.4 percent (979 of 3,707 enrollees) in quarter 3 of 2016.
Plans used vendors or their own care managers or community navigators to visit the
previous addresses and ask neighbors where to find the new enrollees. They found that some had
moved to a nursing facility, a community residential care facility, or the home of a family
member. Because there were fewer new enrollees after passive enrollment was suspended in
January 2017, MMPs were able to reach their new enrollees more easily. But after passive

22
enrollment was resumed in August 2017, plans had difficulty reaching all 3,870 new enrollees
whose 90
th
day of enrollment occurred in quarter 4 of 2017, and the percentage of members that
MMPs were unable to reach increased to 38.7.
Table 4
Percentage of members that Healthy Connections Prime plans were unable to reach
following three attempts, within 90 days of enrollment, by quarter
Quarter CY 2015 CY 2016 CY 2017
Q1 N/A 6.6% 25.8%
Q2 7.6% 21.9% 14.4%
Q3 4.7% 26.4% 13.3%
Q4 6.8% 19.3% 38.9%
CY = calendar year.
NOTES: N/A indicates data are not applicable. Advicare withdrew from the demonstration and is not included in
data after Q3 2016.
SOURCE: RTI analysis of MMP reported data for Core Measure 2.1 provided to RTI as of October 2018. The
technical specifications for this measure are in the Medicare-Medicaid Capitated Financial Alignment Model Core
Reporting Requirements document, which is available at:
https://www.cms.gov/Medicare-Medicaid-
Coordination/Medicare-and-Medicaid-Coordination/Medicare-Medicaid-Coordination-
Office/FinancialAlignmentInitiative/MMPInformationandGuidance/MMPReportingRequirements.html
3.3 Summary Data
As of December 2017, approximately 11,511 beneficiaries were enrolled in the Healthy
Connections Prime demonstration, representing about 56 percent of the eligible population.
Table 5 displays how key events, discussed in this section, have affected enrollment in Healthy
Connections Prime. By January 2016, after 12 months of opt-in only enrollment, total enrollment
was 1,773 or approximately 7 percent of those eligible for the demonstration. The April and July
2016 waves of passive enrollment increased enrollment to more than 44 percent of those eligible,
but after the departure of one MMP and the suspension of passive enrollment, the percentage of
eligible beneficiaries enrolled in the demonstration dipped to approximately 37 percent by July
2017. After passive enrollment resumed, enrollment reached more than 11,000 from August
through December 2017.

23
Table 5
Key events affecting enrollment and percentage enrolled in Healthy Connections Prime
Enrollment dates and key events
Beneficiaries
eligible for the
demonstration Enrollment
Percentage
enrolled
January 2016; after 12 months of opt-in only enrollment 24,809 1,773 7.1
August 2016; after April and July 2016 passive enrollment waves 20,288 9,002 44.4
October 2016; effect of August 2016 Advicare departure 20,802 7,862 37.8
January 2017; suspension of passive enrollment 20,898 8,981 43.0
July 2017; effect of 7 months without passive enrollment 20,901 7,818 37.4
August 2017; passive enrollment resumed 20,320 11,468 56.4
December 2017; ongoing passive enrollment 20,726 11,511 55.5
SOURCE: RTI State Data Reporting System; data are reported on the last day of each month.
As of December 2017, State data indicate that approximately 16 percent of enrollees had
opted into the demonstration; the remainder had been passively enrolled. Select Health provided
care to approximately 44 percent of enrollees, and ATC covered 30 percent; the remaining 26
percent were covered by Molina. Although churning had been reported by MMPs in 2016 with
enrollees switching plans frequently, this had stabilized and there were no reports of churning in
2017.
State data also show that 15 percent of all enrollees were enrolled in one of the three
HCBS waivers (two enrollees were in the Mechanical Ventilator Dependent waiver; 30 enrollees
were in the HIV/AIDS waiver, and 1,706 enrollees were in the Community Choices waiver).
Only two percent of all enrollees were in a skilled or a long-stay nursing facility as of December
2017 (SCDHHS, 2017).
24
[This page intentionally left blank.]

25
4. Care Coordination
4.1 Care Coordination Model
This section provides an overview of the demonstration requirements related to the care
coordination function, including assessment processes; use of multidisciplinary teams (MT) and
the development of individual care plans (ICP); delivery of care coordination services; and the
role of care managers. The experience of Medicare-Medicaid Plans (MMPs) are included in this
section as is the care coordination of LTSS and behavioral health services and data exchange.
On July 1, 2018, CMS announced contract amendments that include a reduction in a
number of requirements for conducting assessments (CMS, 2018a). These changes will be
discussed in future RTI reports. The descriptions below cover the period through 2017.
Care coordination, a central function of Healthy Connections Prime, is provided by the
plans to all enrollees through care coordinators, referred to in South Carolina as care managers,
and multidisciplinary care teams. The plans’ care coordination models are intended to be person-
centered, to promote enrollees’ ability to live independently, and to coordinate the full set of
Medicare and Medicaid benefits, including medical, behavioral health, LTSS, and social support
Highlights
• Every Healthy Connections Prime enrollee has a care manager to coordinate needed
services identified by the enrollee, provider, or care manager. Plan community health
navigators support the manager and the enrollee by connecting enrollees with
community-based services.
• In-home assessments, including the evaluation of social determinants of health, are an
essential component of developing an individual care plan for demonstration
enrollees. Care plans, which include language, culture, and service history of each
enrollee, and identify medical, behavioral, functional, and psychosocial needs of the
enrollee, are developed by the enrollee, his/her family supports, the care manager, and
providers.
• Enrollees who also participate in the three home and community-based waivers have
access to both a plan care manager and a State waiver case manager to manage their
medical, behavioral health, and long-term services and supports needs. By 2017, the
roles and responsibilities of these two types of managers have been clearly delineated
to improve support for enrollees.
• Phoenix, the State’s electronic case management and service authorization system,
was modified to meet the demonstration’s needs, including recording all care planning
activities. Plans reported the system was cumbersome and redundant with their own
data systems. In summer 2018, the State agreed to reduce some reporting
requirements.
26
services. The State’s Division of Community Long Term Care (CLTC) case managers have
extensive experience in coordinating care for HCBS waiver enrollees, supported by the State’s
Phoenix case management and Care Call reporting systems. Plan care managers are required to
utilize these systems for assessments, documentation and coordination of services for
demonstration enrollees (South Carolina three-way contract, 2014, p. 57).
Care managers. Care managers, the primary point of contact for the enrollee, are
responsible for ensuring that the initial screen, comprehensive assessment, and ICP are
completed pursuant to the timeframes outlined in the three-way contract. This individual is also
the lead member of the multidisciplinary team, who engages all relevant providers and supports
to ensure coordinated care is provided to the enrollee. Care managers serving enrollees at
moderate to high risk must have a clinical background; those serving enrollees assessed as low
risk must have a bachelor’s degree at a minimum. Plans train all care managers in person-
centered planning, cultural and disability competencies, compliance with the Americans with
Disabilities Act, independent living and recovery, and wellness philosophies (South Carolina
three-way contract, 2014, p. 54). In addition, care managers participate in Dementia Dialogues,
“a structured dementia education program that supports a person-centered dementia care
framework developed by the Office for the Study of Aging and the University of South
Carolina” (Healthy Connections Prime, 2018). This training better equips care managers to
recognize the signs and symptoms associated with Alzheimer’s Disease and related disorders
(ADRD). It also teaches effective communication with caregivers of those affected by ADRD
and trains staff and caregivers how to respond appropriately to challenging behaviors by training
both “staff and caregivers to ‘step into the world’ of the person with dementia” (Curtis, 2017).
The care manager makes referrals, monitors outcomes, and communicates regularly with
the enrollee or the enrollee’s designated representative or informal caregiver about medical,
psychological, and social needs. These check-ins may be via phone or in person, depending upon
the enrollee’s preferences, and are conducted monthly for high risk enrollees and every 90 and
120 days for those stratified as low or moderate risk, respectively. An enrollee may request a
change in care managers at any time.
Healthy Connections Prime enrollees also have access to community health navigators.
Although the role of community health navigators is not defined in the three-way contract, all
three plans noted the importance of these individuals who are regionally located across the State.
Navigators are knowledgeable about local community or faith-based organizations that provide
supports, they work under the direction of the care manager and arrange for services or
accompany the enrollee to medical appointments. When visiting new enrollees in remote rural
areas, plans reported that it was more efficient to conduct the assessments with both the care
manager and the navigator present, to enable both individuals to develop rapport with enrollees
and begin connecting them to services immediately. Navigators may also accompany enrollees to
appointments with physicians and other providers.
4.1.1
Assessment
Risk stratification and the comprehensive assessment. Within the first 30 days of
enrollment, all enrollees participate, via phone or in person, in an initial health screen that
collects medical, psychosocial, LTSS, function, and cognitive needs, and determines low,
27
moderate, or high risk. All HCBS waiver enrollees are considered high risk. Each new enrollee
also participates in a comprehensive assessment of medical, behavioral health, community-based
or facility-based LTSS, and social needs within 60 days for high or moderate risk, or 90 days if
the enrollee was deemed low risk through the screener. Plans may elect to complete the
comprehensive assessment and the screener at the same time if they are completed within 60
days. Plans consistently reported that this was their preference, saying that it was more efficient
for both the enrollee and the care manager. The initial health screens were developed by
SCDHHS together with the plans, whereas the State’s assessment tool is required to be used for
the comprehensive assessment. Reassessments are required to be conducted every 12 months or
upon certain trigger events as specified in the three-way contract, e.g., transitions, changes in
diagnoses, etc. (CMS, September 5, 2014, pp. 58–63).
The comprehensive assessment includes social, functional, medical, behavioral, wellness
and prevention domains, caregiver status and capabilities, as well as the enrollee’s preferences,
strengths, and goals. All plans hired care managers on staff, but because the demonstration
covers extensive rural areas in the State, some plans initially contracted with home care and in-
home medical care service agencies located throughout the State to conduct the screenings and
assessments. Plan care managers generally conducted assessments except during waves of
passive enrollment, during which plans also engaged contractors in order to meet the assessment
completion requirements.
Plans reported some challenges reaching new enrollees to welcome them to the plan and
to conduct the initial health screen and assessment. Plans sent postcards or visited enrollees
whose enrollments had been completed without telephone numbers. CMS contract management
team members offered to provide addresses from the Social Security database, and the Medicaid
agency supplied provider contacts for the plans to obtain current contact information. Care
managers and community health navigators were generally able to reach new enrollees within
mandated time frames, according to both the plan interviewees and the CMS contractor’s
monitoring reports. By 2017, all plans had completed assessments within the required time
frames in order to meet the quality target. Please see Section 9, Quality of Care, for more
information on quality measures.
Table 6 shows the proportion of enrollees willing to participate in the assessment process,
who could be reached, and who completed assessments within 90 days of enrollment. Since the
second year of the demonstration, the proportion has consistently stayed above 90 percent. When
passive enrollment waves occurred, the percentage of all enrollees with assessments completed
within 90 days of enrollment declined (59.9 percent in quarter 3, 2016; 48.9 percent in quarter 4,
2017), reflecting the challenges in reaching enrollees (Section 3.2.5, Contacting and Locating
Enrollees).

28
Table 6
Total percentage of enrollees whose assessment was complete within 90 days of enrollment
Quarter
Total number of enrollees
whose 90th day of enrollment
occurred within the reporting
period
Assessment completed within 90 days of enrollment (%)
All enrollees
All enrollees willing to participate
and who could be reached
2015
Q1 N/A N/A N/A
Q2 1,470 72.8 80.8
Q3 321 74.1 79.3
Q4 177 83.1 89.6
2016
Q1 226 89.4 97.6
Q2 3,824 65.6 93.0
Q3 3,707 59.9 95.1
Q4 1,281 72.8 96.5
2017
Q1 1,874 63.8 92.1
Q2 181 75.1 95.8
Q3 180 73.9 91.7
Q4 3,870 48.9 95.3
NOTES: N/A indicates data are not applicable. Advicare withdrew from the demonstration and is not included in
data after Q3 2016.
SOURCE: RTI analysis of MMP reported data for Core Measure 2.1 pro
vided to RTI as of October 2018. The
technical specifications for this measure are in the Medicare-Medicaid Capitated Financial Alignment Model Core
Reporting Requirements document, which is available at:
https://www.cms.gov/Medicare-Medicaid-
Coordination/Medicare-and-Medicaid-Coordination/Medicare-Medicaid-Coordination-
Office/FinancialAlignmentInitiative/MMPInformationandGuidance/MMPReportingRequirements.html.
Home assessments and social determinants of health. Home assessments are not
delineated in the three-way contract; however, all plans and State officials noted that these were
essential when conducting comprehensive assessments. Interviewees reported that when visiting
new enrollees, particularly in remote rural areas, assessors evaluate the availability of basic
resources to meet the enrollees’ daily needs. Such resources included the availability of food,
presence of a working refrigerator, indoor plumbing, and safe housing features such as secure
doors. When these resources are lacking, community health navigators and the care managers
identify resources in the community to improve such conditions. The State, MMPs, and
providers all viewed assessments of these social determinants of health as essential for the
demonstration population because of rural isolation, lack of family or other informal caregiver
support, and general conditions of poverty of some enrollees. In addition to initial assessments,
enrollees must be reassessed within 365 days from the previous assessment. In 2016, MMPs
became responsible for the annual reassessments and reported frustration with this requirement,
believing that reassessments were unnecessary and time consuming for the majority of the
population. In late 2017, the State reported discussions of enrollee “assessment fatigue” from the

29
MMPs, especially for enrollees also being assessed for long-term services and supports (LTSS).
At that time, the State was examining the assessment requirements specifically for enrollees who
had been assessed as low risk.
LTSS assessment. Should long-term care needs be identified during the comprehensive
assessment, plan care managers input referrals for LTSS assessments into Phoenix within 24
hours of completion of the comprehensive assessment. The State’s CLTC care managers then
conduct LTSS assessments using a multifunctional tool that collects cognitive, functional, and
activities of daily living data about individuals who may require access to nursing facility or
HCBS waiver services. Level of care, service eligibility, and the service plan are recorded in
Phoenix, which can be accessed by all relevant parties. In 2017, CLTC care managers continued
to provide initial LTC assessments and determine LTC level of care during the Healthy
Connections Prime demonstration; however, plans became responsible for the annual
reassessments in 2016 (see Table 2, Transition of HCBS waiver functions from State to
MMPs).
4.1.2
HCBS Waiver Services and Coordination
Waiver service transition. As discussed in Section 2.2.1, Provider Arrangements,
transition of HCBS waiver services to the MMPs was a goal of Healthy Connections Prime.
Early in the demonstration, CLTC maintained responsibility for all waiver activities including
assessment, development, and monitoring of service plans for HCBS waiver participants who
enrolled in Healthy Connections Prime. After the plans developed expertise in these activities in
2016, the State transitioned most HCBS roles and responsibilities to the MMPs (see Table 2,
Transition of HCBS waiver functions from State to MMP).
As of December 2017, approximately 1,700 waiver participants were enrolled in the
demonstration, the vast majority of whom were in the Community Choices waiver. At that time,
applications for another 200 demonstration enrollees were being evaluated for HCBS waiver
participation. In fall of 2017, plans and the State noted that although there was not a formal wait
list, the HCBS waiver participation evaluation process was extremely protracted.
5
See Section 9,
Quality of Care, for a discussion on the issue of plans providing “waiver-like services” for these
enrollees while being reimbursed at the community rate.
Waiver participants may be passively enrolled or opt into Healthy Connections Prime, or
they may become eligible for one of the three HCBS waivers after enrollment in the
demonstration. As part of waiver participation, a CLTC waiver case manager is assigned to
support the long-term care needs of the waiver participant. When a waiver participant is also a
demonstration enrollee, the CLTC case manager works together with the plan’s care manager. In
2016, State and stakeholder interviewees reported that the delineation of responsibilities and
communication between the Healthy Connections Prime plan care managers and the CLTC
waiver case managers had become challenging. Insufficient clarity on the roles resulted in
tensions and inefficiencies. The State addressed this by convening multiple training sessions with
both groups of managers to discuss their roles and responsibilities and developed materials
providing guidance, outlining the roles and intersection of each type of manager (SCDHHS,
5
In 2018, the State worked to improve wait times by streamlining the process and engaging its outreach vendor to
assist enrollees with the waiver application process. Outreach work is expected to begin in 2019.
30
2017). The two types of managers are meant to work together, with the CLTC waiver case
manager providing expertise in LTSS, and the plan care manager providing ongoing support to
the enrollee regarding overall health care concerns, initially through in-home assessment and
subsequently with regular check-in interactions. All services authorized by the MMP are
reported to the CLTC case manager and they are input into Phoenix. In late 2017, as a result of
the State’s proactive approach, the concern about respective roles subsided. The State
subsequently surveyed both types of care managers and found that they each recognized and
understood the expertise and role of the other.
Transitional care. Initially Healthy Connections Prime team members worked with State
resources, stakeholders, and plans to develop transition planning policies and procedures to assist
enrollees and providers with enrollee management across settings (e.g., from home to nursing
facility). These include the identification of a key provider contact for clinical coordination
throughout the transition; inclusion of the multidisciplinary team in planning, coordination and
reassessment; coordination with the State’s Money Follows the Person (MFP) demonstration, as
appropriate; and protocol development for medication monitoring. Plan care managers report
transitions to and from hospital, nursing facility, and community settings in Phoenix, and plans
report transition data in their quarterly reports to the CMS implementation contractor (State-
specific reporting requirement S.C. 2.6). However, a CMT member reported in 2018 that it had
come to their attention that care managers are not always aware of hospitalizations. RTI will
cover this topic in future reports.
4.1.3
Care Planning Process
Interdisciplinary Care Teams (ICT)
The interdisciplinary care team, referred to as MTs in South Carolina, initially was
composed of the enrollee, his or her designated representative, the enrollee’s care manager,
primary care physician, and may include other physicians, physician assistants, long-term care
providers, nurses, specialists, pharmacists, behavioral health specialists, and/or social workers
appropriate for the enrollees’ diagnoses, health conditions, and community support needs. Led
by the care manager, the team may assist develop, implement, and periodically review the
enrollee’s ICP, which is designed to meet the enrollee’s medical, behavioral, LTSS, and social
needs. The plans have reported difficulty engaging primary care physicians (PCP) in the MTs
because PCPs are not compensated for participation. When an enrollee’s PCP is unable to
participate in the MT, the plan’s medical director may participate instead. In all scenarios, the
enrollee signs off on their own care plans. The November 2017 contract amendment made PCP
attendance at these meetings optional.
MTs authorize services and these authorizations may not be modified by the plan;
enrollees and their designated representatives may appeal these service determinations. MTs
meet in person or in phone meetings, and they may communicate within the Phoenix system;
they focus on both medical and social needs. All members of the MT are expected to be familiar
with principles of person-centered care, cultural competence, accessibility, independent living
and recovery, and wellness. If MT members are unfamiliar with these topics, plans are required
to provide training (South Carolina three-way contract, 2014, p. 46). The State allows flexibility
31
in how the MTs operationalize their meetings. By the fall of 2017, plans described these
meetings as “part of the culture” of developing care plans for their enrollees.
The ICP includes language, culture, and service history of each enrollee, and identifies
medical, behavioral, functional, and psychosocial needs of the enrollee. Within 90 days of
enrollment, the ICP is developed as much as possible by the enrollee and his/her family supports,
the care manager, providers, and members of the multidisciplinary team. Measurable short and
long-term services and goals, preferences, and expected outcomes are the key elements of ICPs
that are updated in Phoenix and monitored according to risk level. ICPs of high, medium, and
low risk enrollees are monitored by the plan at 30, 60, and 120 days, respectively, and concerns
are addressed by the MT.
Table 7 presents the total number and percentage of enrollees with a completed ICP for
each quarter of 2015–2017, beginning quarter 2, 2015. Among all enrollees, the percentage of
enrollees with an ICP completed within 90 days of enrollment varied over the course of the
demonstration. Enrollees who the MMPs were able to reach within the first 90 days and who
agreed to complete a care plan ranged from a low of 69 percent when passive enrollment began
(quarter 2, 2016) and increased steadily to 94 percent in the last quarter (quarter 4. 2017) of this
period. (Table 4 in Section 3.2.5, Contacting and Locating Enrollees, displays percentages of
new enrollees who plans were unable to reach within the first 90 days).
Care Coordination at the Plan Level
Plans are required to report to CMS’ implementation contractor (NORC) the ratio of care
managers to enrollees. As shown in Table 8, in 2015 there were 24 full time equivalent care
managers in Healthy Connections Prime plans who were responsible for approximately 90
enrollees each. By 2017 the number of care managers increased to 94, each with an average case
load of 132 enrollees. Plans reported challenges retaining care coordinators due to the high
demand for this type of position in the State and long driving distances. Care manager turnover
was high in the first 2 years (29 percent and 36 percent in 2015 and 2016 respectively), but
decreased to 12 percent by the end of 2017. Each plan organizes its care coordination staff
differently, with some using vendors for initial assessments, particularly during passive
enrollment periods, as well as utilizing support staff to make phone call reminders and conduct
other supportive tasks. Community health navigators are not included in these figures.

32
Table 7
Members with care plans within 90 days of enrollment
Quarter
Total number of enrollees whose
90th day of enrollment occurred
within the reporting period
Care plan completed within 90 days of enrollment (%)
All enrollees
All enrollees not documented as
unwilling to complete a care plan
or un-reachable
2015
Q1 N/A N/A N/A
Q2 1,506 82.7 89.1
Q3 322 74.8 84.3
Q4 181 86.7 95.7
2016
Q1 230 90.0 97.6
Q2 3,836 51.3 69.1
Q3 3,711 57.3 90.5
Q4 1,331 71.3 92.7
2017
Q1 2,072 65.8 90.6
Q2 190 64.7 85.4
Q3 184 71.2 89.1
Q4 4,226 48.0 94.0
N/A = data are not applicable.
SOURCE: RTI Analysis of MMP reported data for State-specific measure SC 2.1 provided to RTI as of October
2018. The technical specifications for this measure are in the Medicare-Medicaid Capitated Financial Alignment
Model South Carolina-Specific Reporting Requirements document, which is available at:
https://www.cms.gov/Medicare-Medicaid-Coordination/Medicare-and-Medicaid-Coordination/Medicare-Medicaid-
Coordination-
Office/FinancialAlignmentInitiative/MMPInformationandGuidance/MMPReportingRequirements.html

33
Table 8
Care coordination staffing
Calendar year
Total number of care
coordinators (FTE)
Percentage of care
coordinators assigned
to care management
and conducting
assessments
Member load per care
coordinator assigned
to care management
and conducting
assessments
Turnover rate
(%)
2015 24 83.3 90.30 29.2
2016 99 92.9 121.01 35.7
2017 94 92.6 132.06 12.0
FTE= full-time equivalent.
SOURCE: Analysis of MMP reported data for Core Measure 5.1 provided to RTI as of October 2018. The technical
specifications for this measure are in the Medicare-Medicaid Capitated Financial Alignment Model Core Reporting
Requirements document, which is available at:
https://www.cms.gov/Medicare-Medicaid-Coordination/Medicare-
and-Medicaid-Coordination/Medicare-Medicaid-Coordination-
Office/FinancialAlignmentInitiative/MMPInformationandGuidance/MMPReportingRequirements.html.
4.2 Information Exchange
In South Carolina, Phoenix (the electronic Medicaid HCBS waiver case management and
service authorization system) was modified to meet the demonstration’s needs, including to
maintain records of all intake, assessment, and care planning activities. Please see Section 2.2.2,
Training and Support of Plans and Providers for a discussion on Phoenix.
Phoenix includes information on home assessments, caregiver supports, and quality
indicators, and has capacity for provider notes, correspondence among users, and other features
(e.g., alerts for follow-up appointments) that can be modified to ensure compliance with Federal
regulations and State policies and programs. MMPs are required to use Phoenix as a uniform
centralized electronic record system to document all activities relating to enrollees’ care (e.g.,
ICPs, provider information, waiver case management, and quality assurance activities). In
principle, any MT member may be trained and access the Phoenix system to read or input notes
on their particular enrollees; however, according to State officials, it appeared that the primary
users of Phoenix within the first 3 years of the demonstration, other than State staff, were the
HCBS providers and plan care managers.
In annual interviews, plans reported that they each have their own extensive member data
management system and that Phoenix was duplicative and not useful to them. Furthermore, plans
made significant and costly efforts to ensure their data systems were conversant with Phoenix to
fulfill their data reporting requirements. During the 2018 discussions with the RTI team
regarding the demonstration extension, CMS noted that some of the plans’ reporting
requirements through Phoenix have been scaled back. This will be discussed in more detail in
future reports.
34
[This page intentionally left blank.]

35
5. Beneficiary Experience
5.1 Introduction
Improving the experience of beneficiaries who access Medicare- and Medicaid-covered
services is one of the main goals of the demonstrations under the Financial Alignment Initiative.
Many aspects of Healthy Connections Prime are designed expressly with this goal in mind,
including emphases on working closely with beneficiaries to develop person-centered care plans,
delivering all Medicare and Medicaid services through a single plan, providing access to new
and flexible services, and aligning Medicare and Medicaid processes.
This section highlights findings from various sources that indicate the levels of
beneficiary satisfaction with Healthy Connections Prime overall; it also describes beneficiary
experience with new or expanded Healthy Connections Prime benefits, medical and specialty
services, care coordination services, access to and quality of care, person-centered care, and
quality of life. For beneficiary experience, we draw on findings from the Consumer Assessment
of Health Plan Survey (CAHPS), and RTI focus groups and stakeholder interviews. Please see
Section 1.1.3, Data Sources and Methods for details about each data source. South Carolina
focus group findings in 2016 and 2017 were very similar. Therefore, unless otherwise noted, the
2016 and 2017 focus group findings are reported together. This section also provides information
on beneficiary protections, data related to complaints and appeals, and critical incident and abuse
reports. The section includes information, where available, on the experience of special
populations.
Highlights
• CAHPS survey results and RTI focus group findings indicate that the majority of
enrollees are satisfied with services provided under Healthy Connections Prime.
• The majority of focus group participants felt they were part of their care planning
team, and appreciated their care managers’ regular check-ins, assistance in accessing
needed services, and support in resolving issues such as improper billing.
• The majority of focus group participants were aware of, and many had used, benefits
such as plan supplemental benefits (e.g., gym memberships), plan flexible or ‘waiver
like’ service benefits (e.g., home modifications), and community-based organization
benefits (e.g., Meals on Wheels).
• Availability of, and access to, certain services continue to be a challenge for many
Healthy Connections Prime enrollees in this very rural state. Focus group participants
and site visit interviewees mentioned challenges with access to specialty providers,
including behavioral health providers, and the availability of aging-specific services,
(e.g., vision, dental, hearing, and dementia care such as day centers).
36
5.2 Impact of the Demonstration on Beneficiaries
This section summarizes the findings of focus groups, beneficiary surveys, and
stakeholder interviews reflecting beneficiary experiences with service delivery and quality of life
under Healthy Connections Prime. Beneficiary experiences related to the early enrollment
process, including experiences of beneficiaries who chose to opt in, opt out, or who were
passively enrolled, are discussed as part of Section 3, Eligibility and Enrollment.
5.2.1
Overall Satisfaction with Healthy Connections Prime
CAHPS results for 2017 and RTI focus group findings for 2016 and 2017 indicate that
the majority of enrollees are satisfied with Healthy Connections Prime. Focus group participants
rated their satisfaction very high and were especially pleased with the elimination of copayment
costs.
Table 9 presents 2017 CAHPS data for three beneficiary satisfaction measures across
MMPs participating in the demonstration in South Carolina: (1) the percent of beneficiaries that
rated the health plan as a 9 or 10 (on a scale of 0 to 10, 10 being the best rating), (2) the percent
that rated the drug plan as a 9 or 10, and (3) the percent that reported the health plan “usually” or
“always” gave them the information they needed. We provide Medicare Advantage (MA)
benchmarks, where available, understanding that MA and demonstration enrollees may have
different health and sociographic characteristics, and these differences could affect the results.
Among the three MMPs, beneficiaries’ satisfaction with their health plan ranged from 54 to 66
percent. Although the ratings for two of the MMPs are comparable to the national percentages
for MA and MMP contracts, beneficiaries enrolled in another MMP reported a lower rating of
their health plans (54 percent). In contrast, a higher percentage of respondents across all three
MMPs reported higher satisfaction with their drug plans, with the percentage rating their drug
plan a 9 or 10 ranging from 65 to 68 percent. Likewise, consistent with national ratings, a high
percentage of respondents across all three MMPs reported “usually” or “always” receiving
information they needed from their health plan.

37
Table 9
Beneficiary overall satisfaction, 2017
CAHPS survey
item
National
distribution—all
MA contracts
National
distribution—all
MMP contracts
Absolute Total
Care (ATC)
Molina
Healthcare of
South Carolina
Select
Healthcare of
South Carolina
Percent rating
health plan 9 or
10 on scale of 0
(worst) to 10
(best)
64
(n=188,484)
63
(n=14,662)
54
(n= 454)
60
(n=318)
66
(n=350)
Percent rating
drug plan 9 or 10
on scale of 0
(worst) to 10
(best)
63
(n=172,033)
64
(n=14,087)
65
(n=410)
67
(n=315)
68
(n=319)
Percent reporting
that health plan
“usually” or
“always” gave
them information
they needed
94
(n=168,247)
92
(n=13,879)
93
(n=452)
92
(n=298)
94
(n=344)
MA = Medicare Advantage; MMP = Medicare-Medicaid Plan.
SOURCE: CAHPS data for 2017
RTI focus group participants expressed overall satisfaction and characterized services
under Healthy Connections Prime as better than those previously received. Participants said they
were grateful to be in the demonstration because they no longer had copayments for provider
visits or medications. In 2017, when asked to rate the plan on a scale of 0 to 10 with 10 being the
best, almost all of the focus group participants ranked their plan between eight and 10. Examples
from beneficiaries expressing satisfaction with their Healthy Connections Prime plan in 2017
follow:
It’s [combined Medicare and Medicaid] just better. You understand it better. You
don’t have to have two cards. And then when you go to the drugstore they say,
‘This one pays for that. That pays for that. And then this one don’t pay for that.’
And then it ain’t like that with your one card.
The most I like about the plan is they’re nice people, and you don’t have [a]
copayment, and you can call from 8:00 in the morning until 8:00 at night if you’ve
got a problem. I don’t think there’s anything about them that I don’t like.
Without [health plan], it’s been almost impossible for me to get [services] because
I don’t have the money. A lot of things you go to, right away you ain’t got no
insurance, ain’t nothing happening. [Now] You feel like they really care, that they
want to … make you feel better and do a job right.
38
Some focus group participants expressed satisfaction more specifically with the benefits
that they could now access with the demonstration. One said: “[I] used to pay money and didn’t
know whether I was going to eat that month. But now I don’t have to worry about medication. I
can go to the doctor, where I used to have to wait until I [got] the money.”
Participants provided recommendations for improvements to benefits as well. In
particular, participants said that benefits should have been expanded for more dental, vision, and
transportation services. For example, South Carolina’s Medicaid insurance covers the costs of
tooth extractions but does not cover dentures, a need of many older adults; none of the MMPs
added supplemental dental benefits. Similarly, eye exams are covered by South Carolina’s
Medicaid insurance but only two of the three plans added supplemental eyewear benefits. One
2017 focus group participant summed it up by saying, “What I least like about it is the dental and
eye care. They don’t add any of those in. Even hearing aid ... I wish that was a part of it, too.
Because you can’t see, you can’t hear, you can’t eat, you’re dead.”
5.2.2
New or Expanded Benefits
The three plans use flexible benefits or “waiver-like services” as they are known in South
Carolina, differently. Two plans noted that they use the benefits strategically to enable enrollees
to remain in their homes rather than in nursing facilities. Although the total monetary value of
these benefits is not available, according to MMP self-reported data counts, 164 ATC enrollees,
31 Select enrollees, and five Molina enrollees have received some type of “waiver-like service”
or flexible benefit from their plans during calendar year 2017.
Benefits that most 2017 focus group participants knew were available to them included
plan supplemental benefits (e.g., extended vision services), community-based organization
benefits (e.g., Meals on Wheels), respite services (for HCBS recipients), and flexible benefits
(e.g., home modifications, etc.). Participants said they were pleased with extra benefits provided
by some plans; some noted that gym membership, a plan supplemental benefit, was useful to
maintain a healthy weight. Participants also reported receiving gift cards for attending
informational sessions at the plan or for receiving mammograms or colonoscopies. One
participant explained a helpful monthly over-the-counter drugstore supply program offered by
one plan:
But they also have another plan where you can get $25 worth of over-the-counter
medicines ... they give you a list, and it shows you the pricing. You can get things
like multivitamins, aspirin, skin lotion, stuff like that.
State officials indicated that approximately half of enrollees who would be appropriate
for the new palliative care benefit were receiving those services. Reporting and tracking this
service was challenging, and State and plan officials noted that there are few providers in the
State who are trained in providing this benefit. In order to improve awareness and access to this
benefit, the State has collaborated with the Center for Palliative Care to develop enrollee and
physician educational materials to improve messaging regarding the difference between the
palliative benefit and other benefits, such as hospice. See Section 1.2, Model Description and
Goals for information on this benefit.
39
Likewise, another participant expressed appreciation for flexible or “waiver-like” benefits
that enabled her to remain in her home. She explained that if she needed additional home
improvements or modifications, those services would be available to her: “I get pest control
[from the plan]. If I needed any modifications like a wheelchair ramp, they would build a
wheelchair ramp for me.”
5.2.3
Medical and Specialty Services
The majority of focus group participants reported having a PCP and had been seeing their
current PCPs for at least a year, with some indicating they had the same PCP for more than 5
years (i.e., including prior to enrollment in the demonstration). The evaluation was particularly
interested in learning about beneficiary satisfaction with their providers due to the age of the
demonstration’s population (age 65 years or older). Some focus group participants were initially
concerned about possibly changing to a new PCP if she or he was not in the MMP network.
However, the MMPs’ single case contracting and the demonstration’s continuity of care
provision improved plans’ ability to contract with providers to serve demonstration enrollees.
One participant relayed how her PCP began participating, “When I started, they told me that my
PCP was not on their plan. But they would see if they could get him on the plan. They were able
to, so I was able to stay with him.”
When focus group participants were asked about their satisfaction with their current PCPs
and specialists, mixed feedback was reported by participants. Some participants reported positive
relationships with their current providers. Many of these participants felt that their doctors were
attentive and provided needed services.
I adore my provider [and] [plan name]. I think they’re amazing. I think they’re
totally wonderful. I am so impressed. I told them I would do commercials for
them.
I got one particular doctor … He’s my cancer doctor. I’ve been seeing him for the
last 7 years. He’s very strict. He’[s] the type of guy that if you got cancer, he’s
going to fight it for you. He’s there. The last 7 years, he’s been there for me.
However, a few participants felt that their doctors did not listen to them or they felt
rushed during visits. One participant explained,
[Doctor] has too many patients and when he comes in to see you, he only sees you
maybe about 5 minutes and he’s gone. And he drew my blood and then he
checked my heart and that’s it. [The care manager] kept telling him to give me a
yearly physical and he didn’t do it.
Beneficiaries, the State, and stakeholders raised several medical and specialty service
access issues. One stakeholder interviewed in fall 2017 pointed out that enrollees were facing
challenges accessing specialty services, such as podiatry. Several focus group participants also
described difficulty finding a PCP or securing appointments with various specialists. One
participant said, “And my experience is that when you go through the list [of available
physicians]—they’re not currently taking patients. So it does me no good.”
40
Likewise, one participant found it difficult to find a specialist. “I like that everything is
combined and that makes it simple for me. But I’m having a hard time finding the specialists that
are on that plan, that accept that plan. Ear, nose, and throat doctor, especially I’m having a real
hard time finding one.”
Another participant described her difficulty in accessing specialty services due to what
appears to be a lack of education on the part of either the referral provider or the specialist, “So
Dr. [NAME], she’s a gynecologist. She sent me to a specialist. So the specialist told me I needed
to have $125, and I told her I didn’t have it with me. So she told me when I get the $125, I could
come back.”
In 2015 and 2016, MMPs reported that nursing facility staff continued to advise enrollees
to disenroll from the demonstration in order to transition to their facilities. Despite State and
CMS education of nursing facility staff about the demonstration, in 2017, MMPs reported
continued provider resistance in this area (see Section 6, Stakeholder Engagement). Other
access issues identified early in the demonstration were mostly resolved by 2017 through the use
of single case contracting and continuity of care provisions.
5.2.4
Care Coordination Services
Most focus group participants in 2016, and nearly all focus group participants in 2017,
knew their care coordinators, known as care managers in South Carolina, and described regular
interactions with them. Participants appreciated that there was someone from the health plan who
they could personally contact and who knew their healthcare details and current life
circumstances. Participants in both years reported positive relationships and were pleased with
their care manager’s attentiveness and concern for their well-being.
She [the care manager] called me because, see, they try to keep up with your
circumstances, because what they do is they do home visits, too. Send someone
out to check your brain status about every two months.
She came to my house and sat on the front porch and talked about whatever we
want to talk about. And it’s basically your healthcare and they get an inventory of
how well you’re doing and what you’re doing and who takes care of you and do
you still bathe by yourself. That kind of stuff.
They came to my house once and they told me that if I felt that I needed
somebody to come in and help me with house cleaning or anything like this or if I
needed transportation to the doctors.
Although the majority of focus group participants reported having consistent care
managers, in 2017, a few said they received calls from multiple people at the plans and that their
care managers had changed.
… the caseworker changes every month, and nobody seems to know what’s going
on there. You can call and ask a question and it’s like, 30 minutes on the phone
trying to find it because nobody knows nothing. They come out to your house to
see if you’ve got what you need and stuff.

41
Many participants noted that their care manager will assist with administrative issues
such as incorrect billing or filing a complaint. One explained: “You know what I like about our
plan? You have a nurse that will call you once a month …. She will talk to you and let you know
that whatever the hospital or doctor charged, don’t worry about it. They got it covered.”
The importance of a face-to-face interaction was also noted by providers who RTI
interviewed. In 2017 an assisted living facility provider reported that it took some time for
residents to understand the purpose of the Healthy Connections Prime care manager: “When the
care manager asks for the resident they [resident] give us [staff] the phone back or hang up and
say, ‘I don’t know why they [are] contacting me.’” However, the provider explained that after
the care manager visited the enrollee, the enrollee was pleased with the care manager.
Demonstration enrollees also provided feedback on their providers’ communication
through the CAHPS survey. Most survey respondents in ATC and Select reported that their
doctor usually or always was informed and up-to-date about the care they received from
specialists (see Table 10). In 2017, 86 (ATC) and 87 percent (Select) of respondents reported
this rating which is comparable to national MA and MMP ratings. We provide MA benchmarks,
where available, understanding that MA and demonstration enrollees may have different health
and sociographic characteristics, and these differences could affect the results.
Table 10
Care coordination, 2017
CAHPS
survey item
National
distribution—
all MA
contracts
National
distribution—
all MMP
contracts
SC
distribution—
MMP
contracts
Absolute
Total Care
Molina
Healthcare of
South
Carolina
Select
Healthcare of
South
Carolina
Percent
reporting that
in the past 6
months
personal doctor
“usually” or
“always” was
informed and
up-to-date
about care
received from
specialists
87
(n=103,052)
86
(n=6,942)
87
(n=459)
86
(n=180)
NA
87
(n=150)
NA = not available due to too few respondents to this question; MA = Medicare Advantage; MMP = Medicare-
Medicaid Plan.
SOURCE: CAHPS data for 2017
5.2.5
Beneficiary Access to Care and Quality of Services
RTI focus groups and site visit interviews in 2017 indicate that Healthy Connections
Prime enrollees continue to encounter challenges in the areas of (1) access to providers,
(2) availability of aging-specific services, including vision, dental, hearing, and dementia care,
42
and (3) access to behavioral health services. Participants described having access issues due to
transportation services:
I don’t have a car, so I have to work with [transportation vendor]. And it’s just
impossible to find someone who does understand that you are not well, which is
why you’re going to the doctor. I don’t know what they have as a guideline for
the contractors. It is awful. You have to plan. If you’re sick on Monday, you can’t
go on Monday unless you call an ambulance. You have to wait 3 days.
Beneficiaries also noted major difficulties in accessing aging-specific services. In both
the 2016 and 2017 focus groups, participants reported receiving denials for needed items or
services such as incontinence supplies, nebulizers, and canes. Participants also expressed
frustration with the lack of benefits for hearing aids, as one participant noted “[the health plan]
don’t cover hearing, they don’t cover eyes, don’t cover dental, doesn’t pay for dentures.”
Another focus group participant described difficulties accessing dental providers: “I am not
happy with [my plan] … the lack of providers. I needed to have some dental work, and they sent
me to a children’s dentist.” Day centers for persons with dementia are available in some urban
centers, but few services exist in rural areas. However, one focus group participant expressed
appreciation for the day center service available for their parent: “My mom was able to go [to]
daycare. She gets to interact with other people. Be with people her age.”
Although the demonstration was intended to integrate behavioral health services with
primary care and LTSS, State and stakeholders interviewees noted that little has changed due to
the scarcity of behavioral health providers and the focus of the State’s behavioral health services
on the younger population. State demonstration staff noted that although 15 percent of
demonstration enrollees have a behavioral health diagnosis, they believed there are more with
undiagnosed conditions. State staff have consistently indicated that access to behavioral health
care for older adults is a concern because a gap continues to exist between the services available
and the behavioral health needs of older adults. Reasons for this gap include the Department of
Mental Health’s (DMH’s) reported reluctance to treat beneficiaries who have a diagnosis of
dementia; and the fact that providers focused on disruptive behavior and under-treated conditions
such as depression. By fall 2017, the State and the plans continued to report low overall
utilization of mental health and behavioral health services. When behavioral health specialists
are not available, enrollees receive services through their PCP. Focus group participants spoke of
their experience with behavioral health services; one participant noted the lack of focus on
mental health services for older adults.
[Mental health services] helps whenever you have an illness, if you get agitated or
you get down and out. It’s just an amazing thing. And a lot of the mental health
people do not—in the mental health clinic, there are a lot of young people and
they don’t want to help you as you get older. But doctors should be able to refer
you or give you somebody that should be able to help you if you need it. I’m on
two medications, and I couldn’t do without them.
Although beneficiaries described challenges they still face in accessing care, aging-
specific services, and behavioral health services, several focus group participants expressed that
43
they had improved access to services such as medical care, durable medical equipment, and
transportation after enrollment in the demonstration.
Well, say for instance a colonoscopy, I had that last week. I’ve never had one. My
doctor pushed me into getting one. He said, “I want you to live for me. Give it a
try.” And I did. And I did have something wrong.
I had to get a scooter so that I could just go up and get my mail. [My new plan]
took over because I had been fighting [with my old health plan] for a year. They
took over and I had a scooter in my front yard in two months.
5.2.6
Person-centered Care and Patient Engagement
Focus group participants indicated high involvement in their own care. Most participants
reported that their PCPs and specialists listened to them and that they felt that they were part of a
team. One said, “I like most [that] I have a doctor that is including me in her team. I feel like
they’re [specialist and PCP] working together. So yes … they’re communicating about me.”
Only a few participants felt that they were not part of the decision-making process due to
a lack of communication regarding their own care or their loved one’s care. In 2017, for
example, one participant noted that the physician did not share information about her health
when she asked.
He did not listen to me; he patronized me. I am not a genius, but I am an
intelligent, informed individual. I can understand my care. If I can’t, I want to be
able to ask questions. But if I would ask him a question, he would say, “You don’t
need to know that.”
5.2.7
Personal Health Outcomes and Quality of Life
Most focus group participants in 2016 and 2017 said they had improved quality of life
and better health since enrolling in the demonstration. A few participants said their quality of life
had not changed and, noting their serious health conditions, such as a cancer diagnosis, they said
their health had not worsened. None of the participants said that their quality of life or health was
worse after enrolling in the demonstration.
Participants spoke about how their quality of life had changed after receiving services
such as pain management, supplemental services, and care coordination through one of the
Healthy Connections Prime plans.
For a while I didn’t [enjoy life] because I was in so much pain. But now that’s
why I can laugh and smile, because when I think about the accidents that turned
my whole life around, I had to adjust to it. I’ve got my life back…. I didn’t think I
could get it back to this full extent.
Her [mother’s] quality of life is better. The meals help her nutritionally-wise.
Keeps her up. Things like that, that she wasn’t getting that she gets now. They all
44
work together for the one common good, and that’s the personal health and well-
being of my mother.
Sometimes when people care about you, it makes your life a little better. When
they call me up and ask me do I need [services]—you see somebody out there
concerned, that you’re not left in the dark. You get someone who wanted to help
you. That made you feel a little more uplifted.
Some participants said they achieved a better quality of life by having consistent access
to health care or benefits provided by their plans.
I could take my medicine properly, because I used to cheat myself. Because it’s
free now … Before when I was working and I was taking medicine, I was taking
half because I couldn’t afford it.
In both 2016 and 2017, most participants emphasized that the demonstrations’ zero
copayments and no-cost medications reduced the stress in their lives because they did not have to
worry about out-of-pocket costs for their health care.
Because before [the demonstration] if you go [to the doctor] and … you got a
prescription [that costs] $200 … [where is] that $200 coming from? That could
put stress on you. Now if you get a prescription, I don’t care how much the
prescription costs. I just go into the pharmacy and get my medicine.
5.2.8
Experience of Special Populations
This section summarizes the beneficiary experience for Healthy Connections Prime
special populations, including individuals with LTSS or behavioral health needs, and
racial/ethnic or linguistic minorities. Because the Healthy Connections Prime demonstration
supports enrollees age 65 and older, many of whom have LTSS needs, the entire demonstration
population could be considered a “special population.” Thus, many findings already discussed in
this section showcase the demonstration experience of special populations. Please refer to
Table B-1 in Appendix B for a breakdown of enrollee demographic characteristics.
According to stakeholders, State, and MMP officials, there is not a large population of
linguistic minorities among Healthy Connections Prime enrollees. However, to support
communication with enrollees with special linguistic needs, plans and providers have written
materials and language call-in line services available in Spanish and other languages as needed.
All focus group participants were asked if they had experienced any improper or
discriminatory behavior by the State, MMPs, or providers. In 2017, two participants reported
feeling uncomfortable because of what they viewed as racist behavior by White providers. One
reported his specialist seemed reluctant to physically examine him. Another participant changed
providers as a result of her interactions. She explained:
They [physicians] are nice peoples. Well, they talk nice to you. Some peoples talk
mean to you, like that [previous specialist], she called me a girl all the time. She
come in the office, ‘How you doing, girl? How you feeling today, girl?’ And so I
45
didn’t like that because I’m 79 years old. How old do you be before you become a
woman? It sounds like a racist thing because I think that’s what they used to call
the women in slavery. They was women, but they still called them girl, and they
called the men boys.
Enrollees living in rural locations face service access challenges. Interviews and focus
group findings indicate that plan care managers and health navigators have been instrumental in
meeting the needs of beneficiaries, some of whom had not received services in several years
prior to enrolling in the demonstration. Focus group participants from rural communities
expressed satisfaction with in-home visits and assistance provided by care managers. To improve
access to care for enrollees in rural areas, Healthy Connections Prime staff and MMPs discussed
exploring new ways to reach these enrollees such as telehealth services through the South
Carolina Telehealth Alliance, which supports services such as remote patient monitoring and
video visits. South Carolina’s DMH has a tele-psychiatry program that comprises emergency
department consultations and community mental health services (South Carolina Department of
Mental Health [SCDMH], 2017). As pointed out by plans and the State and discussed previously
in this report, there continue to be complex challenges to expanding and integrating behavioral
health services to seniors in South Carolina.
5.2.9
Beneficiary Protections
This section describes the beneficiary protections available to demonstration enrollees
and enrollees’ awareness and use of those protections. It also includes a summary of grievance
(complaint) and appeals data received from (1) data reported by MMPs on complaints made
directly to them; (2) data reported on the Complaint Tracking Module (CTM) for complaints
received by SCDHHS and 1-800-Medicare; and (3) data reported by the Independent Review
Entity (IRE), which is a second-level review of appeals. Reporting periods vary across these
sources.
Complaint process and enrollee awareness of rights. MMPs are responsible for
addressing complaints that arise in their plans, and they must respond to complaints within
30 days. Enrollees are encouraged to address their concerns at the plan level first. However, they
may file complaints (grievances) through 1-800-Medicare, with SCDHHS, or seek assistance
from the Healthy Connections Prime Advocate to file a complaint (described below). All
complaints are forwarded to the contract management team (CMT) and entered into the CMS
CTM. The MMPs are required to maintain records of all appeals activities and notify CMS and
SCDHHS of all appeals (South Carolina three-way contract, 2014, pp. 128–30).
Enrollees may contact the ombudsman program, known in South Carolina as the Prime
Advocate, at any time for assistance in making a complaint or filing an appeal. SCDHHS
contracted with the State’s LTC Ombudsman program to serve as the Healthy Connection Prime
Advocate (HCPA) program in March 2015. The State LTC Ombudsman reports to the South
Carolina Lieutenant Governor's Office on Aging, has a statewide network of 17 regional
ombudsmen, operates a toll-free telephone number with multiple language lines, and has
reporting systems in place to capture data on grievances and appeals for individuals receiving
long-term care services. This office also provides training and outreach to educate beneficiaries,
stakeholders, and the community about Medicare and Medicaid rules and enrollees’ rights.
46
Under the contract with SCDHHS, these services were expanded for HCPA, and two
Healthy Connections Prime Advocate positions were created to support demonstration enrollees.
Staff also provided education programs to communities and stakeholders to promote the
demonstration and they assist beneficiaries who are not yet enrolled with administrative issues
(e.g., Medicaid renewal). Together with the network of regional ombudsmen, the Healthy
Connections Prime Advocates promote demonstration enrollee self-advocacy, they engage
MMPs, or providers directly to resolve issues, and assist enrollees in filing complaints,
grievances, and/or appeals.
Focus group participants reported that they resolved issues at the plan level before they
were escalated to the formal grievance level. They usually discussed the issue with their care
manager or called the plan directly to resolve an issue. As one focus group participant explained:
“I sometimes get bills, but I’ll call the [Plan] and ask them why I’m getting it, and they call and
resolve it.” In both 2016 and 2017 few focus group participants had heard of the Prime Advocate
or knew there was a resource available if they had issues that were not resolved after contacting
their care manager or someone at the plan.
Complaint data. Plans track their grievances and appeals and report them in their
monthly reports to the CMT. In 2017, the top three reasons for grievances reported by MMPs
were inappropriate billing, poor customer service, and poor network access. When grievances are
referred to the Prime Advocate, staff investigate and work to resolve complaints made by or on
behalf of demonstration enrollees. They also document all cases and track grievance data to
identify trends and systemic problems. The Healthy Connections Prime Advocates participate in
CMT meetings and report all grievance and complaint data to the CMT. In RTI interviews each
year, Prime Advocate representatives reported that they were able to resolve cases that were
referred to them within a short time. They explained that it usually required a week to discuss the
issue with the pharmacy, hospital, plan, or other relevant entity, to hear the circumstances, and to
reach a resolution. Education for both the entity and the enrollee was a large part of their activity.
Nursing facilities statewide have high occupancy rates (approximately 95 percent); this is a
source of enrollee complaints at times when they were offered services at a nursing facility too
far from their home. The Prime Advocate staff work with the LTC Ombudsman staff to resolve
these more complex issues. At the Steering Committee meeting of February 2017, MMPs listed
the Prime Advocate as the top asset of the Healthy Connections Prime demonstration.
Overall, there is no consistent trend in the number of reported grievances per 1,000
enrollees through the course of the demonstration. The number of grievances per 1,000 enrollees
increased in the first 8 months of the demonstration, to a high of 21.5 complaints per 1,000
enrollees in quarter 3, 2015. This was followed by a general decrease to a low of 7.9 per 1,000 in
quarter 1, 2017. Subsequent quarters saw increases, to the third highest number of grievances per
1,000 enrollees of 15.7 in quarter 4, 2017. From February 2015 through December 2017, the
categories with the three highest number of complaints were: (1) benefits, access, and quality of
care; (2) enrollment/disenrollment; and (3) HIPAA and security concerns, customer service, and
availability of materials in alternative formats.
Appeals. MMPs are required to follow appeals processes that incorporate relevant
Medicare Advantage and Medicaid managed care requirements. Plans must respond to enrollee
appeals within 15 days. They must maintain records of all appeal activities and notify CMS and

47
SCDHHS of all internal appeals. Enrollees are required to be notified of all Medicare and
Medicaid appeal rights through a single notice (South Carolina three-way contract, 2014,
pp. 128–30).
Similar to the complaint data, over the course of the demonstration there is an
inconsistent trend in the number of plan reported appeals per 1,000 enrollees. The highest
number of appeals per 1,000 enrollees occurred in quarter 1, 2017, with 23.5 plan reported
appeals. Of the plan reported appeals, in each quarter, a majority (ranging from 62.2 percent to
100 percent) resulted in fully favorable outcomes for the enrollee. The number of appeals
reported to the IRE, a second-level review of appeals, increased over the 3 calendar years of the
demonstration, with two appeals reported in 2015, 32 in 2016, and 70 in 2017. In each year, the
majority of appeals was upheld, with less than 20 percent overturned in favor of beneficiaries.
The most common category of appeals referred to the IRE was for practitioner services.
6
Critical incidents and abuse. South Carolina requires MMPs to report critical incidents
and abuse of members receiving LTSS (CMS, 2018c). In 2015, the number of critical incidents
and abuse per 1,000 members ranged from 13.0 in quarter 2 to 17.7 in quarter 4. In 2016, the
number per 1,000 members receiving LTSS dropped to 4.6 in quarter 1 and 0 by quarter 4. In
2017, the number of reports of critical incidents and abuse per 1,000 members receiving LTSS
was 0.6 in quarter 1, 0 in quarter 2, 0.5 in quarter 3, and 0 in quarter 4.
6
Examples of practitioner services include, physician, chiropractic, dental, prosthetics/orthotics, and vision care.
48
[This page intentionally left blank.]

49
6. Stakeholder Engagement
6.1 Overview
This section describes the approach taken by South Carolina for engaging stakeholders,
the mechanisms for soliciting stakeholder feedback, and the impact of those efforts on the
demonstration in more detail.
The State has engaged stakeholders through a variety of activities and adapted its focus as
the demonstration has evolved. Early in the planning phase of Healthy Connections Prime, the
State conducted general presentations about the goals of the demonstration throughout the State
to provider associations, medical groups, and advocacy organizations to solicit feedback and
inform the design of the demonstration. In 2013, the State invited a broad range of providers and
advocates to participate in planning work groups, to update stakeholders about the progress of
the demonstration, solicit more feedback on design changes, educate the community, and
encourage participation in the demonstration.
After the three-way contracts were signed with the MMPs in fall 2014, the State’s focus
shifted to educating MMPs and stakeholders (e.g., HCBS providers, hospitals, nursing facilities,
etc.) and conducting targeted outreach to encourage more physicians and provider groups to
participate in the demonstration. At that time, physicians were reluctant to contract with MMPs
due to a general fear of managed care, a competitive provider environment in the State, and low
enrollment in the demonstration.
Highlights
• South Carolina’s Healthy Connections Prime staff cast a wide net to engage
stakeholders beginning in 2013. After the demonstration began in 2015, it adjusted its
focus to attract and engage more providers and to train MMPs.
• The demonstration has strategically used contractors, including the Prime Advocate,
to engage and educate stakeholders through a variety of venues and formats. Clearly
written and timely postings of policy changes, marketing materials with consistent
language, and provider website enhancements have enhanced stakeholder
engagement.
• Training has been an important aspect of South Carolina’s outreach to stakeholders. In
addition to initial demonstration training, the Office for the Study of Aging at the
University of South Carolina (OSA) has been an integral partner in using training as a
mechanism to resolve administrative modifications for stakeholder groups.
• As the demonstration has evolved, the State has engaged and redefined stakeholder
advisory groups as needed. By 2017, due to the uncertain future of the demonstration,
the State had narrowed its focus from a broad variety of stakeholders to engaging
partner organizations.
50
The State continued its relationship with the larger, stakeholder and advocate community
by electronically distributing salient demonstration news via the Prime Weekly Updates in 2014.
Subsequently, these transformed into monthly and then quarterly Stakeholder Updates. When the
demonstration began in early 2015, but was limited to opt-in enrollment, the State focused its
outreach to trainings of MMPs and their providers in processes that were new to them including
contracting with LTSS providers, HCBS service delivery, Dementia Dialogues, care giver
coaching, transition planning, and the use of Phoenix, the State’s case management system,
among other processes.
6.2 Organization and Support
6.2.1
Stakeholder Council
In May 2016, after passive enrollment began, the demonstration gathered momentum and
the State convened an Implementation Council (IC), comprised mainly of stakeholders who had
participated in the earlier planning workgroups. State contractors, demonstration stakeholders,
and MMPs also participated, and enrollees and caregivers were invited to participate. The State
had planned for the IC to continue, tasked with providing input on policies, assisting in
monitoring, and advising SCDHHS on the demonstration. However, in late 2016, the Medicaid
Director announced a suspension of passive enrollment and a discussion of the possibility of
transferring the demonstration population to a MLTSS model. The Healthy Connections Prime
team delayed reconvening the IC until there was more certainty about the future of the
demonstration beyond 2018. Consequently, during most of 2017, the State focused attention on
MMPs, rather than the broader stakeholder community. In addition to continued training, it held
two Steering Committee meetings in 2017 during which CMS, the State, and MMPs discussed
demonstration challenges and potential areas of improvement.
Targeted outreach. From the beginning of the demonstration, as the State identified
stakeholder concerns, it leveraged its contractors to conduct targeted outreach and training
focused on the needs of each stakeholder group (e.g., hospitals, nursing facilities, physicians, and
HCBS providers). The Office for the Study of Aging (OSA) at the University of South Carolina,
the State’s training contractor, planned to conduct a series of learning collaboratives in 2015 and
2016. Each collaborative training would provide an opportunity for the three MMPs and each
separate stakeholder group to discuss policy concerns and to clarify administrative and
procedural issues unique to the particular group (e.g., nursing facility referrals, transfers,
payment, etc. for the nursing facility learning collaborative). However, only a few learning
collaboratives occurred prior to the end of the State’s training contract in July 2017. Two were
well attended by HCBS providers and one with nursing facility providers; MMP representatives
attended all collaboratives.
The training conducted by OSA with nursing facility (NF) staff was most important
because the State and stakeholders reported that many NFs were somewhat hostile to the
demonstration, believing it would reduce the numbers of beneficiaries using their services. NF
staff reportedly provided incorrect information to enrollees including advising them to disenroll
in order to use skilled nursing facility or long-stay services. Despite their concerns, NF staff
participated in demonstration training conducted by OSA, which also made archived web-based
recordings available for repeated trainings for new NF staff. Throughout the demonstration, the
51
State and CMS provided nursing facilities with updated policy and procedure documents which
were also posted on the demonstration’s website and distributed via the demonstration’s
quarterly updates (SCDHHS, 2018d).
Another stakeholder group, HCBS providers, also benefited from targeted engagement by
the State and its contractors. This group had been contracted and paid by the State for many
years and according to State officials, HCBS providers were extremely hesitant to become
involved with managed care organizations, including MMPs. In addition to the learning
communities conducted by OSA, the State addressed HCBS’ primary concern by allowing their
billing to continue through Phoenix, the State’s case management system, although they were
contracted by the MMPs. This provision added an administrative burden to the State, but allayed
the fears of these small organizations and individuals who were concerned about developing new
billing mechanisms that might lead to payment delays. The State subsequently recoups these
funds from the MMPs.
In addition to trainings by OSA, SC Thrive, a beneficiary outreach organization
contracted by the State, conducted beneficiary outreach throughout the State, primarily to
educate beneficiaries about the demonstration and to conduct individual options counseling. In
many of the outreach venues, such as Senior Fairs, SC Thrive also provided education on the
demonstration to provider and advocacy groups. In 2017, MMP representatives joined SC Thrive
representatives in these outreach events.
The demonstration’s ombudsman, known in South Carolina, as the Prime Advocate (see
Section 5.2.9, Beneficiary Protections), is contracted by the State to provide stakeholder
outreach for the demonstration in addition to providing ombudsman services. The advocate’s
office attends outreach events for both beneficiary groups and providers with State health
insurance program (SHIP) and the Lieutenant Governor’s Office of Aging staff, and has
appeared on television panels and other events to promote and engage stakeholders.
To improve messaging to both physicians and enrollees regarding the new palliative care
benefit, in 2017 the State collaborated with the Center to Advance Palliative Care to develop
educational materials explaining the difference between the palliative benefit and other benefits,
such as hospice (see Section 1.2, Model Description and Goals).
To ensure that all demonstration materials provided to stakeholders had standardized
language and messaging, the State contracted Ikaso Consulting which designed user-friendly
quarterly updates, frequently asked questions (FAQs) and other materials targeted to
stakeholders, providers, and MMPs. In early 2017, Ikaso restructured the demonstration’s
website to provide resources and materials for stakeholders and a new section for providers
(SCDHHS, n.d.).
Enrollee advisory committees. In addition to seeking input from various stakeholders in
the planning and implementation of the demonstration, the three-way contract requires each
MMP to establish an enrollee advisory committee to obtain meaningful beneficiary input on
issues. The MMPs engaged enrollee advisory committees and have met quarterly throughout the
demonstration to hear their concerns about the demonstration and to solicit feedback on policy
refinements. In 2016 interviews, enrollee committee participants of all three plans reported a
52
positive experience, a wide range of topics that had been covered in committee meetings, and an
appreciation for having their voices heard. At a 2017 planning meeting with CMS and the State,
the MMPs listed the advisory committees as one of the three top successes of the demonstration
to date.

53
7. Financing and Payment
7.1 Rate Methodology
All Medicare and Medicaid-covered services are financed by capitated payments to the
MMPs; the Medicare and Medicaid contributions represent baseline spending, or the estimated
costs if the demonstration had not been implemented. Capitation payments are risk-adjusted,
using separate methodologies for Medicare Parts A and B services, Medicare Part D, and the
Medicaid components of the rate. The savings percentage is applied to baseline spending. This
section describes the rate methodology of the demonstration and findings relevant to early
implementation.
7.1.1
Rating Categories and Risk Adjustments
The Medicare baseline rates for Parts A and B services consist of a blend of Medicare
Advantage projected payments and Medicare standardized FFS rate for the county in which the
enrollee resides, weighted by the proportion of the target population that is expected to transition
from each program into Healthy Connections Prime. The Medicare Advantage portion is a
function of costs that would have occurred had the demonstration not taken effect, including
quality bonus payments for the relevant Medicare Advantage plans. The FFS county rates are
Highlights
• MMP officials reported financial losses as a result of lower than expected enrollment
due to passive enrollment delays and pauses, and unanticipated expenses. MMPs have
responded by limiting their flexible benefits and participating in efforts to increase
enrollment. In 2017, two of the three plans indicated that they would not be able to
continue in the demonstration past 2018 due to losses.
• The SCDHHS eligibility tracking system has struggled to efficiently identify enrollees
in community versus nursing facility settings. Errors in nursing facility systems have
led to charges to both the State and MMPs for the same enrollees, resulting in delayed
and inaccurate MMP payments, further contributing to MMPs’ financial struggles.
• A 13 percent decline in the per member per month rate for “community well”
Medicare-Medicaid beneficiaries for fiscal year 2017 exacerbated the financial
pressure on MMPs, raising concerns about the case-mix of the community population
and whether members are appropriately assigned to rate cells. Further, the decline in
the community rate highlighted MMPs’ concerns about their financial performance
under the demonstration.
• In July 2018, CMS announced the State and all three MMPs agreed to a two-year
demonstration extension to December 2020 as a result of three-way contract
amendment changes (e.g., adjustments to the savings percentage, enrollment methods,
and administrative reporting requirements).

54
generally reflected in the Medicare Advantage rates, but are adjusted for a geographic practice
cost index and the current hospital wage index. The Medicare Part D baseline is calculated using
the Part D national average monthly bid amount and is risk-adjusted using the existing Part D
prescription drug RxHCC model (South Carolina three-way contract, 2017, p. 196).
Average monthly low-income cost sharing subsidies and Federal reinsurance amounts are
estimated by CMS, and the total is added to the risk-adjusted rates. The Medicaid component is
risk-adjusted based on the rates applied to each of four enrollment categories that reflect
community or facility residence and HCBS waiver status. The structure of the per member per
month payment rate for these four categories (“the rate cell”) was developed to align payment
with risk while encouraging a rebalancing of nursing facility care to community-based care.
Table 11 highlights the Medicaid rate cell structure.
Table 11
Rate cell Medicaid payments per member per month, demonstration year 1 and
demonstration year 2
Rate cell CY 2015 CY 2016 CY 2017
Community $80.44 $95.98 $83.21
Nursing Facility $4,688.42 $5,067.55 $5,253.91
HCBS Waiv
er $1,23
2.19 $1,200.09 $1,170.83
HCBS Waiver-Plus Rate $3,052.26 $3,259.20 $3,361.13
CY = calendar year.
NOTES: These rates reflect the application of the savings percentage but do not reflect the quality withhold
percentages for each year. Demonstration year 1 = February 1, 2015–December 31, 2016; demonstration year 2 =
January 1, 2017–December 31, 2017.
SOURCE: SCDHHS, 2015; Palmer, Howard & Laudenschlager, 2017. Milliman Client Report. Healthy
Connections Prime Calendar Year 2017 Amendment—DRAFT Medicaid Rate Component.
7.1.2
Savings Percentage
A saving percentage is applied to the Medicare Parts A and B and to the Medicaid
components of the monthly rate, but not to the Part D component (South Carolina three-way
contract, 2017, p. 197). These percentages are based on what CMS and SCDHHS expect to be a
reasonable amount of savings achieved by the plans over the course of the demonstration year,
relative to the cost of Medicare and Medicaid service delivery in the absence of the
demonstration. Table 12 shows the aggregate savings percentage for years 1, 2, and 3. Savings
percentages are not applied to the Part D component. CMS monitors Part D costs on an ongoing
basis, and material changes may be factored into future year savings percentages (South Carolina
three-way contract, 2017, p. 197).
One plan expressed that 4 percent savings in year 3 would be unfair and unrealistic, given
the extremely low enrollment in the first 14 months of the demonstration due to the delay in
passive enrollment. (For more on the delay in passive enrollment, please see Section 3.2.2,
Phases of Enrollment.) One MMP official expressed frustration that the savings percentage does
not account for the low enrollment numbers and passive enrollment’s uneven “…false starts, no

55
starts, delays, reinstatements, etc. ….” In response to MMP financial concerns, State officials
worked with the plans and CMS in fall 2017 and 2018, to identify possible solutions that would
enable the demonstration to continue through 2020 with all three plans. The savings percentage
reduction from 4 to 3 percent for calendar year 2018 and beyond was an important factor in these
discussions.
Table 12
Savings percentages by demonstration year
Demonstration year Period covered Savings percentage
Year 1 February 1, 2015–December 31, 2016 1
Year 2 January 1, 2017–December 31, 2017 2
Year 3 January 1, 2018–December 31, 2018 3*
NOTE: The July 2018 contract amendments formally reduced the savings percentage rate for demonstration year 3
from 4 to 3 percent.
SOURCE: https://www.cms.gov/Medicare-Medicaid-Coordination/Medicare-and-Medicaid-Coordination/Medicare-
Medicaid-Coordination-Office/FinancialAlignmentInitiative/Downloads/SCContractAmendment_07012018.pdf
7.1.3
Performance Incentives
Quality withholds. CMS and the State withhold a percentage of payment that MMPs are
able to earn back based on performance on specific quality measures. In demonstration year 1
(February 2015–December 2016), CMS and the State withheld one percent of the Medicare Parts
A and B and Medicaid components of the payment, but not the Part D component (South
Carolina three-way contract, 2014, p. 194). Plans are evaluated on specific quality measures in
order to earn back the withhold percentage. The withhold measures for demonstration year 1
included six implementation and process measures; in demonstration years 2 and 3, the withhold
percentage increased to two and three percent, respectively, and the quality withhold measures
expanded to include utilization measures such as all-cause 30-day readmission and follow-up
after hospitalization for mental illness. MMPs are repaid the withhold rate based on the percent
of the measures they passed. To receive a “pass” on the measure, the MMPs must meet the
performance benchmarks set by CMS and the State. To receive 100 percent of the withhold
amount, MMPs must pass at least 80 percent of the measures (CMS, 2018d). In July 2018,
contract amendments show that the quality withhold percentage of three percent will stay in
effect through 2020 (CMS, 2018a).
Rebalancing incentives. MMPs are offered rebalancing incentives to encourage the
placement of members in the community, and to discourage placement in an NF. The method to
accomplish this includes incentives and penalties where enhanced Medicaid payment is given for
90 days following a transition from a NF to the community, and a lower Medicaid payment is
given for 90 days following a transition from the community to a NF (South Carolina three-way
contract amendment, 2018, p. 4). SCDHHS provides an additional Medicaid incentive through
SCDHHS’s Money Follows the Person waiver called Home Again. State officials indicated that
as of the end of calendar year 2017, there have been no Healthy Connections Prime enrollees
who have been simultaneously enrolled in Money Follows the Person.
56
7.1.4
Medical Loss Ratio
MMPs are required each year to meet a target medical loss ratio (MLR) of 85 percent;
this is the minimum revenue that must be used on expenses directly for medical claims or care
coordination If the MLR is calculated as falling below the 85 percent threshold, then the MMP is
required to reimburse the State and CMS an amount equal to the difference between the
calculated MLR and 85 percent, multiplied by the coverage year revenue. The payment amount
to CMS and the State will be proportional between each payer’s contribution to the aggregate of
the MMPs Medicaid and Medicare revenue. MMPs are required to make this payment, or the
amount will be offset on future capitation payments (South Carolina three-way contract, 2014,
p. 190). As of quarter 2 of fiscal year 2018, the MMPs’ MLRs for demonstration years 1 and 2
had not yet been calculated.
7.2 Financial Impact
MMPs and State officials reported several challenges with respect to the rates and
structure of payment. Low beneficiary enrollment over the course of the demonstration
precluded engaging in alternative payment arrangements with providers, and contributed to
sustained financial losses for at least two of the three MMPs. Additionally, the State planned a
projected 13 percentage point drop in the Medicaid capitated rate to be retroactively applied to
the community cell rate for fiscal year 2017. This reduction was based on the 2-year historical
fee-for-service experience of beneficiaries who would have been eligible for the demonstration
during the baseline period (South Carolina three-way contract, 2017, p. 194). The reduction from
the previous year is, in part, reflective of a longer claims runout period and a reclassification of
beneficiaries from the community rate cell to the nursing facility rate cell during the baseline
period (Milliman, 2017, p. 9). This reduction in the community rate was another source of
frustration for the MMPs. Finally, the State’s eligibility tracking system has struggled to
efficiently identify eligible beneficiaries in community versus nursing facilities, as well assigning
eligible beneficiaries to the HCBS waiver payment cell. These complications have resulted in
delayed and inaccurate Medicaid payments to the MMPs, further contributing to the financial
struggle MMPs have had during the demonstration.
7.2.1
Early Implementation Experience
From the beginning of the demonstration, MMPs reported several financial implications
of low Healthy Connections Prime enrollment. MMPs reported that they had entered the
Financial Alignment Initiative on the assumption that over 50,000 beneficiaries would be eligible
to participate in the demonstration, whereas the adjusted number was 24,000 (see Section 3.2.1,
Eligibility). Furthermore, a number of delays in passive enrollment resulted in plans having even
fewer enrollees than they had estimated. During site visit interviews, MMPs frequently noted
that enrollment had not reached “critical mass,” thereby challenging the MMPs’ ability to
contract with at least one major health system, precluding implementation of alternative payment
methodologies with providers, and assessing the adequacy of capitated rates.
The State’s eligibility tracking system also has caused administrative and financial
concerns for the MMPs. Plans reported early in the demonstration that the State’s eligibility
tracking system was not accurately identifying beneficiaries who transition into a nursing facility
from the community. MMPs continued to receive a Medicaid community rate, beyond the
57
rebalancing period, for enrollees residing in nursing facilities. MMPs and the State have been
working to resolve this issue, but, as of the end of 2017, the backlog in payments have resulted in
millions of dollars of unpaid monthly payments to the MMPs. The State acknowledged this as an
issue with the “integrity of the data” from their eligibility system. State officials indicated they
had to manually determine Medicaid rates for up to 150 enrollees.
In addition to these issues, nursing facilities have erroneously charged both the State and
the MMPs for the same nursing facility stay for some enrollees, in part because the State claims
system did not appropriately reject claims submitted by nursing facilities for MMP enrollees.
Thus, the State was also paying for nursing facility stays for MMP enrollees. A reconciliation
process was underway in calendar year 2017 and completed in summer 2018 (SCDHHS, 2018).
Future reports will include further discussion on this topic.
As described in Section 2.2.1, Provider Arrangements and Services, the demonstration
phased-in the transfer of HCBS services from the State to MMPs over a period of time. During
this transition, the State continued to pay for HCBS services and regularly recouped the amount
from the MMPs. This was a benefit to HCBS workers who preferred to continue to be paid
through the State’s Phoenix system as they had prior to the demonstration. This process has had
administrative challenges as it relates to other types of community-based LTSS. For example,
residential care facilities are carved out of the capitated rate paid to plans and are paid by the
State. While the State should recoup payments from MMPs for HCBS services, the State was
inappropriately charging MMPs close to 2 million dollars for residential care services. When this
discrepancy was discovered in July 2017, the State stopped recouping all HCBS service
payments from the MMPs, to identify and fix this eligibility and payment error.
To resolve these payment issues, the State contracted with Milliman to determine an
accurate amount to be reconciled, which was completed in mid-2018. Findings from the
Milliman analysis will be discussed in the second evaluation report.
7.2.2
Rate Methodology Design Implications
The design of the MMP rates had implications on the financial performance of the
MMPs. One MMP reported during the first year of the demonstration that the quality withhold
percentage should be smaller to reflect the operational costs of the demonstration. MMP officials
noted concerns regarding quality withholds as they relate to enrollment volume, which was
roughly 1,800 enrollees in the first 14 months. Interviewees also noted that start-up investment
varied in part based on MMP staffing models. For example, some MMPs leveraged staff from
other product lines to support the MMP product, whereas others hired a new cohort of staff to
administer the MMP product. As a result, some MMPs were more financially vulnerable to the
one percent-withhold of the rate.
Additionally, some MMP officials noted that without passive enrollment, the
denominators were too small to produce a reliable quality withhold performance measure,
placing at risk revenue that is needed to help cover other upfront investments. Given the start-up
and implementation costs, some plans suggested that the quality withhold should have been
delayed for the first year. The State and CMS worked to simplify the withhold reporting
requirements, but they maintained the withhold percentage. For calendar years 2015 and 2016,
58
three MMPs met the benchmark for a sufficient number of measures to receive the full withhold
amount. Performance on the quality withhold measures for calendar year 2017 had not been
determined at the time of this report.
The adequacy of the Medicaid capitated rates was also a concern for MMPs early on.
Limited enrollment during the early months of the demonstration, due to the delay in passive
enrollment, precluded plans from determining whether the capitated rates were adequate. There
was a small increase in the Medicaid rates in 2016; however, by late 2016 some MMPs began
reporting that the Medicaid capitated rates were insufficient given their low enrollment prior to
passive enrollment. At the time, there was hope that once passive enrollment began, the capitated
rates would be adequate as more members would be enrolled along with a greater variability in
case mix.
In calendar year 2017, the State sharply reduced the capitated Medicaid rates for the
community cell to which the vast majority of MMP enrollees are assigned (see Table 11). This
reduction was based in part on the expected baseline spending for the FFS dual eligible
population, absent the demonstration (SCDHHS, 2018), and corrections to the baseline data. The
reduction in the community cell rate further elicited specific concerns around member eligibility
assignment to the community vs waiver cells. Two plans in particular voiced concern that the
bulk of their members were assigned to the community cell. One plan posited that member risk
was not accurately determined when assigned to the community cell. Other MMP officials
reported that many of their community rate enrollees qualify for one of the three waivers
included in the demonstration, but because of backlogs and inefficiencies in the State’s waiver
eligibility process, member applications for waiver eligibility have been delayed. Therefore,
MMPs pushed back on the impending rate Medicaid decrease, which resulted in a slight
adjustment in the rate but still an overall decline from $96 to $83 per member per month. MMPs
reported that they cannot determine if the community cell rate is adequate because they are not
clear if their members are appropriately assigned.
7.2.3
Cost Experience
The financial implications of low enrollment and underpayment for enrollees in nursing
facilities are such that in 2017, two of the three plans identified key contractual conditions they
hoped would be met in order to continue in the demonstration beyond 2018. These conditions
included modifications to the capitated rates, specifically the Medicaid capitated rates, changes
to the savings percentage and quality withhold amount, reducing administrative burden, and
expanding eligibility for passive enrollment. Early in the demonstration, MMPs had noted that
there was a potential for cost savings through better care coordination resulting in utilization
reduction. However, MMPs reported that lower than expected enrollment, a reduction in the
community cell rate, and what they believe to be adverse selection, had resulted in financial
losses by the end of 2017. Plans indicated at that time that sustainability in the demonstration, as
it was originally designed, would be problematic.
One plan noted that the demonstration was always a “breakeven” proposition for them.
The decline in the community cell rate for fiscal year 2017 caused concerns that the
demonstration would be a financial loss, i.e., this plan could lose 1.2 million dollars in fiscal year
2018 on their demonstration product. Another plan expressed that “…in totality, we’re talking

59
about a 6–7 digit loss we’ve incurred since [the demonstration’s] inception ...” and that they are
working to improve efficiency and medically manage their population.
Two plans expressed that they believe that adverse selection was costing their plans more
than expected. MMP officials noted that members in the community cell have required intensive
services, including waiver-like services, to support them in the community and reduce transitions
to long-term care facilities. However, State officials have reported that plans are reluctant to
supply these services because of not wanting to financially sustain what MMPs see as
inefficiency in the State waiver eligibility determination system. Table 13 illustrates RTI’s
analysis of the distribution of the Hierarchical Condition Category (HCC) risk scores among
enrollees by each plan during the first demonstration year. The average HCC score across all
MMPs indicate their enrollees are predicted to have costs greater than the general Medicare FFS
population. Although we would not expect the more complex dually eligible population to be
comparable to the general Medicare FFS population, we provide these results to gauge member
medical acuity among the three MMPs. The average HCC ranged from 1.31 to 1.39, and the
median scores ranged from 1.03 to 1.11 suggesting little apparent differences in the medical risk
of enrollees across the three MMPs.
Table 13
Average, minimum, and maximum HCC score
by MMP during demonstration year 1 (February 1, 2015–December 31, 2016)
Plan
Number
of
enrollees
Average
HCC
score Min
Percentile
Max
10th 25th 50th 75th 90th
Absolute Total Care 3,774 1.39 0.27 0.55 0.80 1.11 1.62 2.57 9.75
Molina 2,904 1.31 0.27 0.54 0.74 1.03 1.50 2.40 9.63
Advicare 2,557 1.39 0.27 0.54 0.77 1.08 1.65 2.67 8.33
Select Health 5,664 1.37 0.27 0.57 0.79 1.06 1.60 2.56 10.31
HCC = Hierarchical Condition Category
NOTES: 118 enrollees have missing HCC scores and were not included in this calculation. Advicare withdrew from
the demonstration in 2016. HCC risk score is a measure of the predicted relative annual cost of a Medicare
beneficiary based on the age, gender, and the chronic conditions present in recent Medicare claims. Beneficiaries
with a score of 1 are predicted to have average cost in terms of annual Medicare expenditures. Beneficiaries with
HCC scores less than 1 are predicted to have below average costs, whereas beneficiaries with scores of 2 are
predicted to have twice the average annual costs.
At the time of this report, the State did not have information on whether the
demonstration was achieving Medicaid savings in the State. State officials reported that they
expect that average Medicaid spending per demonstration enrollee should be lower compared to
other Medicare-Medicaid dual eligible groups, in part because savings were built into the
capitated rates. State officials reported that formal cost reports and analyses are currently
underway.
In July 2018, CMS announced changes to the South Carolina demonstration that may
allay some financial concerns of all three MMPs that will participate in the demonstration
60
beyond 2018. For example, one change includes allowing passive enrollment of eligible
beneficiaries who are enrolled in Medicare Advantage D-SNP plans. State officials noted this
would increase the eligible population and expand the risk pool to include more healthy
enrollees. Other amendments included reductions to shared savings percentages, and a reduction
in some reporting and other administrative requirements. These changes fall outside the reporting
period of this report and will be discussed in future reports.

61
8. Service Utilization
Highlights
• As measured across all eligible beneficiaries, the demonstration resulted in a 19.0
percent reduction in the probability of inpatient admissions, a 16.9 percent reduction in
the probability of skilled nursing facility admission, an 18.5 percent reduction in the
probability of overall ambulatory care-sensitive condition (ACSC) admissions, and a
19.8 percent reduction in the probability of chronic ACSC admissions. Conversely, the
demonstration resulted in a 27.2 percent increase in the probability of any new long-
stay nursing facility use.
7
• These reported changes, which although appear large in percentage terms in
comparison to the comparison group, are actually quite small difference-in- differences
(DinD) changes in absolute terms, reflecting usually less than a one percentage point
change (e.g., 0.77 increase/decrease) in the probability of service use. So although the
DinD change is statistically significant, the actual change is quite small.
• DinD results for those with serious and persistent mental illness (SPMI) on the
probability of inpatient or skilled nursing facility admission or emergency room visits
were in the same direction and to a similar degree as those for all eligible beneficiaries,
as well as for the number of evaluation and management visits.
The purpose of the analyses in this section is to understand the effects of the South
Carolina Healthy Connections Prime demonstration through demonstration year 1 (ending
calendar year 2016) using DinD regression analyses that control for differences in health and
other factors between the demonstration and comparison groups. The results of these analyses
represent impact estimates of the South Carolina demonstration on all demonstration eligible
beneficiaries, not just those enrolled in a Medicare-Medicaid Plan (MMP). In addition,
descriptive statistics on service utilization are provided for selected Medicare services in
Appendix C. Utilization data were analyzed for only three of the four MMPs in Healthy
Connections Prime; Advicare encounters were not included or analyzed because RTI
International deemed them incomplete.
Table 14 presents an overview of the results from analyses using Medicare and Minimum
Data Set (MDS) data through demonstration year 1. The relative direction of all statistically
7
Caution should be used when interpreting the results on long-stay NF stays. The demonstration was associated
with an increase in the probability of long-stay NF stays, relative to the comparison group. However, State-level
eligibility determination delays for long-stay nursing facility approval could have contributed to this finding.
During the period covered by this report, long-stay nursing facility residents were excluded from being eligible
to enroll into the demonstration. However, due to delays in determining nursing facility eligibility, individuals
newly requiring long-stay nursing facility services were enrolled in the demonstration, thus raising the
probability of a long-stay nursing facility stay in the demonstration group. Potentially, if beneficiaries with those
long-stay nursing facility stays had been more quickly identified, they would have been ineligible for
demonstration enrollment.

62
significant results at the p < 0.10 significance level (derived from 90 percent confidence
intervals) is shown.
The South Carolina demonstration had a statistically significant effect on eight utilization
and quality of care outcomes through demonstration year 1: the probability of an inpatient
admission, the probability of overall and chronic ambulatory care sensitive condition (ACSC)
admissions, the probability of an emergency room (ER) visit, monthly preventable ER visits, the
probability of a skilled nursing facility (SNF) admission, and monthly physician evaluation and
management (E&M) visits all were lower for the demonstration group relative to the comparison
group. The probability of any new long-stay nursing facility (NF) use, on the other hand, was
higher. There was no statistically significant difference between the demonstration and
comparison groups in all-cause 30-day readmissions or the probability of a 30-day follow-up
visit after mental health discharge.
For the SPMI population, the demonstration had a statistically significant effect for half
of the 10 outcome measures: the probability of an inpatient admission, all-cause 30-day
readmissions, the probability of an ER visit, the probability of a SNF admission, and monthly
E&M visits were all statistically lower for the demonstration group relative to the comparison
group.
Table 14
Summary of South Carolina demonstration impact estimates for demonstration period
(February 1, 2015–December 31, 2016)
(p < 0.1 significance level)
Measure
All demonstration
eligible beneficiaries
Demonstration eligible
beneficiaries with SPMI
Probability of inpatient admission Decreased Decreased
Probability of ambulatory care sensitive condition (ACSC)
admissions, overall
Decreased NS
Probability of ACSC admissions, chronic Decreased NS
All-cause 30-day readmissions NS Decreased
Probability of emergency room (ER) visit Decreased Decreased
Preventable ER visits Decreased NS
30-day follow-up after mental health discharges NS NS
Probability of skilled nursing facility (SNF) admission Decreased Decreased
Probability of any new long-stay nursing facility (NF) use Increased N/A
Physician evaluation and management (E&M) visits Decreased Decreased
N/A = not applicable; NS = not statistically significant; SPMI = serious and persistent mental illness.
SOURCE: RTI analysis of Medicare and Minimum Data Set data.
8.1 Overview of Benefits and Services
Under Healthy Connections Prime, eligible beneficiaries enroll in a managed care plan
that covers Medicare and Medicaid services, as well as new or expanded services available under
63
the demonstration. Healthy Connections Prime plans provide care coordination, a new palliative
care benefit, and may provide flexible benefits, known in South Carolina as “waiver-like”
services to enable enrollees to postpone institutionalization or prevent higher levels of care for
frail beneficiaries. In addition, each plan has supplemental benefits available to members
enrolled in their Healthy Connections Prime products that vary by plan.
8.2 Impact Analyses on the Demonstration Eligible Population
The population analyzed in this section includes all beneficiaries who met demonstration
eligibility criteria in South Carolina or in the comparison areas for South Carolina. For context,
in South Carolina, approximately 38 percent of eligible beneficiaries in demonstration year 1
whose utilization was analyzed were enrolled in Healthy Connections Prime. Appendix A
provides a description of the comparison group for South Carolina. Please see Section 3.2.1,
Eligibility, for details on demonstration eligibility. The subsection following this section presents
the results for demonstration eligible beneficiaries with SPMI.
Appendix B contains a description of the evaluation design, the comparison group
identification methodology, data used, measure definitions, and regression methodology used in
estimating demonstration impacts using a difference-in-differences approach. The regression
methodology accounts for differences between the demonstration and comparison groups over
the predemonstration period (February 1, 2013 to January 31, 2015) and the demonstration
period (February 1, 2015, to December 31, 2016) to provide estimates of demonstration impact.
Figures 1 and 2 display the South Carolina demonstration’s effect on key service
utilization measures for the demonstration group relative to the comparison group through
demonstration year 1. The demonstration decreased the probability of inpatient admissions by
0.77 percentage points (90 percent CI: –0.93, –0.61), decreased the probability of ER visits by
0.62 percentage points (90 percent CI: –0.80, –0.45), decreased the probability of SNF
admissions by 0.20 percentage points (90 percent CI: –0.26, –0.14), and decreased monthly
E&M visits by 0.0493 visits (90 percent CI: –0.0634, –0.0353). On the other hand, the
demonstration resulted in a 1.69 percentage point increase (90 percent CI: 1.29, 2.09) in the
probability of any new long-stay NF use during the first demonstration year.
Caution should be used when interpreting the results on long-stay NF stays. The
demonstration was associated with an increase in the probability of long-stay NF stays, relative
to the comparison group. However, State-level eligibility determination delays for long-stay
nursing facility approval could have contributed to this finding. During the period covered by
this report, long-stay nursing facility residents were excluded from being eligible to enroll into
the demonstration. However, due to delays in determining nursing facility eligibility, individuals
newly requiring long-stay nursing facility services were enrolled in the demonstration, thus
raising the probability of a long-stay nursing facility stay in the demonstration group.
Potentially, if beneficiaries with those long-stay nursing facility stays had been more quickly
identified, they would have been ineligible for demonstration enrollment.

64
Figure 1
Demonstration effects on service utilization for eligible beneficiaries in South Carolina—
Difference-in-differences regression results for the demonstration period,
February 1, 2015–December 31, 2016
(90 percent confidence intervals)
E&M = evaluation and management; ER = emergency room; SNF = skilled nursing facility.
SOURCE: RTI International analysis of Medicare data.
Figure 2
Demonstration effects on long-stay nursing facility use for eligible beneficiaries in South
Carolina—Difference-in-differences regression results for the demonstration period,
February 1, 2015–December 31, 2016
(90 percent confidence interval)
NF = nursing facility.
SOURCE: RTI International analysis of Minimum Data Set data.
65
Table 15 provides estimates of the regression-adjusted mean values of the utilization
measures for the demonstration and comparison groups for the predemonstration and
demonstration periods for each service. The purpose of this table is to understand the magnitude
of the difference-in-differences (DinD) estimate relative to the adjusted mean outcome value in
each period. The values in the third and fourth columns represent the post-regression, mean
predicted value of the outcomes for each group in each period, based on the composition of a
reference population (the comparison group in the demonstration period). These values show
how different the two groups were in each period as well as the relative direction of any potential
effect in each group over time. In addition to the graphic representation above, the DinD estimate
is also provided, along with the p-value and the relative percent difference of the DinD estimate
compared to an average mean use rate for the comparison group during the first demonstration
period.

66
Table 15
Adjusted means and impact estimate for eligible beneficiaries in the demonstration and comparison groups in South Carolina
through December 31, 2016
Measure Group
Adjusted mean for
predemonstration
period
Adjusted mean for
demonstration
period
Relative
difference
(%)
Regression-adjusted
difference-in-differences
(90% confidence interval) p-value
Probability of inpatient admission Demonstration group 0.0473 0.0285 −19.0 −0.0077 <0.0001
Comparison group 0.0540 0.0405 (−0.0093, −0.0061)
Probability of ER visit Demonstration group 0.0663 0.0549 −9.0 −0.0062 <0.0001
Comparison group 0.0752 0.0691 (−0.0080, −0.0045)
Physician E&M visits Demonstration group 0.8588 0.7701 −5.4 −0.0493 <0.0001
Comparison group 0.9511 0.9063 (−0.0634, −0.0353)
Probability of SNF admission Demonstration group 0.0128 0.0067 −16.9 −0.0020 <0.0001
Comparison group 0.0179 0.0119 (−0.0026, −0.0014)
Probability of any new long-stay
NF use
Demonstration group 0.0275 0.0582 27.2 0.0169 <0.0001
Comparison group 0.0427 0.0621 (0.0129, 0.0209)
E&M = evaluation and management; ER = emergency room; NF = nursing facility; NS = not statistically significant; SNF = skilled nursing facility.
NOTES: Even though the comparison group was carefully developed to have similar characteristics to the demonstration group, there are always slight
differences in demographic, health, and area characteristics between the demonstration and comparison groups. The two types of results reported in this table
take these differences into account, but use different statistical methods to do so. Before calculating the mean values reported in the third and fourth columns in
this table, RTI adjusted the composition of the demonstration’s baseline and demonstration period groups and the comparison baseline period group to match the
characteristics of the comparison group in the demonstration period so that the means do not reflect any differences in the groups’ characteristics. The regression
DinD approach, results reported in the sixth column of this table, controls for these differences automatically, without changing the underlying characteristics of
the demonstration and comparison groups. Because of these differing methods, the difference-in-differences results obtained from the regression may differ
slightly from a similar calculation using the results in the adjusted mean columns. The relative percentage difference in the fifth column is calculated by dividing
the difference-in-differences value in column 6 by the value for the comparison group in the demonstration period in column 4.
SOURCE: RTI International analysis of Medicare and Minimum Data Set data.
67
To interpret the adjusted mean values in the third and fourth columns, as an example, the
adjusted mean of monthly inpatient admissions was lower for the demonstration group than for
the comparison group in both the predemonstration period and demonstration period. Similarly,
the adjusted mean of the probability of monthly ER visits was also lower for the demonstration
group than for the comparison group in both the predemonstration period and demonstration
period.
To help interpret the relative percentage difference reported in the fifth column, the DinD
estimate for monthly physician E&M visits of -0.0493 implies an annual relative percentage
decrease of 5.4 percent as a result of the demonstration. Similarly, the DinD estimate for the
probability of an SNF admission of -.0020 implies an annual relative percentage decrease of 16.9
percent as a result of the demonstration.
Figure 3 displays the South Carolina demonstration’s effects on RTI quality of care and
care coordination measures for the demonstration group relative to the comparison group through
demonstration year 1. The demonstration decreased monthly preventable ER visits by 0.0026
visits (90 percent CI: −0.0041, −0.0010). The demonstration also resulted in a 0.18 percentage
point decrease (90 percent CI: −0.0026, −0.0010) in the probability of an ACSC admission for
overall conditions and a 0.11 percentage point decrease (90 percent CI: −0.0018, −0.0005) for
ACSC chronic condition admissions. There was no statistically significant demonstration effect
on the probability of a 30-day follow-up after a mental health discharge or all-cause 30-day
readmissions through demonstration year 1.

68
Figure 3
Demonstration effects on RTI quality of care measures for eligible beneficiaries in South
Carolina—Difference-in-differences regression results for the demonstration period,
February 1, 2015–December 31, 2016
(90 percent confidence intervals)
ACSC = ambulatory care sensitive condition; ER = emergency room.
SOURCE: RTI International analysis of Medicare data.
Table 16 provides estimates for the regression-adjusted mean value for each of the
demonstration and comparison groups for the predemonstration and demonstration periods for
the RTI quality of care and care coordination measures. The purpose of this table is to
understand the magnitude of the DinD estimates for quality of care outcomes relative to the
69
adjusted mean values in each period. The values in the third and fourth column represent the
post-regression, mean predicted value of the outcomes for each group in each period, based on
the composition of a reference population (the comparison group in the demonstration period).
These values show how different the two groups were in each period and the relative direction of
any potential effect in each group over time. In addition to the graphic representation above, the
DinD estimate is also provided for reference, along with the p-value and the relative percent
change of the DinD estimate compared to an average mean use rate for the comparison group
during the first demonstration year.
To interpret the adjusted mean values in the third and fourth columns, as an example, the
adjusted mean of preventable ER visits was lower for the demonstration group than for the
comparison group in both the predemonstration period and the demonstration period.
To help interpret the relative percentage difference reported in the fifth column, the DinD
estimate for the probability of an ACSC admission (overall) implies an annual relative
percentage decrease of 18.5 percent as a result of the demonstration; and the DinD estimate for
the probability of an ACSC admission (chronic) implies an annual relative percentage decrease
of 19.8 percent as a result of the demonstration.

70
Table 16
Adjusted means and impact estimate for eligible beneficiaries in the demonstration and comparison groups in South Carolina
through the demonstration period February 1, 2015–December 31, 2016
Measure Group
Adjusted mean for
predemonstration
period
Adjusted mean for
demonstration
period
Relative
difference
(%)
Regression-adjusted
difference-in-
differences estimate
(90% confidence
interval)
p-value
Preventable ER visits Demonstration group 0.0395 0.0335 −6.0 −0.0026 0.0066
Comparison group 0.0468 0.0425 (−0.0041, −0.0010)
Probability of ACSC admission, overall Demonstration group 0.0113 0.0067 −18.5 −0.0018 0.0004
Comparison group 0.0131 0.0096 (−0.0026, −0.0010)
Probability of ACSC admission, chronic Demonstration group 0.0068 0.0038 −19.8 −0.0011 0.0037
Comparison group 0.0083 0.0058 (−0.0018, −0.0005)
Probability of 30-day follow-up after
mental health discharge
Demonstration group 0.2290 0.2248 NS −0.0567 0.2417
Comparison group 0.2269 0.2734 (−0.1364, 0.023)
All-cause 30-day readmissions Demonstration group 0.2824 0.3398 NS −0.0045 0.8153
Comparison group 0.3450 0.4197 (−0.0366, 0.0275)
ACSC = ambulatory care sensitive conditions; ER = emergency room.
NOTES: Even though the comparison group was carefully developed to have similar characteristics to the demonstration group, there are always slight
differences in demographic, health, and area characteristics between the demonstration and comparison groups. The two types of results reported in this table
take these differences into account, but use different statistical methods to do so. Before calculating the mean values reported in the third and fourth columns in
this table, RTI adjusted the composition of the demonstration’s baseline and demonstration period groups and the comparison baseline period group to match the
characteristics of the comparison group in the demonstration period so that the means do not reflect any differences in the groups’ characteristics. The regression
DinD approach, results reported in the sixth column of this table, controls for these differences automatically, without changing the underlying characteristics of
the demonstration and comparison groups. Because of these differing methods, the difference-in-differences results obtained from the regression may differ
slightly from a similar calculation using the results in the adjusted mean columns. The relative percentage difference in the fifth column is calculated by dividing
the difference-in-differences value in column 6 by the value for the comparison group in the demonstration period in column 4.
SOURCE: RTI International analysis of Medicare data.
71
8.2.1
Descriptive Statistics on the Demonstration Eligible Population
In addition to the findings presented for the demonstration eligible population in this
section, Appendix C, Tables C-1 through C-3 present descriptive statistics for the demonstration
eligible population for each service for the predemonstration and demonstration years to help
understand the utilization experience over time. We examined 12 Medicare service utilization
measures, 7 RTI quality of care measures, and 5 nursing facility-related measures derived from
the MDS. No testing was performed between groups or years. The results reflect the underlying
experience of the two groups, and not the DinD estimates presented earlier.
The demonstration and comparison groups were similar across many of the service
utilization measures in each of the predemonstration (baseline) years and the first demonstration
year (Table C-1). There was no notable difference in institutional or non-institutional service
utilization between the comparison and demonstration group across the predemonstration and
demonstration period, except for lower outpatient therapy and higher independent therapy
utilization among demonstration users. The demonstration group was similar to the comparison
group on many, but not all, of the RTI quality of care and care coordination measures
(Table C-2). Key differences included higher rates of all-cause 30-day readmission and 30-day
follow-up after hospitalization for mental illness for the demonstration group in the
predemonstration period. Finally, there are more differences between the demonstration group
and comparison group in long-stay NF utilization (Table C-3), including lower rates of long-stay
NF admissions and fewer new long-stay NF users in the demonstration group. Demonstration
eligible beneficiaries also had a higher percentage with severe cognitive impairment relative to
the comparison group in the predemonstration period.
8.2.2
Impact Analyses on the Demonstration Eligible Population with SPMI
Demonstration eligible beneficiaries were defined for the Financial Alignment Initiative
(FAI) evaluation as having SPMI if there were any inpatient or outpatient mental health visits for
schizophrenia or bipolar disorders in the last 2 years (see Appendix B, page 6 for additional
information). Approximately 25 percent of all eligible beneficiaries had SPMI in demonstration
year 1. As was true for the overall demonstration eligible population, demonstration eligible
beneficiaries with SPMI had a lower probability of inpatient admissions, ER visits, SNF
admissions, and lower physician E&M visits relative to the comparison group; there was no
statistically significant effect on the probability of a 30-day follow-up after a mental health
discharge. Although the number of preventable ER visits and the probability of ACSC
admissions (overall and chronic) in the overall demonstration eligible population were lower,
there were no statistically significant effects on these outcomes for demonstration eligible
beneficiaries with SPMI. Conversely, all-cause 30-day readmissions for demonstration eligible
beneficiaries with SPMI were lower, while no significant effect was found for the overall
population.
Figure 4 displays the demonstration’s effects on key service utilization measures for the
demonstration eligible population with SPMI. Demonstration effects include a lower probability
of inpatient admissions by 1.28 percentage points (90 percent CI: –0.0175, –0.0082), a lower
probability of ER visits by 0.65 percentage points (90 percent CI: –0.0128, –0.0002), a lower
probability of SNF admissions by 0.44 percentage points (90 percent CI: –0.0070, –0.0017), and

72
lower monthly E&M visits by 0.0609 visits (90 percent CI: –0.0986, –0.0233) among
beneficiaries with SPMI.
Figure 4
Demonstration effects on service utilization for eligible beneficiaries with SPMI in South
Carolina—Difference-in-differences regression results for the demonstration period,
February 1, 2015–December 31, 2016
(90 percent confidence intervals)
E&M = evaluation and management; ER = emergency room; SNF = skilled nursing facility.
SOURCE: RTI International analysis of Medicare data.
Figure 5 displays the demonstration’s effects on RTI quality of care and care
coordination measures for the demonstration eligible population with SPMI. The demonstration
lowered all-cause 30-day readmissions by 0.1066 admissions (90 percent CI: −0.2070, −0.0062)
relative to the comparison group. There were no statistically significant demonstration effects on
preventable ER visits, the probability of ACSC admissions (overall and chronic), or the
probability of a 30-day follow-up after a mental health discharge among beneficiaries with
SPMI.

73
Figure 5
Demonstration effects on quality of care and care coordination for eligible beneficiaries
with SPMI in South Carolina—Difference-in-differences regression results for the
demonstration period, February 1, 2015–December 31, 2016
(90 percent confidence intervals)
ACSC = ambulatory care sensitive conditions; ER = emergency room.
SOURCE: RTI International analysis of Medicare data.
8.2.3
Service Use for Enrollee and Non-Enrollee Populations in South Carolina
To provide insights into the utilization experience over time within the South Carolina
demonstration, Tables C-4 and C-5 in Appendix C present descriptive statistics for the enrolled
74
population, compared to those demonstration eligible beneficiaries who were not enrolled, for
each service in the first demonstration year.
There were some observable patterns in terms of service utilization for demonstration
eligible enrollees versus non-enrollees during the first demonstration year. For example,
enrollees were less likely to use inpatient, SNF, hospice, and outpatient therapy care (Table C-4).
For the quality of care and care coordination measures, enrollees have lower all-cause 30-day
readmissions, 30-day follow-up for hospitalization for mental illness, and ACSC admissions.
(Table C-5).
8.2.4
Service Use by Demographic Characteristics of Eligible Beneficiaries
To examine any differences in racial and ethnic groups, Figures 6, 7, and 8 provide
month-level results for five settings of interest for South Carolina’s eligible beneficiaries:
inpatient admissions, emergency department visits (non-admit), hospice admissions, primary
care E&M visits, and outpatient therapy (physical therapy [PT], occupational therapy [OT], and
speech therapy [ST]) visits. Results across these five settings are displayed using three measures:
percentage with any use of the respective service, counts per 1,000 eligible beneficiaries with
any use of the respective service, and counts per 1,000 demonstration eligible beneficiaries.
Figure 6 presents the percentage of use of selected Medicare services. White and Black
beneficiaries appeared to have higher inpatient admissions, emergency department visits, hospice
admissions, primary care visits, and outpatient therapy visits relative to other racial categories.
Regarding counts of services used among users of each respective service, as presented in
Figure 7, there were limited differences across racial groups for inpatient admissions, emergency
department visits, hospice use, and physician E&M visits. However, White and Black
beneficiaries received more outpatient therapy visits in months where there was any use, relative
to other racial groups, with Hispanic beneficiaries having the lowest use if any use.
Figure 8 presents counts of services across all South Carolina demonstration eligible
beneficiaries regardless of having any use of the respective services. Trends for utilization across
all service settings were broadly similar to those displayed in Figure 6, with White and Black
beneficiaries appearing to have higher use than Asian and Hispanic beneficiaries.

75
Figure 6
Percent with use of selected Medicare services

76
Figure 7
Service use among all demonstration eligible beneficiaries with use of service per 1,000 user months

77
Figure 8
Service use among all demonstration eligible beneficiaries per 1,000 eligible months
78
[This page intentionally left blank.]

79
9. Quality of Care
9.1 Quality Measures
The Healthy Connections Prime demonstration requires that Healthy Connections Prime
plans report standardized quality measures. These measures include:
• A set of core measures specific to all capitated model demonstrations under the
Financial Alignment Initiative that address domains of access, assessment, care
coordination, enrollee protection, organization structure and staffing, performance
and quality improvement, provider network, and systems and service utilization
(CMS, 2017b).
• A set of 16 State-specific measures that were selected by SCDHHS staff in
consultation with CMS after considering feedback from stakeholders (South Carolina
three-way contract, 2014, p. 286). These measures covered preventive services,
disease management, acute care utilization, cost, nursing facility quality measures,
HCBS consumer satisfaction, HCBS use, and care transition planning and
management. By 2018, the number of State-specific measures had been reduced to
seven (CMS, 2017b).
CMS and the State use reporting and performance data on several of the core and State-
specific measures to determine what portion of the capitation rates retained by CMS and the
State as a “quality withhold” will be repaid to the MMP.
The demonstration also utilizes quality measures required of Medicare Advantage plans,
including applicable measures from the Part C and Part D Reporting Requirements such as
appeals and grievances, pharmacy access, payment structures, and medication therapy
management.
Highlights
• Early in the demonstration, MMPs identified low enrollment as a major barrier to
monitoring and evaluating quality and quality of care for enrollees. This was mitigated
after enrollment grew in 2017, although quality monitoring of subgroups such as
HCBS users has remained challenging.
• Plans implemented quality improvement programs in 2016 and 2017, specifically for
influenza, pneumonia vaccination, fall prevention, and support for caregivers. One
program contributed to the expansion of respite care providers in South Carolina.
• Multiple plans noted that their community members have complex needs and require
HCBS waiver services to remain in the community, but are not eligible or otherwise
face long wait times for HCBS eligibility determination.
80
Healthy Connections Prime plans are required to submit three additional measure sets as
part of the Medicare Advantage requirement:
• A modified version of the Medicare Advantage Prescription Drug plan (MA-PD)
Consumer Assessment of Healthcare Providers and Systems (CAHPS) survey that, in
addition to the core survey used by Medicare Advantage plans, includes 10
supplemental questions proposed by the RTI Evaluation Team to capture beneficiary
experience specific to integration, behavioral health and LTSS (see Section 5,
Beneficiary Experience, for CAHPS findings);
• The subset of Medicare Healthcare Effectiveness Data and Information Set (HEDIS)
measures, a standard measurement set used extensively by managed care plans, that
are required of all Medicare Advantage plans; and
• Selected Health Outcomes Survey (HOS) measures based on a recurring survey of a
random sample of Medicare beneficiaries to assess physical and mental health
outcomes (South Carolina three-way contract, 2014).
Data related to these measures are reported in relevant sections of this report.
In addition, the RTI Aggregate Evaluation Plan identified a set of quality measures that
will be calculated by the RTI team using encounter and fee-for-service (FFS) data. Many of these
measures are part of the HEDIS measurement set and are largely clinical in nature (e.g.,
preventive screens, follow-up care) or related to service use (e.g., avoidable hospitalizations,
emergency department use) (Walsh et.al., 2013, pp. 77–85).
State officials have used the State-specific and core measures to monitor and assess
performance. Originally, State officials noted that encounter data were expected to be used to
more fully evaluate the performance of plans and analyze trends in utilization to identify areas
for quality improvement. However, the State has not been able to utilize MMP encounter data for
quality management due to challenges with implementing the State’s encounter data system and
MMP difficulties with submitting encounters. State officials expressed frustration with this
limitation, noting their primary methods for tracking quality among the MMPs were non-
encounter-based measures, such as ratio of care coordinators to enrollees, assessment completion
rate, and average time for assessment completion. In early 2017, State officials approached CMS
about extensive delays in accessing encounter data (which were associated with the use of the
State’s new data management platform). Through collaborative efforts which entail forwarding
the data to the State from CMS’s central data repository, the State has accessed all encounters
submitted since the demonstration’s launch in 2015 and receives current weekly encounter
submissions.
During the first year, MMP officials reported no difficulty meeting the quality target for
completing assessments within 60 days for high- to moderate-risk members. However, after
passive enrollment began and enrollments grew, plans found it more difficult to meet the 60-day
assessment window. As passive enrollment began in 2016, the ratio of enrollees to care
coordinators increased. For further discussion on MMP performance on care coordination and
staffing metrics, please see Table 6 in Section 4.1.1, Assessment, and Table 7 in Section 4.1.3,
81
Care Planning Process. The State recognized the MMPs’ administrative burden of the 60-day
assessment window; the July 2018 contract amendment extends the assessment window to 90
days for moderate and high risk enrollees (CMS, 2018a). The results of this change will be
explored in future reports.
MMPs consistently identified delays in passive enrollment and low enrollment as major
barriers to monitoring and evaluating utilization and quality of care for enrollees during the first
2 years of the demonstration. In calendar years 2015 and 2016, MMPs reported that the
denominators were too small to reliably monitor quality of care. For example, according to
NORC monitoring reports, one plan had only four members who qualified to be in the 90-day
assessment denominator for low risk enrollees in at least one quarter during the first year of the
demonstration. Despite MMP concerns on the impact of low enrollment on quality withhold
performance, three MMPs received 100 percent of the withhold amount for the first
demonstration year (both calendar years 2015 and 2016). The quality withhold analysis has not
yet been completed for the second demonstration year (calendar year 2017).
After the first wave of passive enrollment began in April 2016, MMPs expressed more
confidence in their performance on most quality measures, and a greater capacity to monitor
utilization of their enrollees. However, enrollment remained too small to identify unique quality
concerns for subpopulations, such as those with long-term services and supports (LTSS) and
behavioral health needs. By the third annual interviews in 2017, officials in two of the three
plans noted their concern with access to care for those with LTSS and behavioral health needs.
Specifically, MMPs noted that many non-waiver enrollees needed flexible, waiver-like services
to reduce avoidable hospitalizations and remain in the community. State officials further noted
that errors and delays in their eligibility system have resulted in barriers for enrollees, who would
otherwise qualify for HCBS waiver services, to gain access to these services. MMPs have the
option of providing waiver-like services to members in the community, but State officials noted
MMPs are reluctant to do so because it would effectively subsidize the State’s inefficient waiver
eligibility process. As a result, access to HCBS services for those with LTSS needs was
identified as a quality of care challenge by MMPs. In fall 2017, approximately 200 enrollees had
been waiting for nearly a year for HCBS waiver determination, according to State officials.
In 2018, the State responded to MMPs’ concerns around the HCBS waiver determination
process by making extensive reforms and streamlining the process. The impact of these changes
will be discussed in more detail in a future report.
As discussed in Section 5, Beneficiary Engagement, MMP officials noted they also have
challenges meeting the behavioral health needs of their members because of the limitations of the
existing behavioral health delivery system to support older adults in South Carolina. Specifically,
MMP officials reported poor access to community mental health resources, especially for those
with cognitive impairments such as dementia.
9.2 Quality Management Structures and Activities
This section examines the components of the Healthy Connections Prime quality
management system, including its interface with CMS, Healthy Connections Prime plans, and
other independent entities, and describes how well the quality management system is working
82
from various perspectives. The quality management structure for Healthy Connections Prime can
be categorized into four components: (1) joint monitoring and oversight by the contract
management team; (2) external quality review activities; (3) quality and performance
improvement activities undertaken by the MMPs; and (4) quality and measurement reporting by
the MMPs to CMS and SCDHHS. The MMPs are required to maintain an organizational
structure that allows for continuous quality improvement activities (South Carolina three-way
contract, pp. 146–9).
9.2.1
State and CMS Quality Management Structures and Activities
The contract management team (CMT) is responsible for providing monitoring and
oversight of MMPs programs, operation, and performance. The CMT monitors MMP
compliance with the terms of the contract, issues joint notices of non-compliance, coordinates
periodic audits and surveys, conducts bi-weekly meetings with the MMPs, provides technical
assistance as needed, reviews marketing materials and reviews grievance and appeals (South
Carolina three-way contract, 2014, p. 180). Early in the demonstration, the CMT required MMPs
to submit a weekly operations report to the CMT that entailed updates on initial and
comprehensive assessments, and completion rates. These reports are now monthly and include
updates on enrollments, contacts with members, and care plan development and are the basis for
discussions on occasional calls between the CMT and the MMPs. The State compiles this
information into an operations executive dashboard designed to improve identification of
potential quality concerns.
9.2.2
Healthy Connections Prime MMP Quality Management Structure and Activities
The MMPs are required to maintain a quality improvement organizational and program
structure consistent with the most current National Committee for Quality Assurance (NCQA)
Health Plan Accreditation requirements (South Carolina three-way contract, 2014, p. 141). The
responsibilities of the MMPs are to establish quality improvement (QI) functions and
responsibilities consistent with the number and type of QI initiatives, provide adequate staffing
to support those functions, and complete an evaluation report of those activities at least once a
year. In addition, QI criteria must also be applied to the MMPs’ utilization management program
to detect under- and/or over-utilization (South Carolina SCDHHS, 2015).
MMPs engaged in quality improvement programs (QIPs) related to caregiver education
and access to caregiver resources. Previously, MMPs engaged caregivers during the home visits
to enrollees or through multidisciplinary team meetings for enrollees. During the QIPs, two
MMPs found it difficult to engage caregivers in new ways; however, one MMP had successfully
created new pathways for respite care through its QIP. This MMP outreached to nursing
facilities, eight of which agreed to create respite beds in their facilities; the MMP then informed
the caregivers of this new, expanded service. This was considered a great success by State
officials. Caregiver education was a focus of another MMP, but State officials noted that
caregiver participation in this program was low as a result of limited caregiver time available for
activities other than direct caregiving. Plans also implemented QIPs specifically for influenza
and pneumonia vaccination. Conclusions or major findings from these QIPs were not yet
available at the time of this report.

83
9.2.3
Independent Quality Management Structures and Activities
Ombudsman and Prime Advocate. As discussed in Section 5.2.9, Beneficiary
Protections, South Carolina contracted with the State’s Long-Term Care Ombudsman Program
to create ombudsman services for the demonstration. Known as the Prime Advocate, this office
resolves complaints about Healthy Connections Prime and also conducts outreach to
stakeholders and beneficiaries. The Prime Advocate office is part of the CMT and works directly
with individual plans.
External quality review activities. SCDHHS contracted with the Carolinas Center for
Medical Excellence (CCME) to be Healthy Connections Prime’s External Quality Review
Organization (EQRO). CCME’s work with the demonstration is an extension of an existing
contract with SCDHHS for monitoring quality of South Carolina’s Medicaid MCOs. The EQRO
conducts annual validation of performance measures, and, according to one State official,
worked with MMPs to develop quality improvement project criteria. The EQRO is also required
to validate the overall quality, access, structure and operations, and services provided by the
MMP once every 3 years (South Carolina three-way contract, 2014, p. 151). According to State
officials, the EQRO helped to determine the qualification standards for plans to participate in
Healthy Connections Prime, HCBS network standards, and provided technical assistance to
MMPs as needed. In fall 2017, State officials noted that annual reviews of MMPs by the CCME
have been put on hold pending the decision regarding the continuation of the demonstration.
9.3 Results for Selected Quality Measures
9.3.1
HEDIS Quality Measures Reported for Healthy Connections Prime Plans
Fourteen Medicare HEDIS measures for MMP enrollees are reported in Table 17. RTI
identified these measures for reporting in this Evaluation Report after reviewing the list of
measures we previously identified in RTI’s Aggregate Evaluation Plan as well as the available
HEDIS data on these measures for completeness, reasonability, and sample size; 2016 calendar
year data were available for three of the four Healthy Connections Prime plans. Full-year data
were not available for the Advicare Advocate MMP. Detailed descriptions of the measures can
be found in the RTI Aggregate Evaluation Plan.
8
Results were reported for measures with a
sample size greater than 30 beneficiaries. In addition to reporting the results for each MMP, the
mean value for Medicare Advantage plans for each measure is provided for comparison.
We provide national benchmarks from Medicare Advantage plans, where available,
understanding that Medicare Advantage enrollees and demonstration enrollees may have
different health and sociographic characteristics which would affect the results. Previous studies
on health plan performance reveal poorer quality ratings for plans serving a higher proportion of
dual eligible beneficiaries and beneficiaries with disabilities. HEDIS measure performance, in
particular, is slightly worse among plans active in areas with lower income and populations with
a higher proportion of minorities (Office of the Assistant Secretary for Planning and Evaluation,
2016). Benchmarks should be considered with that limitation in mind. These findings on South
Carolina MMP HEDIS measure performance represent the early experience in the demonstration
8
https://www.cms.gov/Medicare-Medicaid-Coordination/Medicare-and-Medicaid-Coordination/Medicare-
Medicaid-Coordination-Office/FinancialAlignmentInitiative/Downloads/EvalPlanFullReport.pdf

84
and are likely to change over time as MMPs gain more experience in working with enrollees.
Monitoring trends over time in MMP performance may be more important than the comparison
to the national Medicare Advantage plans given the population differences. Several years of
HEDIS results are likely needed to know how well MMPs perform relative to each other and
whether they perform above or below any potential benchmark.
For each measure, results across MMPs vary, and there is no consistent trend across
measures for one MMP versus other MMPs. For two measures reported (adults’ access to
preventive/ambulatory health services and annual monitoring for members on diuretics), all
MMPs performed better than the national Medicare Advantage benchmark value (94.7 and 92.9
percent, respectively). All reported plans performed well below the national benchmark value for
colorectal cancer screening, blood pressure control, and good control of HbA1c levels among
those receiving comprehensive diabetes care. However, Molina performed better than the
national Medicare Advantage benchmark value on other comprehensive diabetes care related
measures such as the provision of medical attention for nephropathy (97.8 percent) and reception
of a retinal eye exam (73.3 percent). All plans reported fewer outpatient visits and greater
emergency department visits than the Medicare Advantage benchmark.
Table 17
Selected HEDIS measures for Healthy Connections Prime plans, 2016
Measure
National Medicare
Advantage Plan
Mean (2016)
Absolute
Total Care
First Choice VIP
Care Plus (Select
Health) Molina
Adults’ access to preventive/ambulatory health
services 94.7% 97.2% 95.6% 95.3%
Adults BMI 93.9% 86.5% 83.3% 94.7%
Annual monitoring for patients on persistent
medications
Annual monitoring for members on angiotensin
converting enzyme (ACE) inhibitors or
angiotensin receptor blockers (ARB) 92.4% 93.0% 91.0% 95.1%
Annual monitoring for members on digoxin
57.3% — 33.3% —
Annual monitoring for members on diuretics
92.9% 94.7% 94.1% 93.8%
Total rate of members on persistent
medications receiving annual monitoring
92.1% 93.3% 91.3% 93.8%
Antidepressant medication management
Effective acute phase treatment
1
69.3% — — —
Effective continuation phase treatment
2
54.3% — — —
Blood pressure control
3
69.0% 40.3% 40.4% 51.5%
Breast cancer screening 71.6% — — —
Care of older adults
4
Advance care planning
N/A 9.3% 17.8% 37.8%
Medication review
N/A 84.2% 58.3% 86.5%
Functional status assessment
N/A 90.2% 39.6% 63.5%
Pain assessment
N/A 92.8% 48.6% 87.8%
(continued)

85
Table 17 (continued)
Selected HEDIS Measures for Healthy Connections Prime Plans, 2016
Measure
National Medicare
Advantage Plan
Mean (2016)
Absolute
Total Care
First Choice VIP
Care Plus (Select
Health) Molina
Colorectal cancer screening 66.2% 45.5% 33.0% 58.5%
Comprehensive diabetes care
Received Hemoglobin A1c (HbA1c) testing
93.4% 91.6% 92.0% 100.0%
Poor control of HbA1c level (>9.0%) (higher is
worse) 27.2% 41.1% 62.0% 33.3%
Good control of HbA1c level (<8.0%)
62.2% 53.7% 31.9% 57.8%
Received eye exam (retinal)
70.0% 46.3% 51.3% 73.3%
Received medical attention for nephropathy
95.6% 90.5% 95.6% 97.8%
Blood pressure control (<140/90 mm Hg)
69.0% 48.4% 46.0% 64.4%
Disease modifying anti-rheumatic drug
therapy in rheumatoid arthritis
76.6% — — —
Follow-up after hospitalization for mental
illness (30 days) 53.2% — — —
Initiation and engagement of alcohol and other
drug (AOD) dependence treatment
Initiation of AOD treatment
5
32.3% — 35.5% —
Engagement of AOD treatment
6
3.5% — 0 —
Plan all-cause readmissions (Average adjusted
probability total) — — — —
Ambulatory care (per 1,000 members)
Outpatient visits
9,181.9 5492.1 7803.5 8,447.7
Emergency department visits
637.8 920.7 794.1 841.8
NOTES: — = not available or the number of enrollees in the plan’s provided HEDIS data available for inclusion in
the measure was less than 30, and therefore not reported per RTI’s decision rule for low addressing sample size.
Detailed descriptions of HEDIS measures presented can be found in the RTI Aggregate Evaluation Plan:
https://www.cms.gov/Medicare-Medicaid-Coordination/Medicare-and-Medicaid-Coordination/Medicare-Medicaid-
Coordination-Office/FinancialAlignmentInitiative/Downloads/EvalPlanFullReport.pdf
1
Represents the percentage of members who remained on an antidepressant medication for at least 84 days
(12 weeks).
2
Represents the percentage of members who remained on an antidepressant medication for at least 180 days
(6 months).
3
The following criteria were used to determine adequate blood pressure control: less than 140/90 mm Hg for
members 18–59 years of age; diagnosis of diabetes and <140/90 mm Hg for members 60–85 years of age; no
diagnosis of diabetes and <150/90 mm Hg for members 60–85 years of age.
4
There is no Medicare Advantage benchmark for these measures as they are not required.
5
Represents percentage of members who initiate treatment through an inpatient AOD admission, outpatient visit,
intensive outpatient encounter or partial hospitalization within 14 days of the diagnosis.
6
Represents the percentage of members who initiated treatment and who had two or more additional services with a
diagnosis of AOD within 30 days of the initiation visit.
SOURCE: RTI analysis of 2016 HEDIS measures.
86
[This page intentionally left blank.]

87
10. Cost Savings Calculation
As part of the capitated financial alignment model, South Carolina, CMS, and health
plans have entered into a three-way contract to provide services to Medicare-Medicaid enrollees
(CMS, 2013). Participating health plans receive prospective blended capitation payment to
provide both Medicare and Medicaid services for enrollees. CMS and South Carolina developed
risk-adjusted capitation rates for Medicare Parts A, B, and D, and Medicaid services to reflect the
characteristics of enrollees. The Medicare component of the payment is risk-adjusted using
CMS’ hierarchical risk-adjustment model. The rate development process is described in greater
detail in the Memorandum of Understanding and the three-way contract, and a description of the
risk-adjusted Medicare components of the rate are described in the Final Rate Reports (CMS and
State of South Carolina, 2013b).
The capitation payment incorporates savings assumptions over the course of the
demonstration. The same savings percentage is prospectively applied to both the Medicare Parts
A and B and Medicaid components of the capitation payment, so that both payers can recognize
proportional savings from this integrated payment approach, regardless of whether the savings is
driven disproportionately by changes in utilization of services typically covered by Medicare or
Medicaid. The goal of this methodology is to minimize cost shifting, to align incentives between
Medicare and Medicaid, and to support the best possible outcomes for enrollees.
This chapter presents preliminary Medicare Parts A and B savings calculations for the
first 23 months of the demonstration period using an intent-to-treat (ITT) analytic framework
that includes beneficiaries eligible for the demonstration rather than only those who enrolled.
More than 20,726 Medicare-Medicaid beneficiaries in South Carolina were eligible for and
approximately 11,511 (56 percent) enrolled in the demonstration as of December 2017.
The Medicare calculation presented here uses the capitation rate for beneficiaries enrolled
in the demonstration, and not the actual payments that plans made to providers for services, so
the savings are calculated from the perspective of the Medicare program. A similar approach will
be applied to the Medicaid savings calculation when data is available. Part D costs are not
included in the savings analysis.
Highlights
• RTI conducted a preliminary estimate of Medicare savings using a difference-in-
differences analysis examining beneficiaries eligible for the demonstration in the
South Carolina demonstration area and comparison areas.
• The results of the preliminary cost analyses of beneficiaries eligible for the
demonstration do not show statistically significant savings or losses as a result of the
demonstration. This aligns with CMS expectations, given rate structure and
modifications during the demonstration period covered.
88
The results shown here reflect quality withhold repayments for the period February 2015
to December 2016 but do not reflect the results of medical loss ratio (MLR) calculations. Note
that Medicare and Medicaid savings calculations will be conducted by RTI for each year of the
demonstration as data are available.
The following sections discuss the analytic approach and results of these analyses.
10.1 Evaluation Design
To assess the impact of the demonstration on Medicare costs for Medicare-Medicaid
enrollees, RTI used an ITT approach comparing the population eligible for the South Carolina
demonstration with a comparison group not affected by the demonstration. An ITT approach
diminishes the potential for selection bias and highlights the effect of the demonstration on all
beneficiaries in the demonstration eligible population. All Medicare-Medicaid enrollees eligible
for the demonstration constitute the evaluation sample, regardless of whether they enrolled in the
demonstration or actively participated in the demonstration care model. Therefore, the analyses
presented here cover demonstration eligible beneficiaries including those who opted out, or who
participated but subsequently disenrolled; who were eligible but were not contacted by the State
or participating plans; and those who enrolled but did not seek services.
Beneficiaries eligible for the demonstration were identified using quarterly eligibility
files submitted by the State of South Carolina. These files include information on all
beneficiaries eligible for the demonstration, as well as indicators for whether each beneficiary
was enrolled.
A comparison group was identified in two steps. First, RTI identified comparison areas
that are most similar to South Carolina with regard to area-level measures of health care market
characteristics such as Medicare and Medicaid spending and State policy affecting Medicaid-
Medicare enrollees. Second, beneficiaries were selected using a propensity score model
(described in further detail below). Further discussion of the comparison group selection process
and propensity scoring is detailed in Appendix A.
RTI used a difference-in-differences (DinD) approach to evaluate the impact of the
demonstration on Medicare costs, which is an analytic strategy whereby two groups—one
affected by the policy intervention and one not affected by it—are compared on an outcome of
interest before and after the policy intervention. The predemonstration period included 2 years
prior to the start of the South Carolina demonstration (February 1, 2013–January 31, 2015), the
first demonstration period (demonstration year 1) included the first 23 months of the
demonstration (February 1, 2015–December 31, 2016).
To estimate the average treatment effect on the demonstration eligible population for
monthly Medicare expenditures, RTI ran generalized linear models (GLMs) with a gamma
distribution and a log link. This is a commonly used approach in analysis of skewed data or in
cases where a high proportion of observations may have values equal to zero. The model also
employed propensity score weighting and adjusted for clustering of observations at the county
level.
89
The GLM model included indicators for demonstration period, an indicator for
assignment to the demonstration group versus the comparison group, and an interaction term for
demonstration period and demonstration assignment. The model also included demographic
variables and area-level variables. The interaction term represents the combined effect of being
part of the demonstration eligible group during the demonstration periods and is the key policy
variable of interest. The interaction term is a way to measure the impact of both time and
demonstration group status. Separate models were run to distinguish between overall savings
(pre- versus postdemonstration) as well as savings for each demonstration period. Because the
difference-in-difference variable was estimated using a non-linear model, RTI employed a post-
estimation procedure to obtain the marginal effects of demonstration impact. The aggregation of
the individual marginal effects represents the net demonstration impact and are reported below.
• Demographic variables included in the model were:
– Gender,
– Race, and
– End-stage renal disease (ESRD) status.
• Area-level variables included in the savings model were:
– Medicare spending per Medicare-Medicaid enrollee age 19 or older
– Medicare Advantage penetration rate
– Medicaid-to-Medicare fee for service (FFS) fee index for all services
– Medicaid spending per Medicare-Medicaid enrollee age 19 or older
– Proportion of Medicare-Medicaid enrollees using
▪ Nursing facilities age 65 or older
▪ Home and community-based services (HCBS) age 65 or older
▪ Personal care age 65 or older
▪ Medicaid managed care age 19 or older
– Population per square mile, and physicians per 1,000 population
Additional area-based variables—such as the percent of adults with a college degree and
proximity to hospitals or nursing facilities—were used as proxies for sociodemographic
indicators and local area characteristics. Note that these variables were also used in the
comparison group selection process. Individual beneficiary demographic characteristics are
controlled for in the models and are also accounted for in the propensity score weights used in
the analysis.

90
In addition to the variables noted here, the propensity score weights used in the cost
savings analyses also include Hierarchical Condition Category (HCC) risk score. HCC risk score
is not included as an independent variable in the regression models predicting costs because
HCC risk score is directly related to capitated payments. Due to the potential for differences in
diagnoses coding for enrollees compared to beneficiaries in FFS after the start of the
demonstration, the HCC risk score used to calculate the weights was “frozen” to the value at the
start of the demonstration period. Diagnoses codes are the basis for risk score calculations, and
by freezing the score prior to any potential impact of the demonstration, we are able to control
for baseline health status using diagnosis codes available prior to the demonstration.
10.2 Medicare Expenditures: Constructing the Dependent Variable
RTI gathered predemonstration and demonstration monthly Medicare expenditure data
for both the demonstration and comparison groups from two data sources. Capitation payments
paid to Medicare Advantage plans and paid to Healthy Connections Prime plans were obtained
from CMS Medicare Advantage and Prescription Drug system (MARx) data. The capitation
payments were the final reconciled payments paid by the Medicare program after taking into
account risk score reconciliation and any associated retroactive adjustments in the system at the
time of the data pull (September 2018). Medicare claims were used to calculate Medicare Parts A
and B expenditures for fee-for-service beneficiaries. Table 18 summarizes the data sources for
Medicare expenditure data.
Table 18
Data sources for monthly Medicare expenditures
Group
Predemonstration
February 1, 2013–January 31, 2015
Demonstration period
February 1, 2015–December 31, 2016
Demonstration group Medicare FFS Medicare FFS for non-enrollees
Medicare Advantage Capitation for non-enrollees
Healthy Connections Prime Capitation for enrollees
Comparison group Medicare FFS Medicare FFS
FFS = fee for service.
A number of adjustments were made to the monthly Medicare expenditures to ensure that
observed expenditures variations are not due to differences in Medicare payment policies in
different areas of the country or the construction of the capitation rates. Table 19 summarizes
each adjustment and the application of the adjustments to FFS expenditures or to the capitation
rate.
The capitation payments MARx reflect the savings assumptions applied to the Healthy
Connections Prime and Medicare components of the rate (1 percent for February 1, 2015–
December 31, 2016), but do not reflect the quality withhold amounts (withhold of 1 percent in
the first demonstration period). The results shown here reflect quality withhold repayments for
the first demonstration period.

91
Table 19
Adjustments to Medicare expenditures variable
Data source
Adjustment
description
Reason for adjustment Adjustment detail
FFS
Indirect Medical
Education (IME)
MMP capitation rates do not
include IME.
Do not include IME amount from
FFS payments.
FFS
Disproportionate Share
Hospital (DSH)
Payments and
Uncompensated Care
Payments (UCP)
The capitation rates reflect DSH
and UCP adjustments.
Include DSH and UCP payments
in total FFS payment amounts.
FFS
Medicare Sequestration
Payment Reductions
Under sequestration Medicare
payments were reduced by 2%
starting April 1, 2013. Because the
predemonstration period includes
months prior to April 1, 2013 it is
necessary to apply the adjustment
to these months of data.
Reduced FFS claim payments
incurred before April 2013 by
2%.
Capitation rate
Medicare Sequestration
Payment Reductions
Under sequestration Medicare
payments were reduced by 2%
starting April 1, 2013.
Sequestration is not reflected in
the capitation rates.
Reduced capitation rate by 2%
Capitation rate Bad debt
The Medicare portion of the
capitation rate includes an upward
adjustment to account for bad debt.
Bad debt is included in the FFS
claim payments and therefore
needs to be removed from the
capitation rate for the savings
analysis. (Note, “bad debt” is
reflected in the hospital “pass
through” payment)
Reduced blended capitation rate
to account for bad debt load
(historical bad debt baseline
percentage). This is 0.87 for
CY13, 0.88 for CY14, 0.89 for
CY15, and 0.94 for CY16.
Reduced the FFS portion of the
capitation rate by an additional
1.71% for CY 2015 and by an
additional 1.84% for CY2016 to
account for the disproportional
share of bad debt attributable to
Medicare-Medicaid enrollees in
Medicare FFS.
(continued)

92
Table 19 (continued)
Adjustments to Medicare expenditures variable
Data source
Adjustment
description
Reason for adjustment Adjustment detail
FFS and
capitation rate
Average Geographic
Adjustments (AGA)
The Medicare portion of the
capitation rate reflects the most
current hospital wage index and
physician geographic practice cost
index by county. FFS claims also
reflect geographic payment
adjustments. In order to ensure that
change over time is not related to
differential change in geographic
payment adjustments, both the
FFS and the capitation rates were
“unadjusted” using the appropriate
county-specific AGA factor.
Medicare expenditures were
divided by the appropriate
county-specific AGA factor for
each year. Note that for 2013,
2015, and 2016, a single year-
specific AGA factor based on
claims paid in the year, rather
than the AGA factor used in
Medicare Advantage (based on 5
years of data and lagged 3 years)
was used to account for year-
specific policies. Note also that
the AGA factor applied to the
capitated rates for 2014 reflected
the 50/50 blend that was
applicable to the payment year.
Capitation rate Education user fee No adjustment needed.
Capitation rates in the MARx
database do not reflect the
education user fee adjustment
(this adjustment is applied at the
contract level). Note, education
user fees are not applicable in the
FFS context and do not cover
specific Part A and Part B
services. While they result in a
small reduction to the capitation
payment received by MMPs, we
did not account for this reduction
in the capitated rate.
Capitation rate Quality withhold
A 1% quality withhold was
applied in the first demonstration
year but was not reflected in the
capitation rate used in the analysis.
Final quality withhold
repayments for 2015 and 2016
were incorporated into the
dependent variable construction.
CY = calendar year; FFS = fee for service; MMP = Medicare-Medicaid Plan.

93
10.3 Results
The first step in the analysis was to plot the unweighted mean monthly Medicare
expenditures for both the demonstration group and the comparison group. Figure 9 indicates that
the demonstration group and the comparison group had parallel trends in mean monthly
expenditures during the 24-month predemonstration period, which is an important assumption to
the DinD analysis.
Figure 9
Mean monthly Medicare expenditures, predemonstration and demonstration period,
Healthy Connections Prime eligible and comparison group,
February 2013–December 2016
NOTE: Vertical line at month 24 denotes the last month prior the start of the demonstration.
SOURCE: RTI Analysis of South Carolina demonstration eligible and comparison group Medicare data (program:
South Carolina\SC AR1 output\Figure 1&2 OCT18_2018).
Figure 10 demonstrates the same plot of mean monthly Medicare expenditures for both
the demonstration group and the comparison group, after applying the propensity weights and
establishes the parallel trends for both groups.

94
Figure 10
Mean monthly Medicare expenditures (weighted), predemonstration and demonstration
period, Healthy Connections Prime eligibles and comparison group,
February 2013–December 2016
NOTE: Vertical line at month 24 denotes the last month prior the start of the demonstration.
SOURCE: RTI Analysis of South Carolina demonstration eligible and comparison group Medicare data (program:
South Carolina\SC AR1 output\Figure 1&2 OCT18_2018).
Table 20 shows the mean monthly Medicare expenditures for the demonstration group
and comparison group in the predemonstration and each demonstration period, unweighted. The
unweighted tables show an increase in mean monthly Medicare expenditures during
demonstration period 1 for both the demonstration group and the comparison group. The
unweighted mean increase in demonstration period 1 was $116.25 for demonstration eligible
beneficiaries and $51.10 for the comparison group. Increases were also shown for demonstration
period 1 for both the demonstration group and the comparison group in the weighted tables,
though the increase in the demonstration group ($116.25) was smaller than the increase in the
comparison group ($186.22) (see Table 21).
The DinD values in each table represent the overall impact on savings using descriptive
statistics. These effects are descriptive in that they are arithmetic combinations of simple means,
without controlling for covariates. The change in the demonstration group minus the change in
the comparison group is the DinD value. This value would be equal to zero if the differences
between predemonstration and the demonstration period were the same for both the
demonstration group and the comparison group. A negative value would indicate savings for the
demonstration group, and a positive value would indicate losses for the demonstration group.
The DinD value in demonstration period 1 is positive in the unweighted table ($65.15) and

95
negative in the weighted table (−$69.98). Both values are statistically significant (illustrated by
the 95 percent confidence intervals that do not include 0).
Table 20
Mean monthly Medicare expenditures for Healthy Connections Prime eligibles and
comparison group, predemonstration period and demonstration period 1, unweighted
Group
Predemonstration period,
Feb 2013–Jan 2015
(95% confidence intervals)
Demonstration period 1,
Feb 2015–Dec 2016
(95% confidence intervals)
Difference
(95% confidence intervals)
Demonstration group $1,036.67
($1,012.55, $1,060.78)
$1,152.91
($1,120.64, $1,185.19)
$116.25
($90.84, $141.66)
Comparison group $1,169.16
($1,085.90, $1,252.42)
$1,220.26
($1,135.77, $1,304.75)
$51.10
($30.49, $71.71)
Difference-in-difference — — $65.15
($32.52, $97.79)
— = data not available.
SOURCE: RTI Analysis of South Carolina demonstration eligible and comparison group Medicare data (program:
lgs_sccs500_log).
Table 21
Mean monthly Medicare expenditures for Healthy Connections Prime eligibles and
comparison group, predemonstration period and demonstration period 1, weighted
Group
Predemonstration period,
Feb 2013–Jan 2015
(95% confidence intervals)
Demonstration period 1,
Feb 2015–Dec 2016
(95% confidence intervals)
Difference
(95% confidence intervals)
Demonstration group $1,036.67
($1,012.55, $1,060.78)
$1,152.91
($1,120.64, $1,185.19)
$116.25
($90.84, $141.66)
Comparison group $1,112.65
($1,051.54, $1,173.77)
$1,298.88
($1,233.45, $1,364.31)
$186.22
($152.50, $219.95)
Difference-in-difference — — −$69.98
(−$112.33, −$27.62)
— = data not available.
SOURCE: RTI Analysis of South Carolina demonstration eligible and comparison group Medicare data (program:
lgs_sccs500_log).
10.3.1
Regression Analysis
While the descriptive statistics are informative, to get a more accurate estimate of
savings, RTI conducted a multivariate regression analysis to estimate savings controlling for
beneficiary and area-level characteristics. Given the structure of the data, RTI used the GLM
procedure in Stata with a gamma distribution and a log link, and adjusted for clustering at the
county level.

96
In addition to controlling for beneficiary and market area characteristics, the model
included a time trend variable (coded as months 1–47), a dichotomous variable for whether the
observation was from the predemonstration or demonstration period (“Post”), a variable to
indicate whether the observation was from a beneficiary in the comparison group or the
demonstration group (“Intervention”), and an interaction term (“Intervention*Post”) which is the
difference-in-differences estimate in the multivariate model for the net effect of demonstration
eligibility.
Table 22 shows the main results from the DinD analysis for demonstration year 1, the
entire demonstration period, controlling for beneficiary demographics and market characteristics.
To obtain the effect of the demonstration from the non-linear model we calculated the marginal
effect of coefficient of the interaction term. The marginal effect of the demonstration for the
intervention group over the demonstration period was negative (−32.88) but savings were small
and not statistically significant, indicating that there were no savings to Medicare as a result of
the demonstration using the ITT analysis framework.
Table 22
Demonstration effects on Medicare savings for eligible beneficiaries—Difference-in-
difference regression results, Healthy Connections Prime eligibles and comparison group
Covariate
Adjusted
coefficient DinD p-value
95% confidence
interval
90% confidence
interval
Intervention*DemoYear1
(February 2015–December 2016)
−32.88 0.1073 (−72.90, 7.14) (−66.47, 0.71)
SOURCE: RTI Analysis of South Carolina demonstration eligible and comparison group Medicare data (program:
lgs_sccs480).
Table 23 shows the magnitude of the DinD estimate relative to the adjusted mean
outcome value in the predemonstration and demonstration periods. The second and third
columns represent the post-regression, mean predicted savings or loss for each group and period,
based on the composition of a reference population (the comparison group in the demonstration
period). These values show how different the two groups were in each period, and the relative
direction of any potential effect in each group over time. The remaining columns show the DinD
estimate (the coefficient on Intervention*DemoYear1), the p-value demonstrating significance,
and the relative percent change of the DinD estimate compared to the mean monthly Medicare
expenditures for the comparison group in the entire demonstration period.
The adjusted mean for monthly expenditures increased between the predemonstration and
demonstration period for the comparison group and decreased between the predemonstration and
demonstration period for the demonstration group. The DinD estimate of −32.88 (the coefficient
on Intervention*DemoYear1) is negative, but the savings are not statistically significant (p <
0.1073), indicating that there were no statistically significant savings in Medicare Parts A and B
from the demonstration, using the ITT analysis framework. The DinD estimate for demonstration
year 1 reflected an annual relative cost decrease of −2.55 percent, but this was not statistically
significant.

97
Table 23
Adjusted means and overall impact estimate for eligible beneficiaries in the demonstration
and comparison groups, Healthy Connections Prime eligibles and comparison group
Group
Adjusted mean for
demonstration
period
Relative
difference
(%)
Adjusted
coefficient
DinD p-value
Demonstration group $1,133.81 $1,131.89
−2.55 −32.88* <0.1073
Comparison group $1,258.04 $1,291.61
Adjusted mean for
predemonstration
period
CI = confidence interval; DinD = difference-in-differences
NOTES: * 95 percent CI: (−72.90, 7.14); and 90 percent CI: (−66.47, 0.71). Even though the comparison group was
carefully developed to have similar characteristics to the demonstration group, there are always slight differences in
demographic, health, and area characteristics between the demonstration and comparison groups. The two types of
results reported in this table take these differences into account, but use different statistical methods to do so. Before
calculating the mean values reported in the second and third columns in this table, RTI adjusted the composition of
the demonstration’s baseline and demonstration period groups and the comparison baseline period group to match
the characteristics of the comparison group in the demonstration period so that the means do not reflect any
differences in the groups’ characteristics. The regression DinD approach, results reported in the fifth column of this
table, controls for these differences automatically, without changing the underlying characteristics of the
demonstration and comparison groups. Because of these differing methods, the difference-in-differences results
obtained from the regression may differ slightly from a similar calculation using the results in the adjusted mean
columns. The relative percentage difference in the fourth column is calculated by dividing the DinD value in column
5 by the value for the comparison group in the demonstration period in column 3.
SOURCE: RTI Analysis of South Carolina demonstration eligible and comparison group Medicare data (program:
lgs_sccs490).
In addition to the ITT approach to cost savings analysis on all eligible beneficiaries, RTI
conducted several sensitivity analyses to provide additional information on potential savings or
losses associated with the demonstration overall and for the subset of beneficiaries enrolled in
the demonstration. These sensitivity analyses included (1) simulating capitated rates for eligible
enrollees not enrolled in the demonstration and comparing these rates to actual FFS
expenditures; (2) predicting FFS expenditures for beneficiaries enrolled in the demonstration and
comparing to the actual capitated rates; and (3) calculating a DinD estimate based on a subgroup
of beneficiaries enrolled in the demonstration with at least 3 months of eligibility in the baseline
period. The results of these analyses are presented in Appendix D.
The findings of the sensitivity analyses indicate that the predicted capitated rates are
statistically significantly higher than actual FFS expenditures for non-enrollees and that
predicted FFS expenditures are higher than actual capitated rates for enrollees. In contrast, the
enrollee subgroup DinD analysis indicates additional capitated costs compared to a comparison
group in FFS, and this finding is statistically significant. These analyses are focused on enrollees
only and do not control for unobservable characteristics that may be related to the decision to
enroll in the demonstration. The enrollee subgroup DinD analysis was conducted to learn more
about the potential impact of the demonstration on the subset of beneficiaries touched by the
demonstration for at least 3 months. Note that similar 3-month eligibility criteria were applied to
the comparison group for the baseline and demonstration periods for this analysis and weights
were recalculated. The enrollee subgroup analysis is limited by the absence of person-level data

98
on characteristics that potentially would lead an individual in a comparison area to enroll in a
similar demonstration, and thus the results should be considered in the context of this limitation.
10.4 Discussion
The results of the preliminary multivariate analyses presented here do not indicate
statistically significant savings or losses during the first 23 months of the South Carolina
demonstration. The savings calculated here are based on capitation rates paid for enrollees and
the FFS expenditures for eligible beneficiaries that did not enroll in the demonstration. The
estimates do not take into account actual payments for services incurred by enrollees and paid by
the Healthy Connections Prime plans.
One potential reason that savings were not identified in these analyses is that that there
was not sufficient time for the program to demonstrate impact. It is also important to note that
given the ITT framework used to calculate savings, all eligible beneficiaries, regardless of their
enrollment status were included in the calculation. The ITT approach diminishes the potential for
selection bias and highlights the effect of the demonstration on all beneficiaries in the
demonstration eligible population, though it may be more difficult to understand the effect of the
intervention on enrollees when a large proportion of eligible beneficiaries are not enrolled.
RTI will continue to examine these results and once Medicaid data become available to
the evaluation team and a similar calculation can be conducted on the Medicaid costs, it will be
possible to have a more complete understanding of potential savings from the first year of the
Healthy Connections Prime demonstration. Preliminary estimates provided by the State of South
Carolina indicate Medicaid savings as a result of the demonstration. The State of South Carolina
projects savings from the first demonstration period that align with contractual savings
percentages (e.g., 1% during the first demonstration period).
9
Additional Medicare and Medicaid savings calculations will be conducted by the
evaluation contractor for each year of the demonstration as data are available and future reports
will show updated results for the first year of the demonstration based on data reflecting
additional claims run-out, risk score reconciliation, and any retroactive adjustments.
9
This estimate was assessed and provided by the State of South Carolina and is independent from the analyses
presented in this evaluation report. CMS has not validated this estimate.
99
11. Conclusions
11.1 Implementation-related Successes, Challenges, and Lessons Learned
The State of South Carolina, with CMS, has established an effective partnership with
three health plans, providers, and stakeholders under the Financial Alignment Initiative with the
aim of delivering and coordinating all medical, behavioral health, and LTSS for Medicare-
Medicaid beneficiaries age 65 and older. As of December 2017, more than one-half of the State’s
20,726 eligible Medicare-Medicaid beneficiaries were enrolled in Healthy Connections Prime
across 39 of the 46 counties in South Carolina.
Healthy Connections Prime enrollees responded with positive feedback in surveys and
focus groups, with many attributing improvements in access to care and quality of life to their
participation in the demonstration. Most focus group participants knew their care manager by
name, described their reliance on their services, and expressed appreciation for their care
manager’s active involvement in their care. Many participants in this very rural State noted the
importance of their care manager’s home visits during which assessments were completed. Care
managers assess enrollees on a number of domains (including social determinants of health) and
connect enrollees to community-based services, enabling enrollees to live safely in their homes.
The low volume of complaints and appeals throughout the demonstration also point to enrollees’
overall satisfaction with services and care received.
The Healthy Connections Prime demonstration faced a number of significant challenges.
Most notable among these was the abrupt 14-month delay in passive enrollment at the start, as a
result of legislative action, and the 7-month passive enrollment hiatus in 2017 while State
leadership considered conversion to an MLTSS model. The MMPs reported difficulty attracting
a wide provider network, due in part to providers’ distrust of managed care, provider and
Medicare Advantage plan influence, and questions about the future of the demonstration.
According to results from disenrollment surveys and member exit interviews, the top reason for
disenrollment from Healthy Connections Prime was beneficiary preference to retain their current
providers who were not in the MMPs’ networks.
MMPs’ financial challenges first began after ramping up for an incorrectly estimated
population of more than 50,000 enrollees. The passive enrollment delay resulted in the opt-in
enrollment of only 1,800 beneficiaries during the demonstration’s first year. Subsequently, the
aforementioned 2017 passive enrollment hiatus exacerbated the MMPs’ financial outlook and
provider and stakeholder perceptions of the demonstration’s viability. Struggles with the State’s
eligibility tracking system, concerns over appropriate enrollee rate cell assignment, and the 2017
community cell rate reduction all compounded MMP concerns.
Despite these significant challenges, in spring 2018, the State Healthy Connections Prime
team, working closely with the three MMPs, developed a comprehensive list of
recommendations to improve Healthy Connections Prime and reduce the MMPs’ financial
burden. To stabilize savings rates and increase enrollment, recommendations included
maintenance of the shared savings and the quality withhold rates at three percent each, and the
expansion of passive enrollment to include Medicare Advantage members. Streamlining the
100
assessment processes and reducing administrative reporting requirements, without limiting
beneficiary services, were also recommended and approved by CMS effective July 2018. The
agreement paved the way for the extension of the South Carolina demonstration, with all three
plans, through December 2020. The effects of these recommendations, and the extent to which
they have been successfully implemented, will undoubtedly be of interest to providers,
stakeholders, and others. RTI will monitor the implementation of these changes; results will be
provided in future reports.
11.2 Demonstration Impact on Service Utilization and Costs
Impact analyses from the first demonstration year of the South Carolina demonstration
reveal changes in service utilization patterns. Although these changes appear somewhat large in
percentage terms in comparison to the comparison group, they are actually quite small in
absolute terms, reflecting usually less than a one percentage point change in the probability of
use. For example, the 19 percent reduction in inpatient admissions, which is compared to an
average mean use rate for the comparison group in the entire demonstration period, is calculated
from only a 0.77 absolute percentage point difference in the change in the probability between
the two groups. So big percentage changes in use are relatively small in absolute terms for all of
the service utilization measures reported.
Still, these changes may be attributable to the demonstration, as they are mostly
consistent with overall improvements in beneficiaries’ reported experience, for example, with
positive care manager relationships and the elimination of copays. In particular, results show
decreases in inpatient admissions, skilled nursing facility admissions, emergency room (ER)
visits, preventable ER visits, ambulatory care sensitive condition admissions (both overall and
those specific to chronic care), and evaluation and management visits. There was no change in
the 30-day all-cause readmission rate. One measure—the rate of long-stay nursing facility
admissions—increased.
However, these results may not wholly be a result of demonstration implementation and
should therefore be interpreted with caution. The number of enrollees in the demonstration was
no greater than 1,800 beneficiaries for the first 14 of the 23 months of the demonstration period.
Moreover, these enrollees had all opted into the demonstration and were reported by MMPs and
the State to be relatively healthier than non-enrollees and, therefore, compared to non-enrollees,
likely not high utilizers of services. Indeed, enrollees had an HCC score of 1.26 while non-
enrollees had a HCC score of 1.45 (see Appendix B, Table B-1), meaning enrollee projected
health care expenditures were anticipated to be lower than non-enrollee projected expenditures.
It was only in the last 5 months of the demonstration period, after the initial passive enrollment
process concluded, that enrollment grew and stabilized at approximately 9,000, roughly
40 percent of all demonstration eligibles by the end of 2016.
It is not surprising the demonstration was associated with an increase in the probability of
long-stay nursing facility stays, relative to the comparison group. State-level eligibility
determination delays for long-stay nursing facility approval could have contributed to this
finding. During the period covered by this report, long-stay nursing facility residents were
excluded from being eligible to enroll into the demonstration. However, due to delays in
determining nursing facility eligibility, individuals newly requiring long-stay nursing facility

101
services were enrolled in the demonstration, thus raising the probability of a long-stay nursing
facility stay in the demonstration group. Potentially, if beneficiaries with those long-stay nursing
facility stays had been more quickly identified, they would have been ineligible for
demonstration enrollment.
For the population with a serious and persistent mental illness (SPMI), fewer measures
were found to be statistically significant when compared to those for the overall demonstration
eligible population, but when so, were in the same direction (lower) and to a similar degree.
Findings on the SPMI utilization and quality of care results should also be interpreted
with caution. State officials reported that in 2016, the Department of Mental Health lacked
adequate capacity to serve the behavioral health needs of enrollees with SPMI who were age 65
or over and that these enrollees were usually treated by primary care providers. The RTI
evaluation team heard directly from enrollee focus group participants, the State and stakeholders
of the paucity of behavioral health services for this population. Although the integration of
behavioral health with primary care is a goal of the demonstration, during the first demonstration
year, there was little progress in this area.
The results of the preliminary multivariate cost savings analyses presented here do not
indicate statistically significant Medicare savings or losses during the first 23 months of the
South Carolina demonstration. The savings calculated here are based on capitation rates paid by
CMS to Healthy Connections Prime plans for enrollees, and the Medicare FFS expenditures and
Medicare Advantage capitation rates for eligible beneficiaries that did not enroll in the
demonstration. The estimates do not take into account actual payments for services incurred by
enrollees and paid by the Healthy Connections Prime plans. RTI will continue to examine these
results and will rerun the analyses when more data become available. Once Medicaid data
become available to the evaluation team and a similar calculation can be conducted on the
Medicaid costs, it will be possible to have a more complete understanding of potential savings
from the Healthy Connections Prime demonstration. Preliminary estimates provided by the State
of South Carolina indicate Medicaid savings as a result of the demonstration. The State of South
Carolina projects savings from the first demonstration period that align with contractual savings
percentages (e.g., 1 percent during the first demonstration period).
10
Additional Medicare and
Medicaid savings calculations will be conducted by the evaluation contractor for each year of the
demonstration as data are available.
11.3 Next Steps
The RTI evaluation team will continue to collect information on a quarterly basis from
South Carolina officials through the online State Data Reporting System, covering enrollment
statistics and updates on key aspects of implementation. The RTI evaluation team will continue
conducting quarterly calls with the Healthy Connections Prime State and CMS staff, and will
request the results of any evaluation activities conducted by the State or other entities, such as
results from the CAHPS and State-specific demonstration measures the plans are required to
10
This estimate was assessed and provided by the State of South Carolina and is independent from the analyses
presented in this evaluation report. CMS has not validated this estimate.
102
report to CMS. RTI will conduct additional site visits and focus groups over the course of the
demonstration.
As noted previously, the South Carolina demonstration has been extended for 2 years,
until December 2020, which will provide further opportunities to evaluate the demonstration’s
performance. The next report will include a qualitative update on demonstration implementation
and impact analyses of quality and utilization measures for those eligible for the demonstration
and for an out-of-State comparison group.

R-1
References
Centers for Medicare and Medicaid Services (CMS): Medicare-Medicaid Coordination Office.
Financial Alignment Initiative (FAI). https://www.cms.gov/Medicare-Medicaid-
Coordination/Medicare-and-Medicaid-Coordination/Medicare-Medicaid-Coordination-
Office/FinancialAlignmentInitiative/FinancialModelstoSupportStatesEffortsinCareCoordination.
html. N.d. As obtained on October 5, 2018.
Centers for Medicare & Medicaid Services (CMS) and the State of South Carolina:
Memorandum of Understanding (MOU) Regarding a Federal-State Partnership to Test a
Capitated Financial Alignment Model for Medicare-Medicaid Enrollees. South Carolina Healthy
Connections Prime. https://www.cms.gov/Medicare-Medicaid-Coordination/Medicare-and-
Medicaid-Coordination/Medicare-Medicaid-Coordination-
Office/FinancialAlignmentInitiative/Downloads/SCMOU.pdf. October 25, 2013. As obtained on
October 5, 2018
Centers for Medicare & Medicaid Services (CMS) and the State of South Carolina: Contract
Between United States Department of Health and Human Services Centers for Medicare and
Medicaid Services in Partnership with State of South Carolina Department of Health and Human
Services. https://www.cms.gov/Medicare-Medicaid-Coordination/Medicare-and-Medicaid-
Coordination/Medicare-Medicaid-Coordination-
Office/FinancialAlignmentInitiative/Downloads/SouthCarolinaContract.pdf. September 5, 2014.
As obtained on October 5, 2018.
Centers for Medicare & Medicaid Services (CMS): South Carolina Healthy Connections Prime
Demonstration. https://www.cms.gov/Medicare-Medicaid-Coordination/Medicare-and-
Medicaid-Coordination/Medicare-Medicaid-Coordination-
Office/FinancialAlignmentInitiative/Downloads/SCContractSummaryChanges11012017.pdf.
November 1, 2017. 2017a. As obtained on October 5, 2018.
Centers for Medicare & Medicaid Services (CMS): Medicare-Medicaid Capitated Financial
Alignment Model Reporting Requirements. https://www.cms.gov/Medicare-Medicaid-
Coordination/Medicare-and-Medicaid-Coordination/Medicare-Medicaid-Coordination-
Office/FinancialAlignmentInitiative/Downloads/CoreReportingRequirements_CY2018_1025201
7.pdf. October 25, 2017. 2017b. As obtained on October 5, 2018.
Centers for Medicare & Medicaid Services (CMS): Contract Amendment between CMS and
SCDHHS. https://www.cms.gov/Medicare-Medicaid-Coordination/Medicare-and-Medicaid-
Coordination/Medicare-Medicaid-Coordination-
Office/FinancialAlignmentInitiative/Downloads/SCContractAmendment_07012018.pdf.
February 28, 2018. 2018a. As obtained on October 5, 2018.
Centers for Medicare & Medicaid Services (CMS): Integrated Care Resource Center: Program of
All Inclusive Care for the Elderly (PACE) Total Enrollment by State and by Organization.
https://www.integratedcareresourcecenter.com/sites/default/files/PACE_Enroll_by_State_Nove
mber_2018.pdf . November 2018. 2018b. As obtained on June 11, 2019.

R-2
Centers for Medicare and Medicaid Services (CMS): Medicare-Medicaid Capitated Financial
Alignment Model Reporting Requirements: South Carolina-Specific Reporting Requirements.
https://www.cms.gov/Medicare-Medicaid-Coordination/Medicare-and-Medicaid-
Coordination/Medicare-Medicaid-Coordination-
Office/FinancialAlignmentInitiative/MMPInformationandGuidance/Downloads/SCReportingRe
quirements02282018.pdf. February 28, 2018. 2018c. As obtained October 5, 2018.
Centers for Medicare & Medicaid Services (CMS): Medicare-Medicaid Capitated Financial
Alignment Model Quality Withhold Technical Notes (DY 2 through 5).
https://www.cms.gov/Medicare-Medicaid-Coordination/Medicare-and-Medicaid-
Coordination/Medicare-Medicaid-Coordination-
Office/FinancialAlignmentInitiative/MMPInformationandGuidance/Downloads/QualityWithhold
GuidanceDY2-503142018.pdf. 2018d. As obtained on October 5, 2018.
Charlson, M.: Charlson Comorbidity Index.
https://www.rtog.org/LinkClick.aspx?fileticket=8o6FpyC8s9w%3D&tabid=290.N.d . As
obtained on October 5, 2018.
Curtis, T.: The South Carolina Healthy Connections Prime Experience: Caregivers & Person-
Centered Program Design.
https://msp.scdhhs.gov/SCDue2/sites/default/files/Healthy%20Connections%20Prime%20-
%20Reforming%20States%20Group%20(Final).pdf. Presentation given at South Carolina
Department of Health and Human Services Reforming States Group Pre-Conference,
Philadelphia, PA. November 15, 2017. As obtained October 5, 2018.
Kaiser Family Foundation: Medicare Advantage 2017 Spotlight: Enrollment Market Update.
https://www.kff.org/report-section/medicare-advantage-2017-spotlight-enrollment-market-
update-appendices/ . 2017. As obtained October 5, 2018.
Palmer, J. D., Howard, M. T., & Laudenschlager, C. L.: Healthy Connections Prime Calendar
Year 2017 Amendment – DRAFT Medicaid Rate Component. Milliman Client Report. Prepared
for: South Carolina Department of Health & Human Services.
https://www.scdhhs.gov/internet/pdf/b5xvi1vwl1acrTIAtVZ2Igg106gkMA5n.pdf. 2018. As
obtained June 10, 2019.
RTI International: State Data Reporting System (SDRS): 2017-2018.
South Carolina, Department of Health and Human Services (SCDHHS): Healthy Connections
Prime Program Data. Enrollment and County Participation. https://msp.scdhhs.gov/SCDue2/site-
page/program-data. N.d. As obtained October 5, 2018.
South Carolina, Department of Health and Human Services (SCDHHS): Healthy Connections
Prime FAQs for Nursing Facilities.
https://msp.scdhhs.gov/SCDue2/sites/default/files/NF%20FAQ%204-6-
18%20%28Final%29.pdf. Last updated April 2018. As obtained October 5, 2018.

R-3
South Carolina, Department of Health and Human Services (SCDHHS): New Guidance for
Waiver Case Managers from Healthy Connections Prime.
https://msp.scdhhs.gov/SCDue2/sites/default/files/Healthy%20Connections%20Prime%20Guida
nce%20for%20Waiver%20CMs%20 (June%2027%202017).pdf. Last updated June 27, 2017. As
obtained October 5, 2018.
South Carolina, Department of Health and Human Services (SCDHHS): Plans Receive Dementia
Dialogues Training. Courses Open to the Public. https://msp.scdhhs.gov/SCDue2/press-
release/plans-receive-dementia-dialogues-training-courses-open-public. N.d. As obtained
October 5, 2018.
South Carolina, Department of Health and Human Services (SCDHHS): Healthy Connections
Prime: Provider Toolkit. https://msp.scdhhs.gov/SCDue2/site-page/provider-toolkit. N.d. As
obtained October 5, 2018.
South Carolina Department of Mental Health. (2017): South Carolina Observes Telehealth
Awareness Week. https://scdmh.net/2017/10/16/news-releasesouth-carolina-observes-telehealth-
awareness-week/ . 2017. As obtained October 5, 2018.
South Carolina, Department of Health and Human Services (SCDHHS): Healthy Connections
Prime: Monthly Enrollment Dashboards.
https://msp.scdhhs.gov/SCDue2/sites/default/files/2017%20Healthy%20Connections%20Prime
%20Enrollment%20Monthly%20Dashboards.pdf. 2017. As obtained October 5, 2018.
South Carolina, Department of Health and Human Services (SCDHHS): Nursing Facility
Provider Memo: Medicaid Long-Term Care Stay Claims Processing. Retrieved October 5, 2018,
from
https://msp.scdhhs.gov/SCDue2/sites/default/files/Healthy%20Connections%20Prime%20Memo
%20to%20Providers_Nursing%20Facility%20Claims_Final.pdf. 2018. As obtained October 5,
2018.
South Carolina Department of Health & Human Services (SCDHHS): Healthy Connections
Prime: Continuity of Care Provider Toolkit.
https://msp.scdhhs.gov/SCDue2/sites/default/files/Continuity%20of%20Care%20-
%20Provider%20Toolkit.pdf. 2018. As obtained October 5, 2018.
South Carolina Department of Health & Human Services (SCDHHS): Healthy Connections
Monthly Enrollment Dashboards, 2017, January–December.
https://msp.scdhhs.gov/SCDue2/sites/default/files/2017%20Healthy%20Connections%20Prime
%20Enrollment%20Monthly%20Dashboards.pdf. 2018. As obtained October 5, 2018.
South Carolina Lieutenant Governor’s Office on Aging: Prime Advocate Training Manual 2015.
Columbia, SC. 2015.
South Carolina Senate: Journal of the Senate of the State of South Carolina No. 67; Regular
Session beginning January 13, 2014. https://www.scstatehouse.gov/sess121_2015-
2016/sj15/20150506.pdf. May 6, 2015. As obtained on October 5, 2018.

R-4
Walsh, E. G., Greene, A., Anderson, W., et al.: Measurement, Monitoring, and Evaluation of
State Demonstrations to Integrate Care for Dual Eligible Individuals: Aggregate Evaluation Plan.
Waltham, MA, RTI International. https://www.cms.gov/Medicare-Medicaid-
Coordination/Medicare-and-Medicaid-Coordination/Medicare-Medicaid-Coordination-
Office/FinancialAlignmentInitiative/Downloads/EvalPlanFullReport.pdf. December 16, 2013.
As obtained on October 5, 2018.
A-1
Appendix A:
Comparison Group Methodology for South Carolina
Demonstration Year 1
CMS contracted with RTI International to monitor the implementation of demonstrations
under the Financial Alignment Initiative (FAI) and to evaluate their impact on beneficiary
experience, quality, utilization, and cost. This appendix presents the comparison group selection
and assessment results for the FAI demonstration in the State of South Carolina. The appendix
focuses primarily on all beneficiaries eligible for the demonstration, with a brief discussion of
demonstration enrollees.
This appendix lists the geographic comparison areas for South Carolina, provides
propensity model estimates, and shows the similarities between the comparison and
demonstration groups in terms of their propensity score distributions. Separate analyses were
conducted for three time periods for the South Carolina demonstration: baseline year 1
(February 1, 2013–January 31, 2014), baseline year 2 (February 1, 2014–January 31, 2015), and
demonstration year 1 (23 months from February 1, 2015–December 31, 2016). Analyses were
conducted for each period because eligible beneficiaries are identified separately for each time
period.
The South Carolina demonstration was restricted to dual eligible beneficiaries over the
age of 65. We included beneficiaries who had been attributed to another Federal Medicare shared
savings initiative. Attribution to other savings initiatives was ascertained using the beneficiary-
level version of the CMS’ Master Data Management (MDM) file. Beneficiaries in the
demonstration group during the demonstration period were identified from quarterly finder files
of participants in South Carolina’s Healthy Connections Prime program. Beneficiaries qualified
for the demonstration group if they participated for at least one month during the demonstration
period. During the two baseline years, all beneficiaries meeting the age restriction and
Metropolitan statistical area (MSA) residency requirements were selected for the demonstration
and comparison groups. Beneficiaries were omitted from further analyses if they had missing
geographic data; passed away before the beginning of the analysis period; had zero months of
eligibility as a dual eligible; lived in both a demonstration area and a comparison area during the
analysis period; or missing Hierarchical Condition Code (HCC) risk scores during a year.
Comparison Areas
Our guidelines for creating comparison groups are that (1) comparisons should include at
least three States (so that outcomes are not unduly influenced by a single State), and (2) that no
comparison State should contribute more than 50 percent of the total number of comparison
beneficiaries. In South Carolina, these guidelines proved to be a challenge because most of the
best matching areas were from North Carolina. Using our conventional method of prioritizing
areas by their distance scores (a statistical measure of the similarity between two areas) would
have produced a comparison group in which 83 percent of the beneficiaries were from North
Carolina. To mitigate this issue, we limited our selection methodology to the 14 MSAs with the
lowest distance scores, selecting all 9 MSAs from other States and the 5 best North Carolina

A-2
MSA matches. This reduced the proportion of North Carolina beneficiaries to less than 57
percent of the comparison group total.
The South Carolina demonstration area consists of 21 counties that are part of 10 MSAs
(Greenville-Anderson-Mauldin; Columbia; Hilton Head Island-Bluffton-Beaufort; Augusta-
Richmond; Spartanburg; Charleston-North Charleston; Sumter; Charlotte-Concord-Gastonia;
Myrtle Beach-Conway-North Myrtle Beach; and Florence) and 20 non-metropolitan counties in
South Carolina. The comparison area is comprised of 41 counties in 14 MSAs from 5 States,
including 19 non-metropolitan counties in Virginia. The pool of States was limited to those with
timely submission of Medicaid data to CMS. All comparison MSAs are listed in Table A-1.
Table A-1
Comparison areas in five comparison States
North Carolina MSAs
Fayetteville
Myrtle Beach-Conway-North
Myrtle Beach
Wilmington
Jacksonville
Charlotte-Concord-Gastonia
Arkansas MSAs
Texarkana
Hot Springs
Fort Smith
Virginia MSAs
Kingsport-Bristol-Bristol
Rest-of-State
Georgia MSAs
Savannah
Macon
Augusta-Richmond
Mississippi MSA
Gulfport-Biloxi-Pascagoula
Table A-2 below shows the distribution of beneficiaries by comparison State in the first
baseline year. Comparison areas within the State of North Carolina contributed the largest share
of comparison beneficiaries. State shares were very similar in baseline year 2 and demonstration
year 1. The total number of comparison beneficiaries was comparatively stable throughout the
three time periods (36,477 in baseline year 1, 35,619 in baseline year 2, and 40,613 in
demonstration year 1).
Table A-2
Distribution of comparison group beneficiaries for the South Carolina demonstration, first
baseline year, by comparison State
Comparison State Percent of comparison beneficiaries
North Carolina
56.75
Virginia
21.75
Georgia
9.53
Arkansas
6.45
Mississippi
5.50
Total percent
100.00
Total beneficiaries
36,477
A-3
Propensity Score Estimates
RTI’s methodology uses propensity scores to examine initial differences between the
demonstration and comparison groups and then to weight the data to improve the match between
them. The comparability of the two groups is examined with respect to both individual
beneficiary characteristics as well as the overall distributions of propensity scores. This section
describes the results of the model that generates propensity scores and future sections show how
weighting eliminates initial differences between the groups.
A propensity score (PS) is the predicted probability that a beneficiary is a member of the
demonstration group conditional on a set of observed variables. Our propensity score models
include a combination of beneficiary-level and region-level characteristics measured at the ZIP
code (ZIP Code Tabulation Area) level. Region-level covariates were drawn from a factor
analysis of ZIP-based variables for the population aged 65 years or older. These covariates
capture features of the age, employment, marital, and family status of households in each region.
Measures of the distance to hospitals and nursing homes were also included. The Technical
Appendix provides a detailed description of these characteristics and how the propensity scores
were calculated.
The logistic regression coefficients, standard errors, and z-values for the covariates
included in the propensity model for South Carolina are shown in Table A-3. These coefficients
and the underlying data are used to generate propensity scores for each beneficiary. In general,
individual covariates had similar effects in each period. The coefficients for several variables
reflected some important differences between the demonstration and comparison groups. The
magnitude of these differences may also be seen in the unweighted standardized differences in
Tables A-4 to A-6. Relative to the comparison group, demonstration participants were more
likely to live in areas with higher concentrations of elderly people, less likely to live in MSAs,
and to live farther from the nearest hospital or nursing home.

A-4
Table A-3
Logistic regression estimates for South Carolina propensity score models
Characteristic
Baseline year 1
Baseline year 2 Demonstration year 1
Coef. Std. err. z-score Coef. Std. err. z-score Coef. Std. err. z-score
Age (years) −0.005 0.001 −4.18 −0.004 0.001 −3.79 0.002 0.001 2.11
Died during year (0/1) −0.136 0.041 −3.36 −0.261 0.042 −6.23 −0.119 0.056 −2.13
Female (0/1) 0.179 0.021 8.57
0.209 0.021 9.95 0.234 0.019 12.00
Black (0/1) 0.361 0.019 19.34
0.363 0.019 19.06 0.409 0.018 22.84
Disability as original reason for entitlement (0/1) 0.082 0.028 2.97
0.036 0.030 1.21 0.009 0.027 0.34
ESRD (0/1) 0.050 0.178 0.28
0.084 0.291 0.29 0.586 0.122 4.80
Prop. mos. eligible during year −0.108 0.032 −3.39
−0.113 0.033 −3.39 −0.731 0.026 −28.20
HCC risk score −0.060 0.009 −6.70
−0.059 0.009 −6.37 −0.040 0.008 −5.01
Other MDM (0/1) −0.947 0.029 −33.09
−0.294 0.023 −12.85 −0.361 0.021 −16.96
MSA (0/1) −0.168 0.024 −7.00
−0.131 0.025 −5.35 −0.065 0.023 −2.83
% of pop. living in married household −0.028 0.001 −35.44
−0.029 0.001 −36.52 −0.029 0.001 −37.36
% of households w/ member >= 60 yrs. 0.044 0.001 32.15
0.048 0.001 34.35 0.045 0.001 33.65
% of elderly with college education 0.034 0.001 34.59
0.037 0.001 36.46 0.033 0.001 34.94
% of elderly with self-care limitation 0.017 0.002 11.04
0.014 0.002 8.51 0.009 0.002 5.46
% of households w/ member < 18 yrs. 0.011 0.002 7.15
0.021 0.002 13.21 0.020 0.002 12.87
% of elderly unemployed 0.011 0.001 11.82
0.007 0.001 7.19 0.002 0.001 1.90
Distance to nearest hospital (mi.) −0.014 0.002 −7.20
−0.018 0.002 −8.96 −0.019 0.002 −10.20
Distance to nearest nursing home (mi.) 0.134 0.003 44.70
0.138 0.003 45.38 0.140 0.003 49.07
Intercept −1.438 0.129 −11.10
−2.002 0.130 −15.35 −1.965 0.123 −16.00
A-5
Propensity Score Overlap
Propensity score weighting is used to mitigate the potential for selection bias by
increasing the equivalence of personal- and area-level characteristics between the demonstration
and comparison groups. Any beneficiaries who have estimated propensity scores below the
smallest estimated value in the demonstration group are removed from the comparison group.
This did not result in the removal of comparison beneficiaries in any of the 3 years.
The distributions of propensity scores by group are shown for each time period in
Figures A-1 to A-3 before and after propensity score weighting. Estimated scores covered nearly
the entire probability range in both groups. In each period, demonstration group scores were less
skewed to the right than the unweighted comparison beneficiary scores, which show sharp skew
to the right.
The figures show that Inverse Probability of Treatment Weighting (IPTW) pulls the
distribution of weighted comparison group propensity scores (dotted line) much closer to that of
the demonstration group (solid line). Weighting shifted the comparison group distribution to the
right, greatly increasing the comparability of the demonstration and comparison groups.

A-6
Figure A-1.
Distribution of beneficiary-level propensity scores in the South Carolina demonstration
and comparison groups, weighted and unweighted, February 2013–January 2014
1 2
3 4 5 6
Density
0 .2 .4 .6 .8 1
Propensity Score
Demonstration Unweighted Comparison
Weighted Comparison
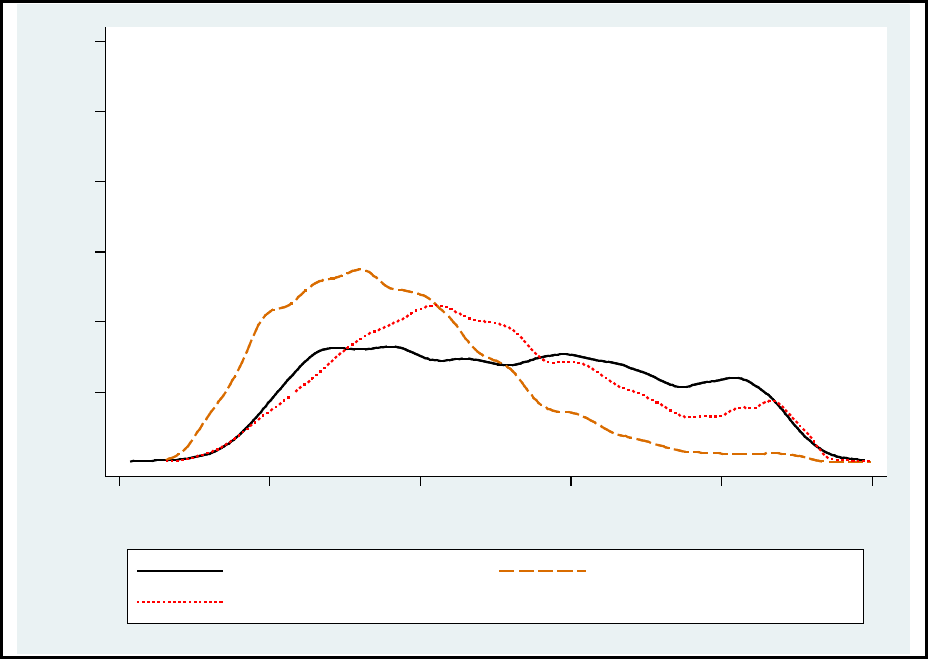
A-7
Figure A-2
Distribution of beneficiary-level propensity scores in the South Carolina demonstration
and comparison groups, weighted and unweighted, February 2014–January 2015
1 2
3 4 5 6
Density
0 .2 .4 .6
.8 1
Propensity Score
Demonstration Unweighted Comparison
Weighted Comparison

A-8
Figure A-3
Distribution of beneficiary-level propensity scores in the South Carolina demonstration
and comparison groups, weighted and unweighted, February 2015–December 2016
Group Comparability
Covariate balance refers to the extent to which the characteristics used in the propensity
score are similar (or “balanced”) for the demonstration and comparison groups. Group
differences are measured by a standardized difference (the difference in group means divided by
the pooled standard deviation of the covariate). We follow an informal standard that has
developed within the literature: groups are considered to be comparable if the standardized
covariate difference is less than 0.10.
The group means and standardized differences for all beneficiary characteristics are
shown for each time period in Tables A-4 to A-6. The column of unweighted standardized
differences indicates that several of these variables were not balanced before running the
propensity model. The area-level variables consistently exhibited larger standardized differences
than individual level variables across the three time periods. Demonstration beneficiaries were
less likely to live in MSAs and were located in areas with higher percentages of households
containing members aged 60 years or older. Average distances to both hospitals and nursing
1 2
3 4 5 6
Density
0 .2 .4 .6
.8 1
Propensity Score
Demonstration Unweighted Comparison
Weighted Comparison

A-9
homes were longer for demonstration beneficiaries. These differences were relatively stable
across time periods.
The results of propensity score weighting for South Carolina are illustrated in the far-
right column (weighted standardized differences) in Tables A-4 to A-6. Propensity weighting
pulled comparison group means closer to the demonstration group means, thereby reducing the
standardized differences and improving the match between the two groups. In each year,
weighting reduced the magnitude of the group standardized differences below the desired
threshold of 0.10 for all covariates except for the MSA status indicator and distances to nearest
hospital and nearest nursing home. The adjusted differences were quite small, amounting to only
1 percent for the MSA status indicator, and 1.2 miles or less for the distances. The MSA
difference fell below the 0.10 criterion in the first demonstration year.
Table A-4
South Carolina dual eligible beneficiary covariate means by group before and after
weighting by propensity score—Baseline year 1: February 2013–January 2014
Year 1
Demo
mean
Comp
group mean
PS-weighted
comp group
mean
Unweighted
standardized
difference
Weighted
standardized
difference
Age 75.797 75.893 75.778 −0.012 0.002
Died 0.051 0.057 0.055 −0.027 −0.016
Female 0.703 0.713 0.709 −0.022 −0.013
Black 0.501 0.342 0.458 0.327 0.086
Disability as original reason for
Medicare entitlement 0.116 0.109 0.119 0.022 −0.009
ESRD 0.003 0.002 0.002 0.010 0.005
Share mos. elig. during year 0.840 0.854 0.843 −0.050 −0.011
HCC score 1.372 1.451 1.397 −0.078 −0.025
Other MDM 0.070 0.175 0.078 −0.326 −0.032
MSA 0.660 0.812 0.719 −0.351 −0.130
% of pop living in married household 63.295 66.990 64.207 −0.303 −0.070
% of household w/ member greater
than age 60 38.342 34.504 38.408 0.449 −0.007
% of elderly with college degree 15.333 14.799 15.833 0.051 −0.044
% of elderly with self-care limitation 11.245 10.426 10.796 0.133 0.069
% of household w/ member less than
age 18 31.744 32.773 31.544 −0.154 0.029
% of elderly unemployed 7.163 6.261 7.640 0.089 −0.039
Distance to nearest hospital 10.728 8.592
9.609 0.348 0.181
Distance to nearest nursing home 8.340 5.788 7.832 0.588 0.105

A-10
Table A-5
South Carolina dual eligible beneficiary covariate means by group before and after
weighting by propensity score—Baseline year 2: February 2014–January 2015
Year 2
Demo
mean
Comp
group mean
PS-weighted
comp group
mean
Unweighted
standardized
difference
Weighted
standardized
difference
Age 75.602 75.695 75.564 −0.011 0.005
Died 0.048 0.059 0.049 −0.051 −0.004
Female 0.698 0.705 0.700 −0.016 −0.005
Black 0.487 0.337 0.447 0.307 0.079
Disability as original reason for
Medicare entitlement 0.101 0.098 0.103 0.007 −0.009
ESRD 0.001 0.001 0.001 0.013 0.006
Share mos. elig. during year 0.850 0.858 0.852 −0.030 −0.007
HCC score 1.305 1.382 1.320 −0.077 −0.016
Other MDM 0.157 0.217 0.177 −0.153 −0.052
MSA 0.667 0.809 0.719 −0.328 −0.113
% of pop living in married household 62.997 66.497 64.200 −0.287 −0.093
% of household w/ member greater
than age 60 39.046 35.165 39.112 0.450 −0.007
% of elderly with college degree 16.320 15.720 16.745 0.056 −0.038
% of elderly with self-care limitation 10.885 10.302 10.460 0.100 0.070
% of households w/ member less than
age 18
31.333 32.309 31.043 −0.146 0.042
% of elderly unemployed 6.244 5.847 6.605 0.042 −0.033
Distance to nearest hospital 10.642 8.612
9.514 0.330 0.182
Distance to nearest nursing home 8.252 5.791 7.796 0.570 0.094

A-11
Table A-6
South Carolina dual eligible beneficiary covariate means by group before and after
weighting by propensity score—Demonstration year 1: February 2015–December 2016
Year 3
Demo
mean
Comp
group mean
PS-weighted
comp group
mean
Unweighted
standardized
difference
Weighted
standardized
difference
Age 75.847 75.775 75.795 0.009 0.006
Died 0.027 0.021 0.027 0.039 0.003
Female 0.684 0.689 0.684 −0.011 0.000
Black 0.490 0.335 0.450 0.319 0.081
Disability as original reason for
Medicare entitlement 0.106 0.102 0.106 0.011 0.000
ESRD 0.007 0.003 0.005 0.051 0.018
Share mos. elig. during year 0.675 0.755 0.671 −0.241 0.011
HCC score 1.437 1.467 1.433 −0.028 0.004
Other MDM 0.157 0.227 0.172 −0.179 −0.041
MSA 0.672 0.803 0.716 −0.301 −0.097
% of pop living in married household 63.077 66.488 64.161 −0.283 −0.084
% of household w/ member greater
than age 60 39.583 36.021 39.691 0.420 −0.012
% of elderly with college degree 16.728 16.513 16.887 0.020 −0.014
% of elderly with self-care limitation 10.819 10.301 10.489 0.089 0.054
% of household w/ member less than
age 18
30.829 31.883 30.552 −0.159 0.041
% of elderly unemployed 4.918 4.782 4.716 0.017 0.023
Distance to nearest hospital 10.586 8.629 9.407 0.315
0.188
Distance to nearest nursing home 8.193 5.813 7.685 0.551 0.105
Enrollee Results
In addition, we performed propensity score weighting on a subgroup of demonstration
enrollees (approximately 24 percent of the eligible demonstration population). We define the
enrollee group, as well as its comparison group, as follows: (1) The demonstration enrollees are
those with at least three months of enrollment during the 1-year demonstration period as well as
three months of eligibility during the 2-year baseline period, and (2) The corresponding
comparison group beneficiaries are those with at least three months of eligibility in both the 1-
year demonstration period and the 2-year baseline period. The propensity score weighting
analysis on enrollees and their associated comparison group yielded slightly better results than
our analysis of all eligible beneficiaries. Propensity score weighting lowered the weighted
standardized differences to below the 0.10 threshold for all covariates, except for the distance to
nearest hospital.
A-12
Summary
Our analyses revealed differences between the South Carolina demonstration and
comparison groups before covariate balancing with regard to several area-level characteristics as
well as demographics. However, the propensity score-based weighting process reduced nearly all
of these disparities to standardized differences of less than 0.10 over the three time periods. The
only exceptions were for the MSA indicator and distances to nearest hospitals and nursing
homes, although the differences were small in absolute terms.
The weighted score distributions were similar for the two groups, with propensities
covering a wide range of probabilities in both groups. The weighted data reduce the risk that
selection bias will contaminate outcome analyses of the South Carolina demonstration. The
propensity score covariates may also be incorporated in the multiple regression models used to
estimate demonstration effects for key outcomes to further reduce the potential for biased
estimates.
Further analysis of the enrollee group similarly showed that propensity score weighting
reduced standardized differences between the demonstration and comparison groups. Indeed, the
enrollee results had even fewer standardized differences exceeding the 0.10 threshold than the
all-eligible results.
B-1
Appendix B:
Analysis Methodology
Methodology
We briefly describe the overall evaluation design, the data used, and the populations and
measures analyzed.
Evaluation Design
RTI International is using an intent-to-treat (ITT) approach for the impact analyses
conducted for the evaluation, comparing the eligible population under each State demonstration
with a similar population that is not affected by the demonstration (i.e., a comparison group).
ITT refers to an evaluation design in which all Medicare-Medicaid enrollees eligible for the
demonstration constitute the evaluation sample, regardless of whether they actively participated
in demonstration models. Thus, under the ITT framework, analyses include all beneficiaries
eligible for the demonstration, including those who are eligible but are not contacted by the State
or participating providers to enroll in the demonstration or care model; those who enroll but do
not engage with the care model; and a group of similar eligible individuals in the comparison
group. The ITT approach diminishes the potential for selection bias.
Results for a special population within each of the demonstration and comparison groups
are also presented in this section (e.g., those with any behavioral health claims in the
demonstration and comparison groups). In addition, one group for which descriptive results are
also reported are not compared to the comparison group because this group does not exist within
the comparison group: South Carolina demonstration enrollees. For in-State demonstration
enrollees, we compare them to in-State non-enrollees.
Comparison Group Identification
The comparison group will serve to provide an estimate of what would have happened to
the demonstration group in the absence of the demonstration. Thus, the comparison group
members should be similar to the demonstration group members in terms of their characteristics
and health care and long-term services and supports (LTSS) needs, and they should reside in
areas that are similar to the demonstration State in terms of the health care system and the larger
environment. For this evaluation, identifying the comparison group members entailed two steps:
(1) selecting the geographic area from which the comparison group would be drawn and
(2) identifying the individuals who would be included in the comparison group.
To construct South Carolina’s comparison group, we used out-of-State areas. We
compared demonstration and potential comparison areas on a range of predemonstration period
measures, including spending per Medicare-Medicaid enrollee by each program, the shares of
LTSS delivered in facility-based and community settings, and the extent of Medicare and
Medicaid managed care penetration. Using statistical analysis, we selected the individual
comparison metropolitan statistical areas (MSAs) that most closely match the values found in the
demonstration area on the selected measures. We also considered other factors when selecting
comparison States, such as timeliness of Medicaid data submission to CMS. We identified a
B-2
comparison group from MSAs in North Carolina, Virginia, Georgia, and Mississippi. For details
of the comparison group identification strategy, see Appendix A.
Data
Annual Report analyses used data from a number of sources. First, the State provided
quarterly finder files containing identifying information on all demonstration eligible
beneficiaries in the demonstration period. Second, RTI obtained administrative data on
beneficiary demographic, enrollment, and service use characteristics from CMS data systems for
both demonstration and comparison group members. Third, these administrative data were
merged with Medicare claims and encounter data on utilization of Medicare services, as well as
the MDS.
Although Medicaid service data on use of LTSS, behavioral health, and other Medicaid-
reimbursed services were not available for the demonstration period and therefore are not
included in this report, CMS administrative data identifying eligible beneficiaries who used any
Medicare behavioral health services were available, so that their Medicare service use could be
presented in this report. Future reports will include findings on Medicaid service use once data
are available.
Populations and Services Analyzed
The populations analyzed in the report include all demonstration eligible beneficiaries, as
well as the following special populations: those with any behavioral health service use in the last
2 years for a serious and persistent mental illness (SPMI); demonstration enrollees; and
demographic groups (race/ethnicity).
For all demonstration eligible beneficiaries and service types analyzed, we provide
estimates of three access to care and utilization measures: the percent of demonstration eligible
beneficiaries with any use of a service, and counts of service use for both all eligible
beneficiaries and users of the respective service.
The 14 service settings analyzed include both institutional (inpatient, inpatient
psychiatric, inpatient non-psychiatric, emergency department visits not leading to admission,
emergency department psychiatric visits, observation stays, skilled nursing facility, and hospice)
and community settings (primary care, outpatient as well as independent physical, speech, and
occupational therapy, and other hospital outpatient services).
In addition, six quality measures representing specific utilization types of interest are
presented: 30-day all-cause risk-standardized readmission rate; preventable ER visits; rate of 30-
day follow-up after hospitalization for mental illness; ambulatory care sensitive condition overall
composite rate (Agency for Healthcare Research and Quality [AHRQ] Prevention Quality
Indicator [PQI] #90); ambulatory care sensitive condition chronic composite rate (AHRQ PQI
#92); and depression screening rate.
Five nursing facility-related measures are presented from the Minimum Data Set: two
measures of annual NF utilization (admission rate and percentage of long-stay NF users) and
B-3
three characteristics of new long-stay NF residents at admission (functional status, percent with
severe cognitive impairment, percent with low level of care need).
The analyses were conducted for each of the years in the 2-year predemonstration period
(February 1, 2013 to January 31, 2015) and for the first demonstration period (February 1, 2015
to December 31, 2016) for both the demonstration and comparison groups in each of the three
analytic periods.
Table B-1 presents descriptive statistics on the independent variables used in multivariate
DinD regressions for impact analyses. Independent variables include demographic and health
characteristics and market- and area-level characteristics. Results are presented for five groups:
all demonstration eligible beneficiaries in the FAI State, its comparison group, demonstration
enrollees, non-enrollees, and demonstration eligible beneficiaries with an SPMI.
The most prevalent age group across all categories was between 65 and 74 years old.
Around 55 percent were between 65 and 74, and 27 percent were between 75 and 84. Across all
groups, the majority of eligible beneficiaries were female, with 75.3 percent among beneficiaries
with SPMI being the highest percentage. A plurality were Black (49.8 and 53.8 percent in the
demonstration eligible and enrollee group, respectively), followed by White (46.1 and 41.8
percent in the demonstration eligible and enrollee group, respectively). The percentage of the
population that was White was slightly higher in the comparison group (48.5 percent) and among
the SPMI population (64.4 percent). About 10 percent of the population had disability as the
reason for their Medicare enrollment (SPMI was 14 percent). HCC scores ranged from 1.4 in the
demonstration and comparison group to 1.7 in the SPMI group. The Hierarchical Condition
Category (HCC) score is a measure of the predicted relative annual cost of a Medicare
beneficiary based on the diagnosis codes present in recent Medicare claims. Beneficiaries with a
score of 1 are predicted to have average cost in terms of annual Medicare expenditures.
Beneficiaries with HCC scores less than 1 are predicted to have below average costs, whereas
beneficiaries with scores of 2 are predicted to have twice the average annual cost. The vast
majority of eligible beneficiaries resided in the metropolitan areas, compared to non-
metropolitan areas. The percent of months of dual eligibility was lowest among those who did
not enroll in the demonstration.
There were limited differences in area- and market-level characteristics. Those who were
in the comparison group resided in counties with a higher population density, relative to those in
the demonstration group (268 vs 155 per square mile). Additionally, those in the comparison
group resided in counties with higher Medicaid spending per dual eligible, relative to counties in
the demonstration group ($12,260 vs $8,937).

B-4
Table B-1
Characteristics of demonstration eligible beneficiaries in current demonstration year by group
Characteristics Demonstration Comparison Enrollees Non-enrollees SPMI diagnosis
Number of eligible beneficiaries 28,005 40,608 10,673 17,332 6,065
Demographic characteristics
Age (%)
65 to 74 55.5 54.8 53.6 56.7 60.8
75 to 84 26.8 27.7 29.3 25.3 25.9
85 and older 17.7 17.4 17.1 18.0 13.3
Female (%)
No 31.7 31.6 30.3 32.5 24.7
Yes 68.3 68.4 69.7 67.5 75.3
Race/Ethnicity (%)
White 46.1 48.5 41.8 48.8 64.4
Black 49.8 45.0 53.8 47.3 33.4
Hispanic 1.3 1.9 1.4 1.2 0.8
Asian 1.6 2.5 1.9 1.5 0.7
Disability as reason for Original Medicare entitlement (%)
No (0) 89.2 89.4
89.3 89.1 86.0
Yes (1) 10.8 10.6 10.7 10.9 14.0
ESRD status (%)
No (0) 99.3 99.5 99.7 99.0 99.2
Yes (1) 0.7 0.5 0.3 1.0 0.8
MSA (%)
Non-metro (0) 33.5 28.4 34.7 32.8 28.0
Metro (1) 66.5 71.6 65.3 67.2 72.0
Months with full-dual eligibility during year (%) 0.7
0.7 0.8 0.6 0.7
HCC score 1.4 1.4 1.4 1.5 1.7
(continued)

B-5
Table B-1 (continued)
Characteristics of demonstration eligible beneficiaries in current demonstration year by group
Characteristics Demonstration Comparison Enrollees Non-enrollees SPMI diagnosis
Market characteristics
Medicare spending per dual, ages 19+ ($) 16,401.6 16,282.1 16,426.1 16,386.5 16,412.3
MA penetration rate 0.2 0.2 0.2 0.2 0.2
Medicaid-to-Medicare fee index (FFS) 0.8 0.8 0.8 0.8 0.8
Medicaid spending per dual, ages 19+ ($) 8,937.4 12,260.1 8,919.4 8,948.5 9,090.7
Fraction of duals using NF, ages 65+ 0.2 0.2 0.2 0.2 0.2
Fraction of duals using HCBS, ages 65+ 0.1 0.1 0.1 0.1 0.1
Fraction of duals using personal care, ages 65+ 0.1 0.1 0.1 0.1 0.1
Fraction of duals with Medicaid managed care, ages 19+ — — — — —
Population per square mile, all ages 154.7 268.0 157.4 153.0 161.9
Patient care physicians per 1,000 population 0.6 0.6 0.6 0.6 0.7
Area characteristics
% of pop. living in married households 62.9 64.2 62.2 63.3 64.3
% of elderly (65+) with college education 16.8 16.9 16.5 17.0 16.6
% of elderly (65+) with self-care limitations 10.9 10.5 11.0 10.8 10.8
% of elderly (65+) unemployed 4.9 4.7 4.9 4.9 4.9
% of household with individuals younger than 18 30.8 30.6 30.6 30.9 30.9
% of household with individuals older than 60 39.6 39.7 39.8 39.5 38.8
Distance to nearest hospital 10.6 9.4 10.8 10.5 9.9
Distance to nearest nursing facility 8.2 7.7 8.4 8.1 7.7
ESRD = end-stage renal disease; FFS = fee for service; HCC = Hierarchical Condition Category; LTSS = long-term services and supports; MA = Medicare
Advantage, MSA = metropolitan statistical area; NF = nursing facility; SPMI = serious and persistent mental illness.
B-6
Detailed Population Definitions
Demonstration eligible beneficiaries. Beneficiaries are identified in a given month if they
were a Medicare-Medicaid enrollee and met any other specific demonstration eligibility criteria.
Beneficiaries in the demonstration period are identified from quarterly State finder files, whereas
beneficiaries in the 2-year period preceding the demonstration implementation date are identified
by applying the eligibility criteria in each separate predemonstration quarter.
Additional special populations were identified for the analyses as follows:
• Enrollees. A beneficiary was defined as an enrollee if they were enrolled in the
demonstration during the demonstration period.
• Age. Age was defined as a categorical variable where beneficiaries were identified as
65 to 74, 75 to 84, and 85 years and older during the observation year (e.g.,
predemonstration period 1, predemonstration period 2, and demonstration period 1).
• Gender. Gender was defined as binary variable where beneficiaries were either male
or female.
• Race/Ethnicity. Race/ethnicity was defined as a categorical variable where
beneficiaries were categorized as White, Black, Hispanic, or Asian.
• Serious and persistent mental illness (SPMI). A beneficiary was defined as having a
SPMI if a beneficiary had incurred a claim for serious and persistent mental illness
within the past 2 years.
Detailed Utilization and Expenditure Measure Definitions
For any health care service type, the methodology for estimating average monthly
utilization and the percentage of users takes into account differences in the number of eligibility
months across beneficiaries. Because full benefit dual eligibility status for the demonstration can
vary by month over time for any individual, the methodology used determines dual eligibility
status for the demonstration for each person on a monthly basis during a predemonstration or
demonstration period. That is, an individual can meet the demonstration’s eligibility criteria for
up to 12 months during the observation year. The methodology adds the total months of full
benefit dual eligibility for the demonstration across the population of interest and uses it in the
denominator in the measures in Section 8, creating average monthly utilization information for
each service type. The methodology effectively produces average monthly use statistics for each
year that account for variation in the number of dual eligible beneficiaries in each month of the
observation year.
The utilization measures below were calculated as the aggregate sum of the unit of
measurement (e.g., counts) divided by the aggregated number of eligible member months [and
user months] within each group (g) where group is defined as (1) South Carolina base year 1,
(2) Comparison base year 1, (3) South Carolina base year 2, (4) Comparison base year 2,
(5) South Carolina demonstration year 1, (6) Comparison demonstration year 1.

B-7
We calculated the average number of services per 1,000 eligible months and per 1,000
user months by beneficiary group (g). We defined user month as an eligible month where the
number of units of utilization used [for a given service] was greater than zero during the month.
We weight each observation using yearly propensity weights. The average yearly utilization
outcomes are measured as:
Where
Y
ɡ
= average count of the number services used [for a given service] per eligible or
user month within group g.
Ȥ
iɡ
= the total units of utilization [for a given service] for individual i in group g.
n
iɡ
= the total number of eligible/user months for individual i in group g.
The denominator above is scaled by such that the result is interpreted in terms of
average monthly utilization per 1,000 eligible beneficiaries. This presentation is preferable,
compared with per eligible, because some of the services are used less frequently and would
result in small estimates.
The average percentage of users [of a given service] per eligible month during the
predemonstration or demonstration year is measured as follows:
Where
U
ig
= average percentage of users [for a particular service] in a given month among
beneficiaries in group g.
X
ig
= the total number of eligible months of service use for an individual i in group g.
n
iɡ
= the total number of eligible or user months for an individual i in group g.
Quality of Care and Care Coordination Measures
Similar to the utilization measures, for the appendix tables of descriptive statistics, the
quality of care and care coordination measures were calculated as the aggregated sum of the
numerator divided by the aggregated sum of the denominator for each respective outcome within
each beneficiary group, except for the average 30-day all-cause risk-standardized readmission
rate and the 30-day follow-up after hospitalization for mental illness, which are reported as
percentages.
=
Σ
1
1,000
(
)
∗Σ
1
1,000
* 100
=
Σ
Σ

B-8
1. Average 30-day all-cause risk-standardized readmission rate (percent) was calculated as
follows:
Where
C = the national average of 30-day readmission rate, .238.
X
ig
= the total number of readmissions for individual i in group g.
n
iɡ
= the total number of hospital admissions for individual i in group g.
Prob
g
= the annual average adjusted probability of readmission for individuals in
group g. The average adjusted probability equals:
Average adjusted probability of readmission by
demonstration group
Demonstration group
Average adjusted probability
of readmission
Predemonstration year 1
South Carolina 0.163
Comparison 0.168
Predemonstration year 2
South Carolina 0.166
Comparison 0.172
Demonstration year 1
South Carolina 0.170
Comparison 0.176
2. Rate of 30-day follow-up in a physician or outpatient setting after hospitalization for mental
illness (percent) was calculated as follows:
Where
MHFU = the average rate of 30-day follow-up care after hospitalization for a mental
illness (percent) for individuals in group g.
X
iɡ
= the total number of discharges from a hospital stay for mental health that had a
follow-up for mental health within 30 days of discharge for individual i in group
g.
30 − =
Σ
Σ
n
( )
=
Σ
Σ
n
∗100

B-9
n
iɡ
= the total number of discharges from a hospital stay for mental health for
individual i in group g.
3. Average ambulatory care sensitive condition admissions per eligible beneficiary, overall and
chronic composite (PQI #90 and PQI #92) was calculated as follows:
Where
ACSC
ɡ
= the average number of ambulatory care sensitive condition admissions per
eligible month for overall/chronic composites for individuals in group g.
X
iɡ
= the total number of discharges that meet the criteria for AHRQ PQI #90 [or
PQI #92] for individual i in group g.
n
iɡ
= the total number of eligible months for individual i in group g.
Preventable ER visits per eligible month was calculated as follows:
Where
ER
ɡ
= the average number of preventable ER visits per eligible month for individuals
in group g.
X
iɡ
= the total number ER visits that are considered preventable based in the diagnosis
for individual i in group g.
n
iɡ
= the total number of eligible months for individual i in group g.
4. Average number of beneficiaries per eligible month who received depression screening
during the observation year was calculated as follows:
Where
D
ɡ
= the average number of beneficiaries per eligible month who received depression
screening in group g.
X
ig
= the total number eligible beneficiaries age 65+ who ever received depression
screening in group g.
n
iɡ
= the total number of eligible months among beneficiaries in group g.
=
Σ
Σ
n
=
Σ
Σ
n
=
Σ
Σ
n

B-10
Average rate of beneficiaries per positive depression screening who received a follow-up
plan during the observation year was calculated as follows:
Where
PD
ɡ
= the average number of beneficiaries per positive depression screening who
received a follow-up plan among beneficiaries in group g.
X
iɡ
= the total number beneficiaries who received a positive depression screen and a
follow-up plan in group g.
n
iɡ
= the total number of beneficiaries who received a positive depression screen in
group g.
Minimum Data Set Measures
Two measures of annual nursing facility-related utilization are derived from the MDS.
The rate of new long-stay NF admissions per 1,000 eligible beneficiaries is calculated as the
number of NF admissions for whom there is no record of NF use in the 100 days prior to the
current admission and who subsequently stay in the NF for 101 days or more. Individuals are
included in this measure only if their NF admission occurred after their first month of
demonstration eligibility. The percentage of long-stay NF users is calculated as the number of
individuals who have stayed in a NF for 101 days or more, who were long-stay after the first
month of demonstration eligibility. The probability of any long-stay NF use primarily includes
new admissions from the community.
Characteristics of new long-stay NF residents at admission are also included in order to
monitor nursing facility case mix and acuity levels. Functional status and low level of care need
are determined by the Resource Utilization Groups Version IV (RUG-IV). Residents with low
care need are defined as those who did not require physical assistance in any of the four late-loss
activities of daily living (ADLs) and who were in the three lowest RUG-IV categories. Severe
cognitive impairment is assessed by the Brief Interview for Mental Status (BIMS), poor short-
term memory, or severely impaired decision-making skills.
Regression Outcome Measures
Five utilization measures are used as dependent variables in regression analysis to
estimate the DinD effect for the entire demonstration period as well as the effect in each
demonstration year. These measures are derived from Medicare inpatient, outpatient, carrier, and
skilled nursing facility claims and encounter data and MDS long-term nursing facility use. All
dependent variables are based on a monthly basis except for the MDS long-stay nursing facility
measure and 30-day inpatient readmission measure, which are ANNUAL.
=
Σ
Σ
n

B-11
The outcome measures include:
• Monthly Inpatient Admissions is the monthly probability of having any inpatient
admission in which a beneficiary has an admission date within the observed month.
• Monthly Emergency Department Use is the monthly probability of having any
emergency department visits that occurred during the month that did not result in an
inpatient admission.
• Monthly Physician Visits is the count of any evaluation and management visit within
the month where the visit occurred in the outpatient or office setting, nursing facility,
domiciliary, rest home, or custodial care setting, a federally qualified health center or
a rural health center.
• Monthly Skilled Nursing Facility Admissions is the monthly probability of having any
skilled nursing facility admission within the month.
• Long-stay Nursing Facility Use is the annual probability of residing in a nursing
home for 101 days or more during the year.
In addition to the five measures above, this evaluation will estimate the demonstration
effects on quality of care. The following quality of care and care coordination measures use
claims/encounter-level information and are adopted from standardized HEDIS and NQF
measures. The outcomes are reported monthly, with the exception of the 30-day all-cause risk-
standardized readmission rate, which is annual.
• 30-day all-cause risk-standardized readmissions (NQF #1768) is the count of the
number of risk-standardized readmissions, defined above, that occur during the year.
• Preventable ER visits is a continuous variable of weighted ER visits among adults.
The lists of diagnoses that are considered as either preventable/avoidable, or treatable
in a primary care setting were developed by researchers at the New York University
Center for Health and Public Service Research.
11
• 30-day follow-up after hospitalization for mental illness (NQF #576) is estimated as
the monthly probability of any follow-up visits within 30-days post-hospitalization
for a mental illness.
• Ambulatory care sensitive condition (ACSC) admissions—overall composite (AHRQ
PQI # 90) is the monthly probability of any acute admissions that meet the AHRQ
PQI #90 (Prevention Quality Overall Composite) criteria within the month.
11
https://wagner.nyu.edu/faculty/billings/nyued-background
B-12
• Ambulatory care sensitive condition (ACSC) admissions—chronic composite (AHRQ
PQI # 92) is the monthly probability of any admissions that meet the AHRQ PQI #92
criteria within the month.
Regression Methodology for Determining Demonstration Impact
The regressions across the entire demonstration period compare all demonstration eligible
beneficiaries in the FAI State to its comparison group. The regression methodology accounts for
both those with and without use of the specific service (e.g., for inpatient services, both those
with and without any inpatient use). A restricted DinD equation will be estimated as follows:
Dependent variable
i
= F (β
0
+ β
1
PostYear + β
2
Demonstration +
β
3
PostYear * Demonstration + β
4
Demographics + β
5-j
Market + ε)
where separate models will be estimated for each dependent variable. PostYear is an
indicator of whether the observation is from the pre- or postdemonstration period, Demonstration
is an indicator of whether the beneficiary was in the demonstration group, and PostYear *
Demonstration is an interaction term. Demographics and Market represent vectors of beneficiary
and market characteristics, respectively.
Under this specification, the coefficient β
0
reflects the comparison group
predemonstration period mean adjusted for demographic and market effects, β
1
reflects the
average difference between postperiod and predemonstration period in the comparison group, β
2
reflects the difference in the demonstration group and comparison group at predemonstration,
and β
3
is the overall average demonstration effect during the demonstration period. This last term
is the DinD estimator and the primary policy variable of interest, but in all regression models,
because of nonlinearities in the underlying distributions, post-regression predictions of
demonstration impact are performed to obtain the marginal effects of demonstration impact.
In addition to estimating the model described in Equation 1, a less restrictive model was
estimated to produce year-by-year effects of the demonstration. The specification of the
unrestricted model is as follows:
Dependent variable = F (β
0
+ β
1-k
PostYear
1-n
+ β
2
Demonstration +
β
3-k
PostYear
1-n
* Demonstration + β
4
Demographics + β
5-j
Market + ε)
This equation differs from the previous one in that separate DinD coefficients are
estimated for each year. Under this specification, the coefficients β
3-k
would reflect the impact of
the demonstration in each respective year, whereas the previous equation reflects the impact of
the entire demonstration period. This specification measures whether changes in dependent
variables occur in the first year of the demonstration only, continuously over time, or in some
other pattern. Depending on the outcome of interest, we will estimate the equations using logistic
regression, Generalized Linear Models with a log link, or count models such as negative
binomial or Poisson regressions (e.g., for the number of readmissions). We used regression
results to calculate the marginal effects of demonstration impact.
Impact estimates across the entire demonstration period are determined using the DinD
methodology and presented in figures for all demonstration eligible beneficiaries, and then for

B-13
one special population of interest—demonstration eligible beneficiaries with SPMI. A table
follows each figure displaying the annual demonstration DinD effect for each separate
demonstration period for each of these populations. In each figure, the point estimate is displayed
for each measure, as well as the 90 percent confidence interval (black If the confidence interval
includes the value of zero, it is not statistically significant at that confidence level.
The three adjusted means tables presented for the full demonstration eligible population
in the report provide both DinD results as well as accompanying adjusted mean values that allow
direct comparisons regarding service utilization and costs across the baseline and demonstration
periods, separately for the demonstration and comparison groups. The purpose of these tables is
to understand the magnitude of the DinD estimate relative to the adjusted mean outcome value in
each period. The adjusted mean values show how different the two groups were in each period,
and the relative direction of any potential effect in each group over time. To make meaningful
comparisons for the adjusted mean value results, we needed to take into account any differences
in population characteristics across the four groups. To do this, we replaced the data values for
all demographic, health, and area-related characteristics in each group to be those of the
comparison group in the demonstration period, which we selected as the reference group.
The steps involved in this process for each type of outcome measure are:
1. Run the regression estimating the probability or level of service use or costs
2. Predict DinD (last two columns in each adjusted means table)
3. Replace the data values for three of the four groups to be those of the comparison
group in the demonstration period so all four groups have the same population
characteristics
4. Predict the weighted mean for each of the four groups using the regression results
stored in computer memory.
The DinD estimate is also provided for reference, along with the p-value and the relative
percent change of the DinD estimate compared to an average mean value for the comparison
group in the entire demonstration period. The relative percent annual change for the DinD
estimate for each outcome measure is calculated as [Overall DinD effect] / [Adjusted mean
outcome value of comparison group in the demonstration period].
Table B-2 provides an illustrative example of the regression output for each independent
variable in the logistic regression on monthly inpatient admissions across the entire
demonstration period.

B-14
Table B-2
Logistic regression results on the probability of any inpatient admissions during a month
(n = 2,421,997 person months)
Independent variables Coefficient Standard error z-value p-value
Post period −0.3160 0.0255 −12.410 0.000
Demonstration group −0.1461 0.0681 −2.150 0.032
Interaction of post period x demonstration group −0.2301 0.0270 −8.530 0.000
Trend 0.0085 0.0009 9.480 0.000
Age 0.0160 0.0009 18.010 0.000
Female −0.0810 0.0154 −5.250 0.000
Black −0.1641 0.0172 −9.530 0.000
Asian −0.6096 0.0466 −13.090 0.000
Hispanic −0.3750 0.0938 −4.000 0.000
Other race −0.4728 0.0640 −7.390 0.000
Disability as reason for original Medicare entitlement 0.0388 0.0221 1.760 0.079
End-stage renal disease 1.2444 0.0642 19.370 0.000
Hierarchical Condition Category (HCC) score 0.4200 0.0050 84.230 0.000
Percent of months of demonstration eligibility −1.5001 0.0559 −26.830 0.000
Metropolitan statistical area (MSA) residence 0.0440 0.0632 0.700 0.486
Percent of population living in a married household −0.0013 0.0006 −2.200 0.028
Percent of households with family member greater than or
equal to 60 years old 0.0015 0.0015 0.980
0.326
Percent of households with family member less than 18
years old 0.0017 0.0021 0.770
0.439
Percent of elderly (65+) with college education −0.0013 0.0009 −1.390 0.165
Percent of elderly (65+) unemployed −0.0005 0.0007 −0.740 0.460
Percent of elderly (65+) with self-care limitation 0.0022 0.0010 2.110 0.035
Distance to nearest hospital −0.0006 0.0018 −0.360 0.716
Distance to nearest nursing facility 0.0018 0.0025 0.710 0.477
Medicare spending per full benefit dual eligible 0.0000 0.0000 −0.130 0.893
Medicare Advantage penetration rate 0.0769 0.3455 0.220 0.824
Medicaid-to-Medicare fee index 1.5232 0.4505 3.380 0.001
Nursing facility users per full benefit dual eligible over 65 −0.3422 0.5447 −0.630 0.530
State plan personal care users per full benefit dual eligible
over 65
0.5136 0.3629 1.420
0.157
HCBS users per full benefit dual eligible over 65 0.0196 0.3516 0.060 0.956
Population per square mile −0.0004 0.0001 −2.920 0.004
Patient care physicians per 1,000 (total) population 0.0868 0.1480 0.590 0.557
Participating in shared savings program 0.1653 0.0331 4.990 0.000
Intercept −4.9442 0.6579 −7.510 0.000
C-1
Appendix C:
Descriptive Tables
Tables in Appendix C present results on the average percentage of demonstration eligible
beneficiaries using selected Medicare service types during the months in which they met
demonstration eligibility criteria in the predemonstration and demonstration periods. In addition,
average counts of service use and payments are presented across all such eligible months, and for
the subset of these months in which eligible beneficiaries were users of each respective service
type. Data is shown for the predemonstration and demonstration period for both South Carolina
eligible beneficiaries (a.k.a. the demonstration group) and the comparison group.
Tables are presented for the overall demonstration eligible population (Tables C-1
through C-3), followed by tables on South Carolina demonstration eligible beneficiaries who
were enrollees and non-enrollees (Tables C-4 through C-5).

C-2
Table C-1
Proportion and utilization for institutional and non-institutional services for the South Carolina demonstration eligible
beneficiaries and comparison groups
Measures by setting Group
Predemonstration
year 1
Predemonstration
year 2
Demonstration
year 1
Number of demonstration eligible beneficiaries 27,694 25,283 28,005
Number of comparison eligible beneficiaries 36,474 35,615 40,608
Institutional setting
Inpatient admissions
1
Demonstration group
% with use 3.5 3.4 3.3
Utilization per 1,000 user months 1,131.8 1,139.4 1,133.5
Utilization per 1,000 eligible months 39.1 39.1 36.9
Inpatient admissions
1
Comparison group
% with use
3.6 3.6 4
Utilization per 1,000 user months
1,116.1 1,132.5 1,138.4
Utilization per 1,000 eligible months
40.7 41.3 46.1
Inpatient psychiatric Demonstration group
% with use
0.1 0.1 0.1
Utilization per 1,000 user months
1,074.5 1,062.9 1,057.2
Utilization per 1,000 eligible months
0.7 0.7 0.7
Inpatient psychiatric Comparison group
% with use
0.1 0.1 0.1
Utilization per 1,000 user months
1,064.6 1,055.7 1,037.1
Utilization per 1,000 eligible months
0.8 0.8 0.7
(continued)

C-3
Table C-1 (continued)
Proportion and utilization for institutional and non-institutional services for the South Carolina demonstration eligible
beneficiaries and comparison groups
Measures by setting Group
Predemonstration
year 1
Predemonstration
year 2
Demonstration
year 1
Inpatient non-psychiatric Demonstration group
% with use 3.4 3.4 3.2
Utilization per 1,000 user months 1,129.0 1,137.9 1,132.0
Utilization per 1,000 eligible months 38.4 38.5 36.1
Inpatient non-psychiatric Comparison group
% with use 3.6 3.6 4
Utilization per 1,000 user months 1,113.3 1,130.5 1,137.4
Utilization per 1,000 eligible months 39.7 40.5 45.3
Emergency department use (non-admit) Demonstration group
% with use 5.6 5.9 5.8
Utilization per 1,000 user months 1,183.0 1,171.1 1,205.6
Utilization per 1,000 eligible months 66.4 69.2 69.8
Emergency department use (non-admit) Comparison group
% with use 6.1 6.4 6.9
Utilization per 1,000 user months 1,191.5 1,188.9 1,203.9
Utilization per 1,000 eligible months 72.7 76 83.2
Emergency department use (psychiatric) Demonstration group
% with use 0.2 0.2 0.2
Utilization per 1,000 user months 1,094.8 1,028.6 1,118.5
Utilization per 1,000 eligible months 1.7 1.7 2.1
Emergency department use (psychiatric) Comparison group
% with use 0.2 0.2 0.2
Utilization per 1,000 user months 1,059.3 1,096.4 1,055.5
Utilization per 1,000 eligible months 1.7 2 2.2
(continued)

C-4
Table C-1 (continued)
Proportion and utilization for institutional and non-institutional services for the South Carolina demonstration eligible
beneficiaries and comparison groups
Measures by setting Group
Predemonstration
year 1
Predemonstration
year 2
Demonstration
year 1
Observation stays Demonstration group
% with use 0.7 0.7 0.7
Utilization per 1,000 user months 1,025.1 1,016.2 1,030.9
Utilization per 1,000 eligible months 7.2 7.1 7.2
Observation stays Comparison group
% with use 0.8 0.8 1.0
Utilization per 1,000 user months 1,035.8 1,030.9 1,035.4
Utilization per 1,000 eligible months 7.8 8.6 9.8
Skilled nursing facility Demonstration group
% with use 0.7 0.7 0.8
Utilization per 1,000 user months 1,071.9 1,066.3 1,075.0
Utilization per 1,000 eligible months 7.6 7.4 8.4
Skilled nursing facility Comparison group
% with use 0.9 0.9 1.2
Utilization per 1,000 user months 1,079.5 1,075.1 1,086.0
Utilization per 1,000 eligible months 10.0 9.8 12.9
Hospice Demonstration group
% with use 0.9 0.8 1.1
Utilization per 1,000 user months 1,022.9 1,024.1 1,030.8
Utilization per 1,000 eligible months 9.0 7.8 10.8
Hospice Comparison group
% with use 0.6 0.5 1.1
Utilization per 1,000 user months 1,013.4 1,020.5 1,016.1
Utilization per 1,000 eligible months 5.7 5.4 10.8
(continued)

C-5
Table C-1 (continued)
Proportion and utilization for institutional and non-institutional services for the South Carolina demonstration eligible
beneficiaries and comparison groups
Measures by setting Group
Predemonstration
year 1
Predemonstration
year 2
Demonstration
year 1
Non-institutional setting
Primary care E&M visits Demonstration group
% with use
47.8 48.0 46.2
Utilization per 1,000 user months
1,620.7 1,625.1 1,688.8
Utilization per 1,000 eligible months
775.5 779.5 780.1
Primary care E&M visits Comparison group
% with use
49.5 50.2 51.0
Utilization per 1,000 user months
1,681.0 1,705.5 1,761.9
Utilization per 1,000 eligible months
832.8 856.9 899.2
Outpatient therapy (PT, OT, ST) Demonstration group
% with use
1.4 1.5 1.6
Utilization per 1,000 user months
13,979.7 15,175.4 15,426.7
Utilization per 1,000 eligible months
193.6 224.6 242.6
Outpatient therapy (PT, OT, ST) Comparison group
% with use
1.6 1.7 2.3
Utilization per 1,000 user months
20,328.9 20,449.6 22,143.0
Utilization per 1,000 eligible months
329.6 340.5 501.8
Independent therapy (PT, OT, ST) Demonstration group
% with use
0.6 0.7 0.7
Utilization per 1,000 user months
13,728.8 15,148.2 14,457.3
Utilization per 1,000 eligible months
86.7 105.5 101.9
Independent therapy (PT, OT, ST) Comparison group
% with use
0.7 0.7 0.8
Utilization per 1,000 user months
10,425.7 11,095.3 11,327.4
Utilization per 1,000 eligible months
69.1 74.3 86.7
(continued)

C-6
Table C-1 (continued)
Proportion and utilization for institutional and non-institutional services for the South Carolina demonstration eligible
beneficiaries and comparison groups
Measures by setting Group
Predemonstration
year 1
Predemonstration
year 2
Demonstration
year 1
Other hospital outpatient services Demonstration group
% with use
26.5 26.4 24.5
Utilization per 1,000 user months — — —
Utilization per 1,000 eligible months — — —
Other hospital outpatient services Comparison group
% with use
23.9 23.7 24.7
Utilization per 1,000 user months — — —
Utilization per 1,000 eligible months — — —
— = data not available. E&M = evaluation and management; OT = occupational therapy, PT = physical therapy, ST = speech therapy.
1
Includes acute admissions, inpatient rehabilitation, and long-term care hospital admissions.
SOURCE: RTI International analysis of Medicare data.

C-7
Table C-2
Quality of care and care coordination outcomes for the South Carolina demonstration eligible beneficiaries and comparison
groups
Quality and care coordination
measures
Group
Predemonstration
year 1
Predemonstration
year 2
Demonstration
year 1
30-day all-cause risk-standardized
readmission rate (%)
Demonstration group 21.8 22.8 23.3
Comparison group 20.3 21.5 23.3
Preventable ER visits per eligible month Demonstration group 0.033 0.034 0.035
Comparison group 0.037 0.039 0.041
Rate of 30-day follow-up after
hospitalization for mental illness (%)
Demonstration group 34.9 36.9 26.8
Comparison group 29.3 30.4 27.3
Ambulatory care sensitive condition
admissions per eligible month—overall
composite (AHRQ PQI # 90)
Demonstration group 0.009 0.008 0.008
Comparison group 0.009 0.009 0.010
Ambulatory care sensitive condition
admissions per eligible month—chronic
composite (AHRQ PQI # 92)
Demonstration group 0.005 0.005 0.005
Comparison group 0.005 0.005 0.006
Screening for clinical depression per
eligible month
Demonstration group 0.000 0.001 0.002
Comparison group 0.000 0.001 0.002
Pneumococcal vaccination for patients
age 65 and older per eligible month
Demonstration group 0.003 0.006 0.008
Comparison group
0.013 0.014 0.014
AHRQ PQI =Agency for Healthcare Research and Quality Prevention Quality Indicator; ER = emergency room.
NOTES: The last quarter of demonstration year 1 (October–December 2015) was the first quarter of the switch from ICD9 to ICD10 codes. Some differences
between demonstration year 1 and the predemonstration period may have resulted from misalignment of ICD9 and ICD10 codes.
SOURCE: RTI International analysis of Medicare data.
C-8
Table C-3
Minimum Data Set long-stay nursing facility utilization and characteristics at admission for the
South Carolina demonstration eligible beneficiaries and comparison groups
Measures by setting Group
Predemonstration
year 1
Predemonstration
year 2
Demonstration
year 1
Annual nursing facility utilization
Number of demonstration eligible beneficiaries Demonstration group 23,257 21,345 20,485
New long-stay nursing facility admissions per 1,000
eligible beneficiaries
10.7 10.6 17.9
Number of comparison beneficiaries Comparison group 30,481 30,016 26,408
New long-stay nursing facility admissions per 1,000
eligible beneficiaries
16.4 17.2 23.4
Number of demonstration eligible beneficiaries Demonstration group 23,341 21,433 21,273
Long-stay nursing facility users as % of eligible
beneficiaries
1.4 1.3 2.7
Number of comparison beneficiaries Comparison group 30,729 30,262 27,287
Long-stay nursing facility users as % of eligible
beneficiaries
2.4 2.3 3.5
Characteristics of new long-stay nursing facility
residents at admission
Number of admitted demonstration beneficiaries Demonstration group 248 226 367
Number of admitted comparison beneficiaries Comparison group 500 516 618
Functional status (RUG-IV ADL scale) Demonstration group 8.5 8.6 8.1
Functional status (RUG-IV ADL scale) Comparison group 8.6 8.7 8.7
Percent with severe cognitive impairment Demonstration group 51 51.3 42.1
Percent with severe cognitive impairment Comparison group 43.4 45 42.4
Percent with low level of care need Demonstration group 0.6 1.4 2
Percent with low level of care need Comparison group 1.4 2.8 1.2
RUG-IV ADL = Resource Utilization Group IV Activities of Daily Living.
SOURCE: RTI International analysis of Minimum Data Set data.

C-9
Table C-4
Proportion and utilization for institutional and non-institutional services for the South
Carolina demonstration enrollees and non-enrollees
Measures by setting Group Demonstration year 1
Number of enrollees 10,673
Number of non-enrollees 17,332
Institutional setting
Inpatient admissions
1
Enrollees
% with use 2.6
Utilization per 1,000 user months 1,117.0
Utilization per 1,000 eligible months 29.6
Inpatient admissions
1
Non-enrollees
% with use 3.8
Utilization per 1,000 user months 1,143.6
Utilization per 1,000 eligible months 43.1
Inpatient psychiatric Enrollees
% with use 0.1
Utilization per 1,000 user months 1,070.9
Utilization per 1,000 eligible months 0.7
Inpatient psychiatric Non-enrollees
% with use 0.1
Utilization per 1,000 user months 1,044.9
Utilization per 1,000 eligible months 0.7
Inpatient non-psychiatric Enrollees
% with use 2.6
Utilization per 1,000 user months 1,115.4
Utilization per 1,000 eligible months 28.8
Inpatient non-psychiatric Non-enrollees
% with use 3.7
Utilization per 1,000 user months 1,142.0
Utilization per 1,000 eligible months 42.4
Emergency department use (non-admit) Enrollees
% with use 5.7
Utilization per 1,000 user months 1,200.7
Utilization per 1,000 eligible months 68.2
Emergency department use (non-admit) Non-enrollees
% with use 5.9
Utilization per 1,000 user months 1,209.7
Utilization per 1,000 eligible months 71.2
(continued)

C-10
Table C-4 (continued)
Proportion and utilization for institutional and non-institutional services for the South
Carolina demonstration enrollees and non-enrollees
Measures by setting Group Demonstration year 1
Emergency department use (psychiatric) Enrollees
% with use 0.2
Utilization per 1,000 user months 1,087.8
Utilization per 1,000 eligible months 1.9
Emergency department use (psychiatric) Non-enrollees
% with use 0.2
Utilization per 1,000 user months 1,140.5
Utilization per 1,000 eligible months 2.4
Observation stays Enrollees
% with use 0.6
Utilization per 1,000 user months 1,047.3
Utilization per 1,000 eligible months 6.7
Observation stays Non-enrollees
% with use 0.7
Utilization per 1,000 user months 1,018.8
Utilization per 1,000 eligible months 7.6
Skilled nursing facility Enrollees
% with use 0.5
Utilization per 1,000 user months 1,046.2
Utilization per 1,000 eligible months 5.4
Skilled nursing facility Non-enrollees
% with use 1.0
Utilization per 1,000 user months 1,087.7
Utilization per 1,000 eligible months 11.0
Hospice Enrollees
% with use 0.6
Utilization per 1,000 user months 1,036.4
Utilization per 1,000 eligible months 6.4
Hospice Non-enrollees
% with use 1.4
Utilization per 1,000 user months 1,028.7
Utilization per 1,000 eligible months 14.7
(continued)

C-11
Table C-4 (continued)
Proportion and utilization for institutional and non-institutional services for the South
Carolina demonstration enrollees and non-enrollees
Measures by setting Group Demonstration year 1
Non-institutional setting
Primary care E&M visits Enrollees
% with use 44.8
Utilization per 1,000 user months 1,690.5
Utilization per 1,000 eligible months 757.7
Primary care E&M visits Non-enrollees
% with use 47.4
Utilization per 1,000 user months 1,687.4
Utilization per 1,000 eligible months 799.4
Outpatient Therapy (PT, OT, ST) Enrollees
% with use 1.2
Utilization per 1,000 user months 12,308.9
Utilization per 1,000 eligible months 150.9
Outpatient therapy (PT, OT, ST) Non-enrollees
% with use 1.9
Utilization per 1,000 user months 17,191.3
Utilization per 1,000 eligible months 322
Independent therapy (PT, OT, ST) Enrollees
% with use 0.6
Utilization per 1,000 user months 14,222.5
Utilization per 1,000 eligible months 91.5
Independent therapy (PT, OT, ST) Non-enrollees
% with use 0.8
Utilization per 1,000 user months 14,629.5
Utilization per 1,000 eligible months 110.9
Other hospital outpatient services Enrollees
% with use 23.1
Utilization per 1,000 user months —
Utilization per 1,000 eligible months —
Other hospital outpatient services Non-enrollees
% with use 25.6
Utilization per 1,000 user months —
Utilization per 1,000 eligible months —
— = data not available. E&M = evaluation and management; OT = occupational therapy; PT = physical therapy;
ST = speech therapy.
1
Includes acute admissions, inpatient rehabilitation, and long-term care hospital admissions.
SOURCE: RTI International analysis of Medicare data.

C-12
Table C-5
Quality of care and care coordination outcomes for the South Carolina demonstration
enrollees and non-enrollees
Quality and care coordination measures Group Demonstration year 1
30-day all-cause risk-standardized readmission rate (%) Enrollees 18.8
Non-enrollees 25.7
Preventable emergency room visits per eligible month Enrollees 0.032
Non-enrollees 0.035
Rate of 30-day follow-up after hospitalization for mental
illness (%)
Enrollees 25.9
Non-enrollees 26.9
Ambulatory care sensitive condition (ACSC) admissions
per eligible month—overall composite (AHRQ PQI # 90) Enrollees 0.007
Non-enrollees 0.008
Ambulatory care sensitive condition (ACSC) admissions
per eligible month—chronic composite (AHRQ PQI # 92) Enrollees 0.004
Non-enrollees 0.005
Screening for clinical depression per eligible month Enrollees 0.001
Non-enrollees 0.002
Pneumococcal vaccination for patients age 65 and older per
eligible month Enrollees 0.003
Non-enrollees 0.008
AHRQ PQI =Agency for Healthcare Research and Quality Prevention Quality Indicator; ER = emergency room.
SOURCE: RTI International analysis of Medicare data.
D-1
Appendix D:
Sensitivity Analysis Tables
Tables in Appendix D present results from sensitivity analyses focusing on the South
Carolina demonstration cost saving models.
D.1 Predicting Capitated Rates for Non-Enrollees
The goal of this analysis was to identify beneficiaries eligible for the South Carolina
demonstration in the first demonstration period (February 2015–December 2016) and to look at
what the capitation rate would have been (had they enrolled) compared to their actual fee-for-
service (FFS) expenditures in the demonstration period.
D.1.1 Sample Identification
• Eligible but non-enrolled South Carolina beneficiaries in demonstration period 1
(February 1, 2015–December 31, 2016). Predicted capitated rates were calculated
using the beneficiary risk score and the county of residence.
D.1.2 Calculating the Capitated Rate for Eligible by Non-Enrolled Beneficiaries
• Predicted capitated rates were calculated using the monthly beneficiary risk score
(final resolved) and the base rate associated with the beneficiary’s county of
residence.
• Mean predicted capitated rates were compared to mean FFS expenditures. Note that
bad debt was removed from the capitated rate as this is not reflected in FFS payments.
Sequestration was reflected in both the FFS payments and the capitated payment.
Disproportionate share hospital payments and uncompensated care payment amounts
were included in the FFS expenditures, as these amounts are reflected in the capitated
rates.
• The predicted capitated rate was $1,107.7 compared to actual FFS expenditures of
$979.8 suggesting potential Medicare dissavings for the non-enrolled beneficiary
population had this population been enrolled during demonstration period 1
(Table D-1).

D-2
Table D-1
Observed FFS and predicted capitated rates for eligible but not enrolled beneficiaries
Variable Obs Mean Std. err. Std. dev. [95% conf. interval]
Predicted cap 308,555 $1,107.7 $1.6 $888.6 $1,104.5 $1,110.8
Observed FFS 308,555 $979.8 $7.5 $4,167.2 $965.1 $994.5
Difference 308,555 $127.8 $7.4 $4,095.2 $113.4 $142.3
FFS = fee for service.
NOTES: RTI also tested the accuracy of the predicted capitated rate by generating a predicted capitated rate for
enrollees and comparing it to the actual capitated rate from the plan payment files. RTI’s mean predicted capitated
rate for enrollees was $1,118.5 compared to an actual capitated rate of $1,108.1 (difference of −$10.4). Observed
FFS and predicted capitated values reflect parallel adjustments.
D.2 Predicting FFS Expenditures for Enrollees
The goal of this analysis is the converse of what is presented in Analysis D.1. Here, we
look at predicted FFS expenditures for enrollees based on a model predicting FFS expenditures
for non-enrollees.
D.2.1 Methods
A data set with observations from predemonstration year 2 and from demonstration year
1 was created from the full data set to allow us to look at expenditures between the two periods.
Beneficiary expenditures were summed across all months of each period and then “annualized”
to represent the full 12 months of base year 2 (or 23 months of demonstration year 1).
The estimation process involved two steps. First, using non-enrollees, we regressed
demonstration year 1 expenditures on base year 2 expenditures, base year 2 Hierarchical
Condition Category (HCC) score, and a set of base year 2 demographic and area-level variables.
We used an unlogged dependent variable and ran ordinary least squares (OLS) models with and
without propensity score weights (using the frozen HCC scores in the composition of the
weights). The data were clustered by Federal Information Processing Standards (FIPS) code.
This model explained 10.7 percent of the variation in expenditures for non-enrollees.
In the second step, we used the covariate values for demonstration enrollees estimated in
the OLS non-enrollee model (from step 1) to calculate predicted expenditures for enrollees. We
compared the predicted expenditure values for enrollees to the actual capitated payments made
under the demonstration.
D.2.2 Results
Table D-2 shows enrollees had lower expenditures in base year 2 ($711 for enrollees vs.
$1,084 for non-enrollees) and a lower mean HCC score (1.191 for enrollees vs. 1.303 for non-
enrollees).

D-3
Table D-2
Mean values of model covariates by group
Covariate
Eligible but not enrolled
(N= 11,961)
Enrolled
(N = 9,543)
Average monthly FFS expenditures in demo year 1 $1,782 N/A
Average monthly capitated payment demo year 1 $1,084 $711
Average monthly FFS expenditures in predemonstration
year 2 N/A $1,355
HCC Health Risk Score 1.303 1.191
Age 75.249 74.994
Also in another CMS demonstration 0.183 0.165
Female 0.705 0.706
Black 0.467 0.502
Asian 0.015 0.022
Other 0.006 0.006
Hispanic 0.012 0.017
ESRD 0.002 0.000
Disabled 0.102 0.097
Patient care physicians per 1,000 population 0.630 0.650
% of households w/ member >= 60 yrs. 38.953 39.129
% of households w/ member < 18 yrs. 31.477 31.305
% college education 16.211 15.981
% unemployed 6.161 6.330
% with self-care limitation 10.955 10.880
Fraction of duals with Medicaid managed care, ages 19 0.002 0.002
Medicare Advantage penetration rate, all enrl 0.191 0.193
% of pop. living in married household 63.231 62.792
Population per square mile, all ages 151.918 156.896
Medicaid spending per dual, ages 19+ 8,908.256 $8,971
Medicare spending per dual, ages 19+ $16,381 $16,416
Fraction of duals using nursing facilities, ages 65+ $0 0.154
Fraction of duals using personal care, ages 65+ 0.138 0.140
Distance to nearest hospital (miles) 10.666 10.663
Distance to nearest nursing home (miles) 8.212 8.328
ESRD = end-stage renal disease; HCC = Hierarchical Condition Category; FFS = fee for service.
SOURCE: RTI Program: predicting FFS_SC: Summary statistics: mean by categories of: enrollee
Table D-3 shows that actual capitated payments for enrollees were, on average, $256 per
month lower than the predicted mean expenditures for enrollees in demonstration year 1
suggesting Medicare savings under the capitated Medicare rates for the enrolled population
compared to the predicted FFS expenditures for this same population had they not been enrolled

D-4
during demonstration period 1. Mean predicted expenditures for enrollees were $171 per month
lower than actual expenditures for non-enrollees (not shown).
Table D-3
Expenditure prediction results from an unweighted OLS model
Enrollee observations = 9,543
Mean expenditures over the first year of
the demonstration (23 months)
95% confidence interval
Predicted FFS for enrollees $37,049 ($36,643, $37,456)
Actual PMPM for enrollees $31,162 ($30,674, $31,649)
Difference $5,888
($255.99 per month)
($5,451, $6,325)
p-value = 0.0000
FFS = fee for service; OLS = ordinary least squares; PMPM = per member per month.
SOURCE: RTI program: predictingFFS_SC unweighted FFS3a
D.3 Enrollee Subgroup Analyses
The enrollee subgroup analyses focused on a subgroup of beneficiaries identified as
enrolled for at least 3 months in the demonstration period and with at least 3 months of baseline
eligibility. Note that a subset of the comparison group developed for the ITT analysis was used
in the enrollee subgroup analyses. Comparison group beneficiaries used in the enrollee subgroup
analyses were required to have at least 3 months of eligibility in the demonstration period
(February 1, 2015–December 31, 2016) and at least 3 months of eligibility in the
predemonstration period (February 1, 2013–January 31, 2015), analogous to the criteria for
identifying enrollees. The results in Tables D-4 and D-5 indicate additional demonstration year
one costs associated with enrollees. The enrollee subgroup analyses are limited by the absence of
person-level data on characteristics that potentially would lead an individual in a comparison
area to enroll in a similar demonstration, and thus the results should be considered in the context
of this limitation.
Table D-4
South Carolina demonstration, mean monthly Medicare expenditures, revised enrollee
subgroup analysis, predemonstration period and demonstration period 1, weighted
Group
Predemonstration period
February 2013–January
2015
Demonstration period 1
February 2015–December
2016 Difference
Demonstration group $628.45
($601.24, $655.66)
$971.65
($942.38, $1,000.92)
$343.20
($316.62, $369.78)
Comparison group $718.42
($687.57, $749.27)
$979.35
($936.61, $1,022.08)
$260.92
($233.50, $288.34)
Difference-in-difference — — $82.28
($44.53, $120.03)
— = data not available.
SOURCE: RTI Analysis of South Carolina demonstration eligible and comparison group Medicare data (program:
Cap Savings Calculation/lgs_sccs510_log).

D-5
Table D-5
Demonstration effects on Medicare savings, revised enrollee subgroup analysis, DinD
regression results, South Carolina demonstration (weighted)
Covariate
Adjusted
coefficient DinD
p-value
95% confidence
interval
90% confidence
interval
Intervention*Demo Period
(February 2015–December 2016)
115.86 >0.000 (74.31, 157.42) (80.99, 150.74)
NOTE: Adjusted coefficient greater than zero are not indicative of Medicare savings.
SOURCE: RTI Analysis of South Carolina demonstration eligible and comparison group Medicare data (program:
Cap Savings Calculation/ lgs_sccs510_log).
D-6
[This page intentionally left blank.]

E-1
Appendix E:
Summary of Predemonstration and Demonstration Design Features
for Medicare and Medicaid Beneficiaries in South Carolina
Key features Predemonstration Demonstration
Summary of covered benefits
Medicare
Medicare Parts, A, B, and D
Medicare Parts A, B, and D
Medicaid
Medicaid State Plan services and
9 HCBS waivers
Medicaid State Plan services and 3 HCBS
waivers
Payment method
(capitated/FFS/MFFS)
Medicare
FFS or capitated
Capitated
Medicaid (capitated or FFS)
Primary/medical
FFS
Capitated
Behavioral health
FFS Capitated
LTSS (excluding HCBS
waiver services)
FFS Capitated
HCBS waiver services
FFS
Capitated for 3 HCBS waivers included in the
demonstration: Community Choices, HIV/AIDS,
and Mechanical Ventilation Dependent waivers.
Care coordination/case
management
Care coordination for
medical, behavioral health, or
LTSS and by whom
N/A
All enrollees will receive care coordination of all
medical and behavioral health services,
preventive services, medications, LTSS, social
supports, and enhanced benefits as needed.
Care coordination/case
management for HCBS
waivers and by whom
Case management for waiver
enrollees, including those in the
three waivers in the
demonstration, is provided by the
State or State-contracted
agencies.
For enrollees in the Community Choices,
HIV/AIDS, or Mechanical Ventilation
Dependent waivers, MMPs match intensity of
care coordination, frequency, and mode of
interaction to enrollee’s complexity, needs, and
preferences.
Enrollment/assignment
Enrollment method
N/A
Beneficiaries may choose to join a MMP, or opt
out of the demonstration and remain in FFS or
their existing plans. Those who do not opt out or
select a MMP are passively enrolled in the
demonstration and can change MMPs or opt out
of the demonstration on a monthly basis.
Attribution/assignment
method
N/A
Beneficiaries who do not opt out or choose a
MMP during opt-in or passive enrollment are
assigned to an MMP through an intelligent
assignment algorithm. Enrollees may change
MMPs monthly.
(continued)

E-2
Key features Predemonstration Demonstration
Implementation
Geographic area
N/A
Statewide
Phase-in plan
N/A
The first effective date for opt-in enrollments
in all regions for all eligible beneficiaries,
including those receiving HCBS waiver
services was February 1, 2015. The first wave
of passive enrollment was April 1, 2016 for
eligible beneficiaries in the upstate region. The
second wave of passive enrollment included
beneficiaries in the coastal region and those
receiving services through any of the 3 HCBS
waivers included in the demonstration, and
occurred on July 1, 2016. Beneficiaries who
require Part D reassignment were passively
enrolled January 1, 2017.
Implementation date
N/A
MMPs began providing coverage for enrollees
on February 1, 2015.
MMP = Medicare-Medicaid Plan; FFS = fee-for-service; HCBS = home and community-based services; LTSS =
long-term services and supports; N/A = not applicable.
