
1 of 7
Chlorophyte microalgae are important primary producers present
in virtually every photic habitat, including marine, freshwater, hy-
dro-terrestrial, and terrestrial environments (Domozych et al.,
2012). Microalgae have developed physiological and morpho-
logical adaptations to survive in the low humidity, high light, and
uctuating temperatures characteristic of terrestrial environments,
including those of extreme habitats such as deserts, alpine areas,
and polar regions. is naturally occurring diversity, together with
suitability for year-round culturing, has placed green microalgae at
the forefront of applied research (Metting, 1996) in elds includ-
ing bioremediation (Ji etal., 2013), CO
2
sequestration (Cheah etal.,
2015), heavy metal accumulation (Peña-Castro etal., 2004), biofuels
(Brennan and Owende, 2010), biohydrogen (Nagarajan etal., 2017),
fertilizers (Renuka etal., 2018), and high-value food supplements
and cosmetics (Borowitzka, 2013).
Applied research on microalgae has beneted from our in-
creased knowledge of algal genomics, beginning with the publica-
tion of the rst annotated green algal genomes of Ostreococcus tauri
C. Courties & M.-J. Chrétiennot-Dinet (Derelle etal., 2006) and
Chlamydomonas reinhardtii P. A. Dang. (Merchant etal., 2007) just
over a decade ago. Since then, more than 114 green algal genomes
have become available in the National Center for Biotechnology
Information (NCBI) assembly database (https://www.ncbi.nlm.
nih.gov/assem bly/ query “Chlorophyta” [Organism], consulted
February 2020). is rapid growth was possible because of the
reduction in costs and the development of third-generation
high-throughput sequencing technologies, such as SMRT sequenc-
ing (PacBio, Pacic Biosciences, Menlo Park, California, USA)
and nanopore (Oxford Nanopore Technologies, Oxford, United
Kingdom). ese long-read technologies bypass several of the chal-
lenges in assembling green algal genomes, including co-occurring
bacterial sequences; the presence of nuclear, mitochondrial, and
chloroplast DNA; and high GC content (Blaby etal., 2014). Instead
of relying on assemblies, long reads span through repetitive regions
and low-complexity genomic regions. Long reads, which are able
to resolve complete bacterial genomes in a few reads, are also es-
sential for identifying horizontal gene transfer events in eukaryote
genomes.
Applications in Plant Sciences 2020 8(3): e11333; http://www.wileyonlinelibrary.com/journal/AppsPlantSci © 2020 Stark etal. Applications in Plant Sciences is
published by Wiley Periodicals, Inc. on behalf of the Botanical Society of America. This is an open access article under the terms of the Creative Commons
Attribution-NonCommercial License, which permits use, distribution and reproduction in any medium, provided the original work is properly cited and is
not used for commercial purposes.
Extraction of high-quality, high-molecular-weight DNA
depends heavily on cell homogenization methods in green
microalgae
Jordan R. Stark
1
, Zoe G. Cardon
1
, and Elena L. Peredo
1,2
PROTOCOL NOTE
Manuscript received 30 May 2019; revision accepted
8 November 2019.
1
Ecosystems Center,Marine Biological Laboratory, 7 MBL Street,
Woods Hole, Massachusetts 02543, USA
2
Author for correspondence: el[email protected]
Citation: Stark, J. R., Z. G. Cardon, and E. L. Peredo. 2020.
Extraction of high-quality, high-molecular-weight DNA depends
heavily on cell homogenization methods in green microalgae.
Applications in Plant Sciences 8(3): e11333.
doi:10.1002/aps3.11333
PREMISE: New sequencing technologies have facilitated genomic studies in green microalgae;
however, extracting high-quality DNA is often a bottleneck for long-read sequencing.
METHODS AND RESULTS: Here, we present a low-cost, highly transferrable method for the
extraction of high-molecular-weight (HMW), high-purity DNA from microalgae. We rst
determined the eect of sample preparation on DNA quality using three homogenization
methods: manual grinding using a mini-pestle, automatic grinding using a vortex adapter,
and grinding in liquid nitrogen. We demonstrated the versatility of grinding in liquid nitrogen
followed by a modied cetyltrimethylammonium bromide (CTAB) extraction across a suite
of aquatic- and desert-evolved algal taxa. Finally, we tested the protocol's robustness by
doubling the input material to increase yield, producing per sample up to 20 μg of high-
purity DNA longer than 21.2 kbp.
CONCLUSIONS: All homogenization methods produced DNA within acceptable parameters
for purity, but only liquid nitrogen grinding resulted in HMW DNA. The optimization of cell
lysis while minimizing DNA shearing is therefore crucial for the isolation of DNA for long-read
genomic sequencing because template DNA length strongly aects read output and length.
KEY WORDS DNA integrity; long-read sequencing; modied CTAB extraction;
Scenedesmaceae.
Applications in Plant Sciences 2020 8(3): e11333 Stark etal.—High-molecular-weight DNA extraction in microalgae • 2 of 7
http://www.wileyonlinelibrary.com/journal/AppsPlantSci © 2020 Stark etal.
Long-read sequencing technologies require large quanti-
ties (1 μg to 15 μg, depending on the platform and desired read
length; https://nanop orete ch.com/produ cts/kits, https://www.
pacb.com/wp-conte nt/uploa ds/SMRTb ell-Libra ry-Prepa ratio n-
for-High-Fidel ity-Long-Read-Seque ncing -Custo mer-Train ing.
pdf) of high-purity, high-molecular-weight (HMW) DNA (Rhoads
and Au, 2015). ese concentrations of HMW DNA can be partic-
ularly challenging to obtain from green microalgae. Microalgal cells
are usually small (oen <10 μm), have rigid cell walls, and are rich
in compounds such as chlorophyll a and b, xanthophylls, beta caro-
tene, starch, and cellulose (Lewis and McCourt, 2004), which deeply
inuence the DNA extraction process, aecting cell lysis and down-
stream applications such as PCR amplication (Eland etal., 2012;
Greco etal., 2014). e extraction of DNA from terrestrial algae,
and especially desert-evolved taxa, is notoriously dicult, likely due
to the development of enlarged cell walls during their adaptation to
terrestrial environments (Cardon etal., 2008).
Traditionally, methods to improve the quality of extracted ge-
nomic DNA have focused on purity and yield, as these parameters
have the most impact in the success of downstream applications
(hybridization, PCR, activities of restriction enzymes). e purity
of samples can be increased by ne-tuning extraction protocols
based on the cetyltrimethylammonium bromide (CTAB) extraction
method (Doyle and Doyle, 1987) or by selecting species-appropriate
extraction buers (Tear etal., 2013). Several commercially available
kits using proprietary buers or columns have also been developed
to address the diculty in isolating high-purity DNA from plants
including green microalgae (Eland etal., 2012). Yields can be in-
creased by using maxi-prep approaches, by modifying the amount
of input material, and by using commercial kits; however, these
methods may require specialized equipment not present in every
laboratory (such as refrigerated ultracentrifuges) and can become
increasingly expensive. Another successful and popular approach
for increasing yield is to use strong cell and tissue homogenization
methods such as those based on agitation with microbeads (Fawley
and Fawley, 2004). Automated homogenization has become a stan-
dard step in DNA extraction protocols coupled with second-gen-
eration sequencing platforms, characterized by read sizes under 1
kbp (454 sequencing, Roche, Basel, Switzerland; SOLiD, Illumina,
San Diego, California, USA); however, bead-based homogenization
methods mechanically damage DNA. e resulting low-molecu-
lar-weight DNA is not suitable for third-generation sequencing plat-
forms (Gumińska etal., 2018) unless post-extraction size selection
steps are completed (e.g., dedicated magnetic bead kits or gel-based
systems such as BluePippin [Sage Science, Beverly, Massachusetts,
USA]).
Here, we present a low-cost, highly scalable DNA extraction
protocol specically designed for extracting high-quality, HMW
DNA suitable for use with next-generation long-read sequencing
technologies. Our approach, which we successfully demonstrate in
a variety of green microalgae, optimizes cell lysis to increase yields
while maintaining DNA integrity. First, we compared three meth-
ods for homogenizing and disrupting microalgal cells prior to DNA
extraction, with the aim of maximizing the yield of HMW DNA
without compromising purity. en, we validated the suitability
of our extraction method for application to a broad range of taxa.
We tested the method in a suite of green microalgae within the
Scenedesmaceae (Chlorophyta), which have specialized physiolo-
gies resulting from adaptation to the drastically dierent habitats
of freshwater environments and desert soils. Finally, we veried the
scalability of the method by evaluating the eect of increasing the
initial material input on quality parameters.
METHODS AND RESULTS
Microalgal strains
• Enallax costatus (Schmidle) Pascher, 1943 (isolate CCAP276-31
from the Culture Collection of Algae and Protozoa)
• Tetradesmus obliquus (Turpin) M. J. Wynne, 2016 (isolate Utex
72 from the University of Texas Culture Collection)
• Acutodesmus deserticola (L. A. Lewis & Flechtner ex E. Hegewald,
C. Bock & Krienitz) E. Hegewald, C. Bock & Krienitz, 2013 (iso-
late BCP-SNI-2 from L. Lewis, University of Connecticut)
• Flechtneria rotunda Sciuto & L. A. Lewis, 2015 (isolate BCP-
SEV3-VF49 from L. Lewis, University of Connecticut)
Culturing techniques
Two aquatic (E. costatus and T. obliquus) and two terrestrial (A. de-
serticola and F. rotunda) microalgal species were cultured in 150 mL
of growth medium composed of a 1:1 mix of Bold’s Basal Medium
with micronutrients (Bold, 1949) and Woods Hole Medium (Stein
etal., 1973). All algal cultures were non-axenic monoisolates. All cul-
turing procedures were carried out under sterile conditions. e cul-
tures were grown in 250-mL Erlenmeyer asks at 25°C in a Conviron
PGW36DE growth chamber (Conviron, Winnipeg, Canada) under a
12-h/12-h light/dark photoperiod and 40 μE light from metal halide
and sodium lamps. e cultures were constantly bubbled with am-
bient air. Fresh medium was added every week by allowing the cells
to settle and replacing half of the supernatant (~75 mL) with fresh
medium to sustain high rates of cellular division (Fig.1A). e algal
cultures were grown for six weeks before the DNA extractions.
Cell collection and culture preconditioning
For each algal species and ask, we harvested the cells from the
150-mL culture. We adjusted cultures to a density of ~10
7
cells
mL
−1
(determined using a Biotek Synergy HT plate reader; BioTek
Instruments, Winooski, Vermont, USA). Algal cells were allowed to
settle and the clear supernatant was poured o. e concentrated al-
gal culture was transferred into a 15-mL Falcon tube, where the cells
were further concentrated by gravity into a nal volume of approxi-
mately 2–3 mL. e remaining supernatant was removed, and 500μL
of each highly concentrated culture were transferred into Eppendorf
tubes for preconditioning prior to the DNA extraction. e samples
were centrifuged for 1 min at 5000 rpm, resulting in the formation of
an algal pellet ranging in size (estimated as volume) from 50–100 μL.
A white layer of debris was observed between the algal pellet and
the supernatant. e composition of this layer was determined un-
der a microscope to be bacteria and empty cell walls (Fig.1A), which
accumulate during cellular division. ese algal species within the
Scenedesmaceae divide asexually through multiple ssion (Cardon
etal., 2018). During this process, a mother cell undergoes multi-
ple rounds of nuclear division followed by cellular division. Once
division is completed, the daughter cells are released, leaving the
empty cell wall of the mother cell behind (Fig.1A). To precondition
Applications in Plant Sciences 2020 8(3): e11333 Stark etal.—High-molecular-weight DNA extraction in microalgae • 3 of 7
http://www.wileyonlinelibrary.com/journal/AppsPlantSci © 2020 Stark etal.
the cultures prior to DNA extraction, the supernatant and this de-
bris layer were removed with a micropipette without disturbing the
pelleted cells. e algal pellets were resuspended in 1 mL of fresh
sterile medium by gently inverting the tubes. is preconditioning
process was repeated two additional times to remove additional
debris with varying centrifugation speeds (2500 rpm and again at
5000 rpm; see Appendix1 for step-by-step protocol).
Cell homogenization
For each algal species, we tested the eects of three commonly used
homogenization methods on the quality, molecular weight, and
quantity of the extracted DNA. Success in the homogenization of
cells was initially estimated by visual inspection of the treated sam-
ples under the microscope and by the presence of algal pigments
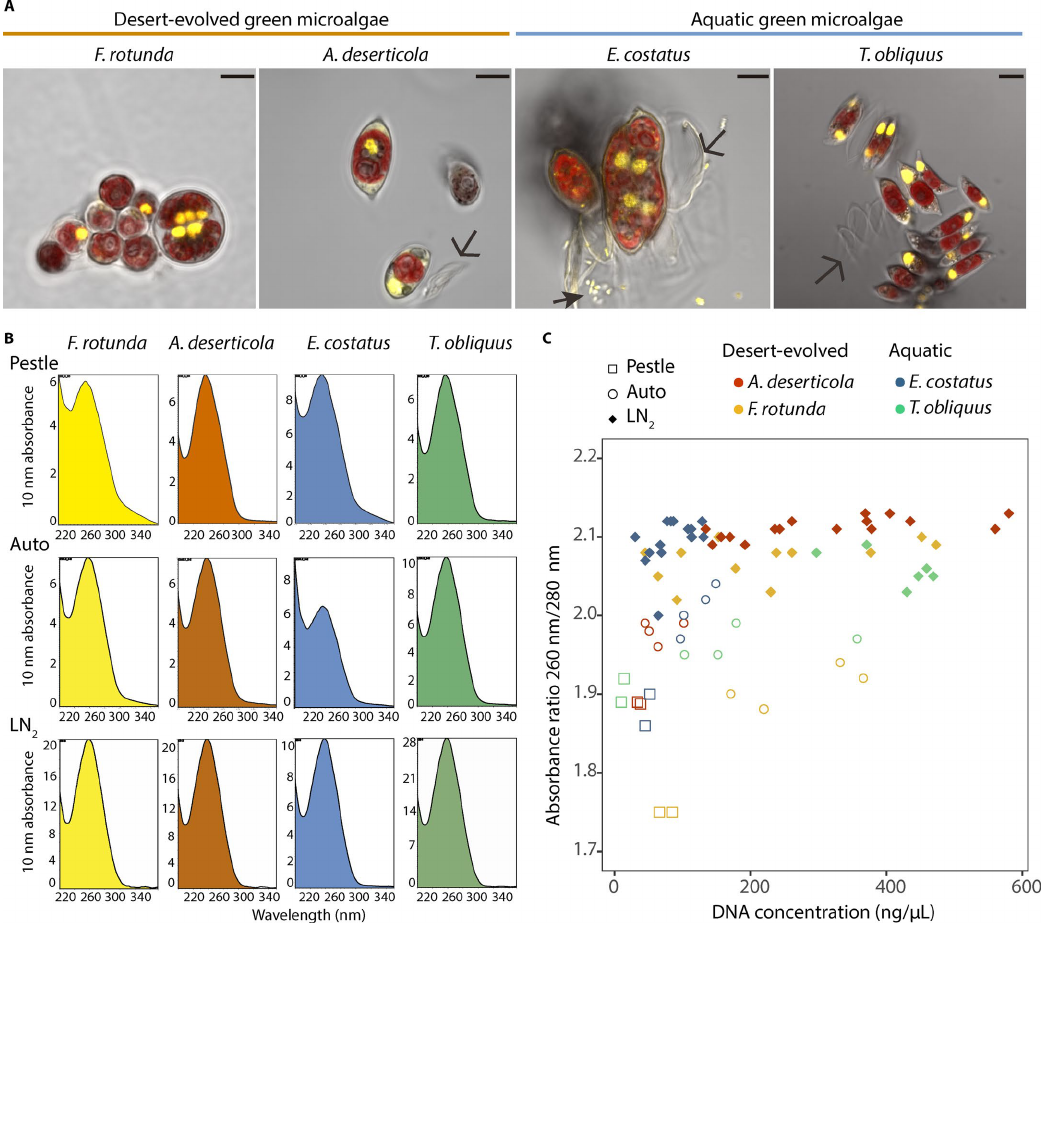
FIGURE 1. Green microalgal species used in this study and the eect of homogenization methods on the purity of their extracted DNA. (A) Laser scanning
confocal microscope images of the four microalgal species within the Scenedesmaceae used in this study. Images were captured with a 100× objective in
channel mode. The residual light was integrated to generate an optical image. The nuclei were visualized using the dsDNA stain SYBR safe (yellow, 450/50
band pass lter) and the chloroplasts’ chlorophyll uorescence (red, 595/50 band pass lter) (see Cardon etal., 2018 for details). Scale bars = 5 μm. Debris,
cell walls (open arrows), and bacteria (closed arrows) are indicated. Multinucleated cells are dividing cells. (B) Spectral patterns representing absorbance of
a given sample at dierent wave lengths (one representative NanoDrop graph per species per treatment). (C) Scatterplots representing DNA quality mea-
sured as 260 nm/280 nm absorbance ratios vs. the DNA concentration. Grinding with a mini-pestle (squares) or using an automatic vortex adapter (circles)
produced some high-purity, high-concentration samples, but overall the absorbance ratios were lower and more variable. Samples ground in liquid nitro-
gen (LN
2
; lled diamonds) had uniformly high absorbance ratios across species, even when the pellet sizes were big enough to produce >550 ng/μL DNA.
Applications in Plant Sciences 2020 8(3): e11333 Stark etal.—High-molecular-weight DNA extraction in microalgae • 4 of 7
http://www.wileyonlinelibrary.com/journal/AppsPlantSci © 2020 Stark etal.
(e.g., chlorophylls) in the extraction buer. e three homogeniza-
tion methods tested were:
Manual grinding with mini-pestles (two samples per spe-
cies)
—One scoop (~75 μL volume) of autoclaved commercial
silica sand (40–100 mesh, ACROS Organics; ermo Fisher
Scientic, Waltham, Massachusetts, USA) and 100 μL of CTAB
extraction buer (CEB-500-02; OPS Diagnostics, Lebanon, New
Jersey, USA) were added to each algal pellet in an Eppendorf
tube. Each sample was manually ground with a mini-pestle for
approximately 1 min. Resuspending the pellets in small volumes
is required during manual grinding because the cells will oat,
and therefore resuspending in large volumes would decrease the
eectiveness of the process. Aer grinding, 500 μL of CTAB sup-
plemented with 2.5% β-mercaptoethanol (BP176-100; ermo
Fisher Scientic) was added to the cells, for a nal concentration
of 2% β-mercaptoethanol.
Automatic grinding using a vortex adapter (four samples per spe-
cies)
—One scoop of autoclaved commercial silica sand and 600
μL of CTAB extraction buer supplemented with 2.5% β-mercap-
toethanol were added to each algal pellet in an Eppendorf tube.
All samples were placed in a vortex adapter (MoBio 13000-V1-24;
QIAGEN, Hilden, Germany) and vortexed at maximum speed for
5 min. To increase cell lysis, the samples were incubated in a heat
block at 55–60°C for 20 min, followed by an additional 5 min of
vortexing to ensure that enough cells were disrupted.
Grinding in liquid nitrogen (10 samples per species)—Aer pre-
conditioning, all the algal pellets from a single ask (see precon-
ditioning step) were transferred into a pre-chilled mortar using
100–1000-μL wide-bore pipette tips (tip ends were cut with a
sterile blade). If needed, a small volume of the algal medium was
added to the pellets to facilitate the transfer (<100 μL). Samples
were ash-frozen in liquid nitrogen (LN
2
), and each pellet was
continuously ground using a mini-pestle until the LN
2
had evap-
orated but the sample had not thawed. e grinding process was
repeated a total of six times, aer which all algal material had
the consistency of ne powder. e number of repetitions was
initially determined by observing the integrity of the cells under
a microscope, and it might vary for other algal taxa. A wide-bore
pipette tip was used to transfer the homogenized algal material
into a sterile Eppendorf tube and centrifuged briey to collect the
sample. No supernatant was removed at this time. e nal vol-
ume of material in each Eppendorf tube was 50–100 μL. Finally,
the samples were frozen in LN
2
and thawed at room temperature
ve times to lyse any remaining cells. e pellets were gently re-
suspended in 600 μL of CTAB extraction buer supplemented
with 2.5% β-mercaptoethanol. See Appendix1 for a detailed out-
line of this method.
DNA extraction and testing
For the DNA extraction of all samples, regardless of homogeni-
zation method, a modied CTAB extraction method (Doyle and
Doyle, 1987) was used; see Appendix1 for details. roughout the
extraction protocol, we recommend taking general precautions to
prevent additional DNA fragmentation such as minimizing vortex-
ing, gently pipetting (using wide-bore tips if possible), and avoiding
freeze-thaw cycles on extracted DNA.
e homogenized algal cells were incubated in extraction buf-
fer (CTAB supplemented with 2.5% β-mercaptoethanol) at 55–
60°C in a thermal block for 1 h. e tubes were allowed to cool
and reach room temperature; 700 μL of 25:24:1 phenol:chlo-
roform:isoamyl alcohol (IB05174; IBI Scientic, Dubuque, Iowa,
USA) was then added to each tube and briey vortexed to mix.
e samples were centrifuged at 14,000 rpm for 10 min, and the
aqueous upper phase was transferred to a new Eppendorf tube; 4
μL of RNase A (10 mg/mL) (Zymo Research, Irvine, California,
USA) was then added to each sample. e samples were incu-
bated at 37°C for 30 min in a thermal block. e samples were
again allowed to cool to room temperature before a second wash
with 700 μL of phenol: chloroform:isoamyl alcohol and cen-
trifuged. If the samples appeared visibly dirty, this cleaning step
was repeated a third time. e remaining upper aqueous phase
(~350–450 μL) was transferred to a new Eppendorf tube, and the
DNA was precipitated with ~0.1 volumes of 3 M sodium acetate
and ~0.7 volumes of cold isopropanol (Sigma-Aldrich, St. Louis,
Missouri, USA). e samples were mixed by gently inverting the
tubes. Immediately aer mixing, the DNA was easily observable
in most samples as clear, gelatinous blobs at the bottom of the
tube. e samples were stored at −20°C overnight.
Following precipitation, the DNA was pelleted by centrifug-
ing for 5 min at 14,000 rpm. e supernatant was removed, and
the DNA pellets were washed twice with 700 μL of 70% ethanol
(ermo Fisher Scientic). Aer the nal centrifugation step, the
supernatants were removed, and pellets were air-dried by inverting
the tubes on a clean paper towel. e DNA pellets were then resus-
pended in 45 μL of TE buer (ermo Fisher Scientic).
In an additional experiment focused on increasing yield, DNA
was extracted from E. costatus and A. deserticola cultures using the
LN
2
homogenization method with double the amount of starting
material (“high input”; pellets of ~200 μL). For these high-input
samples, the cells used had been previously frozen at −80°C in cul-
turing medium immediately aer collection. All other steps were
performed without change.
Yield, purity, and integrity of extracted DNA
Yield
—e DNA concentration of each sample was determined
using a Qubit dsDNA HS assay kit (ermo Fisher Scientic)
in a Qubit 2.0 uorometer (ermo Fisher Scientic). Grinding
with LN
2
produced the highest average DNA yields of the three
methods in T. obliquus (412 ng/μL) and A. deserticola (228 ng/
μL) (Table1). In F. rotunda and E. costatus, the automatic grind-
ing produced the most DNA (272 and 121 ng/μL, respectively),
followed by grinding with LN
2
(222 and 77 ng/μL, respectively)
(Table1). Grinding samples with mini-pestles resulted in the low-
est DNA concentrations in all species (12–76 ng/μL) (Table1).
e high-input samples (with approximately double the start-
ing algal material) produced higher yields; this was especially
substantial in A. deserticola, with a two-fold change in yield per
Eppendorf tube (Table1).
Purity—DNA absorbance ratios (260 nm/280 nm and 260 nm/230
nm) were determined for all samples using a NanoDrop 2000 mi-
crovolume spectrophotometer (ermo Fisher Scientic) (Fig.1B).
As a general rule, values under 1.8 of the 260 nm/280 nm ratio
indicate carry-over contamination from protein, carbohydrates,
polyphenols, or phenol that could strongly aect downstream

Applications in Plant Sciences 2020 8(3): e11333 Stark etal.—High-molecular-weight DNA extraction in microalgae • 5 of 7
http://www.wileyonlinelibrary.com/journal/AppsPlantSci © 2020 Stark etal.
applications. Values of ~1.8 are considered pure DNA, whereas
values over 1.8 can be associated with changes in nucleotide ratios,
especially increases in adenine content (chloroplast genomes, for
example, are adenine rich [Smith, 2012]), or the presence of RNA.
If present, RNA can be observed easily in agarose gels and removed
by means of additional RNase A treatment of samples followed by
ethanol precipitation. We did not observe presence of RNA when
our samples were checked on agarose gels (see Fig. 2A, C for pos-
itive and negative images of representative gels), so no additional
RNase A treatments were performed. For the 260 nm/230 nm ra-
tio, values under 2.0 indicate presence of contaminants. For all the
treatments, the 260 nm/280 nm ratios ranged between 1.8 and 2.1.
e absorbance ratios of those DNAs extracted by grinding with
mini-pestles were consistently lower (1.8–1.9) than those extracted
using automatic grinding or LN
2
(1.9–2.1) (Table1, Fig.1C). For all
species, the 260 nm/230 nm ratio was over 2 in samples homoge-
nized with LN
2
, as is recommended for long-read sequencing. In E.
costatus and F. rotunda, lower 260 nm/230 nm ratios were observed
for samples extracted using other lysis methods.
e absorbance ratios were compared across treatments using
an ANOVA performed in R (R Development Core Team, 2011)
(Table 1). When pooling all species, dierent homogenization
methods produced signicantly dierent ratios of absorbance at
260 nm/230 nm (F
2,70
= 26.88, P < 0.001) and at 260 nm/280 nm
(F
2,70
= 165.8, P < 0.001). LN
2
grinding produced the highest 260
nm/230 nm ratios for all species (1.9–2.4; see Table1), including in
those samples in which the initial amount of algal material had been
doubled (Table1).
Integrity—e molecular weight of the extracted DNA was deter-
mined by running 2 μL of each sample in 0.8% agarose gel, 1× TAE
buer (ermo Fisher Scientic) for 4 h at 60 V. e DNA was stained
with 1× SYBR safe (Invitrogen, Waltham, Massachusetts, USA). e
molecular weight of the genomic DNA was estimated by compar-
ison with a HMW DNA ladder (Lambda DNA/EcoRI+HindIII;
ermo Fisher Scientic). Digital images of the gels were gener-
ated in an Amersham 600 RGB imager (GE Healthcare, Chicago,
Illinois, USA) using automatic collection parameters. e images of
the gels were enhanced (contrast, homogenization, and background
removal) in ImageJ version 1.52a (Rasband, 2018) prior to the dig-
ital analysis. e 1D gel electrophoresis image analysis soware
GelAnalyzer2010a (www.gelan alyzer.com) was used to create pro-
les of the distribution of DNA fragments (Fig.2A, B) using the
Lambda DNA/EcoRI+HindIII DNA ladder as a size reference.
For all species, HMW DNA was exclusively observed in the DNA
samples extracted from cells homogenized using the LN
2
grinding
method. e DNA extracted using this treatment was observed as
a tight, clear band over the 21.2-kbp marker band, whereas DNA
extracted from cells homogenized using the other treatments dis-
played substantial smearing and lacked a clear HMW DNA band,
consistent with high DNA fragmentation (Fig.2).
CONCLUSIONS
Current genome sequencing protocols rely on a combined ap-
proach of short (Illumina) and long (PacBio, Nanopore) reads. e
eciency of long-read sequencing is directly impacted by the integ-
rity of the DNA used. Our results indicate that for all algal species
tested here, a modied CTAB protocol is sucient for extracting
DNA within reasonable quality parameters. However, DNA integ-
rity is strongly aected by the cellular homogenization method used
early in the extraction protocols (i.e., during the lysis step). DNA ex-
tracted using automatic or mini-pestle grinding is suitable for PCR
or short-read sequencing but not for long-read sequencing technol-
ogies. Grinding cells in LN
2
was the only homogenization method
that consistently resulted in HMW DNA.
Many potential modications to DNA extraction methods
and kits can produce acceptable results for dierent sequencing
methods; however, they can be much more expensive and less
customizable than CTAB-based extraction protocols. Our results
demonstrate that, for a diverse suite of microalgae taxa that in-
cludes aquatic species and desert-derived species with recalcitrant
characteristics for DNA extraction, sample preparation and cell ly-
sis methods were key to producing high-quality DNA. Across the
four species, uniformly good results were obtained from the CTAB
extraction aer grinding the cells in LN
2
, even though the initial
samples varied in cell size, cell wall thickness, and buoyancy. We also
TABLE 1. Quality parameters measured for DNA extracted from cells homogenized using dierent methods.
Concentration (Qubit) Purity (NanoDrop)
Integrity
(electrophoresis)
Species (habitat) Method (n) Mean (ng/μL ± SE) Total (μg)
a
260 nm/280 nm
(mean ± SE)
260 nm/230 nm
(mean ± SE)
Distribution of DNA
fragments
Enallax costatus
(aquatic)
Pestle (2) 49 ± 4 2.2 1.9 ± 0.02 1.6 ± 0.11 Broad peak
Auto (4) 121 ± 13 5.4 2.0 ± 0.01 1.2 ± 0.03 Broad peak
LN
2
(10) 77 ± 11 3.4 2.1 ± 0.01 2.2 ± 0.03 Tight peak
High input (5) 103 ± 9 4.6 2.1 ± <0.01 1.9 ± 0.02 Tight peak
Tetradesmus
obliquus
(aquatic)
Pestle (2) 12 ± 2 0.5 1.9 ± 0.02 2.1 ± 0.05 Broad peak
Auto (4) 198 ± 55 8.9 2.0 ± 0.01 2.1 ± 0.04 Broad peak
LN
2
(6) 412 ± 27 18.5 2.1 ± 0.01 2.4 ± 0.01 Tight peak
Acutodesmus
deserticola
(desert)
Pestle (2) 35 ± 1 1.5 1.9 ± <0.01 2.1 ± 0.03 Broad peak
Auto (4) 66 ± 13 2.9 2.0 ± 0.01 2.0 ± 0.04 Broad peak
LN
2
(10) 228 ± 27 10.2 2.1 ± <0.01 2.3 ± 0.01 Tight peak
High input (6) 448 ± 41 20.1 2.1 ± <0.01 2.3 ± 0.01 Tight peak
Flechtneria
rotunda (desert)
Pestle (2) 76 ± 10 3.4 1.8 ± <0.01 1.3 ± 0.03 Broad peak
Auto (4) 272 ± 46 12.2 1.9 ± 0.01 1.8 ± 0.05 Broad peak
LN
2
(12) 222 ± 42 9.9 2.1 ± 0.01 2.2 ± 0.03 Tight peak
Note: n = number of samples.
a
For each sample, the total volume was 45 μL.

Applications in Plant Sciences 2020 8(3): e11333 Stark etal.—High-molecular-weight DNA extraction in microalgae • 6 of 7
http://www.wileyonlinelibrary.com/journal/AppsPlantSci © 2020 Stark etal.
demonstrated that this method can produce up to 20 μg of DNA in
a single Eppendorf tube without sacricing purity or quality, using
fresh or frozen material.
ACKNOWLEDGMENTS
e authors thank Dr. Louise Lewis (University of Connecticut) for
providing Flechtneria rotunda and Acutodesmus deserticola, and
Suzanne omas for expert technical assistance. is work was sup-
ported by the National Science Foundation, Division of Integrative
Organismal Systems (1355085 to Z.G.C.) and an anonymous donor
(to Z.G.C.).
AUTHOR CONTRIBUTIONS
E.L.P. and Z.G.C. designed the experiments; E.L.P. and J.R.S. ac-
quired and analyzed the data; E.L.P. interpreted the data; J.R.S. and
E.L.P. wrote the manuscript; and J.R.S., Z.G.C., and E.L.P. approved
the submitted version.
LITERATURE CITED
Blaby, I. K., C. E. Blaby-Haas, N. Tourasse, E. F. Y. Hom, D. Lopez, M. Aksoy, A. R.
Grossman, etal. 2014. e Chlamydomonas genome project: A decade on.
Trends in Plant Science 19: 672–680.
Bold, H. C. 1949. e morphology of Chlamydomonas chlamydogama, sp. nov.
Bulletin of the Torrey Botanical Club 76: 101–108.
Borowitzka, M. A. 2013. High-value products from microalgae: eir devel-
opment and commercialisation. Journal of Applied Phycology 25: 743–756.
Brennan, L., and P. Owende. 2010. Biofuels from microalgae: A review of
technologies for production, processing, and extractions of biofuels and
co-products. Renewable and Sustainable Energy Reviews 14: 557–577.
Cardon, Z. G., D. W. Gray, and L. A. Lewis. 2008. e green algal underground:
Evolutionary secrets of desert cells. BioScience 58: 114–122.
Cardon, Z. G., E. L. Peredo, A. C. Dohnalkova, H. L. Gershone, and M. Bezanilla.
2018. A model suite of green algae within the Scenedesmaceae for
FIGURE 2. Eect of homogenization method on DNA integrity. (A) Gel image analysis of the DNA produced from all four species following their
cellular homogenization using liquid nitrogen (LN
2
) grinding, mini-pestle grinding, and automatic vortex grinding. The image analysis was performed
in GelAnalyzer2010a. (B) Saturation plots (% of max) for the three gel electrophoresis lanes. The results presented correspond to DNA extracted from
Flechtneria rotunda and are representative of those observed for the other taxa. Extraction following LN
2
homogenization produces a sharp peak of
DNA of over 21.2 kbp in size, whereas manual grinding with a mini-pestle and automatic vortexing methods resulted in major peaks of DNA with a
considerably lower molecular weight. The broad distribution of DNA fragments is consistent with degraded DNA. (C) Examples of multiple DNA ex-
tractions using LN
2
grinding followed by modied CTAB extraction in several green microalgae. Each lane was loaded with 2 μL of extracted DNA. In
all cases, LN
2
grinding produced a clear, high-molecular-weight band. The Tetradesmus obliquus samples had similarly sharp bands (as shown in A) but
were not included in this gel for ease of loading. For all gels, λ indicates the ladder lane (Lambda DNA/EcoRI+HindIII).
Applications in Plant Sciences 2020 8(3): e11333 Stark etal.—High-molecular-weight DNA extraction in microalgae • 7 of 7
http://www.wileyonlinelibrary.com/journal/AppsPlantSci © 2020 Stark etal.
investigating contrasting desiccation tolerance and morphology. Journal of
Cell Science 131: jcs212233.
Cheah, W. Y., P. L. Show, J. S. Chang, T. C. Ling, and J. C. Juan. 2015. Biosequestration
of atmospheric CO
2
and ue gas-containing CO
2
by microalgae. Bioresource
Technology 184: 190–201.
Derelle, E., C. Ferraz, S. Rombauts, P. Rouzé, A. Z. Worden, S. Robbens, F.
Partensky, etal. 2006. Genome analysis of the smallest free-living eukaryote
Ostreococcus tauri unveils many unique features. Proceedings of the National
Academy of Sciences, USA 103: 11647–11652.
Domozych, D. S., M. Ciancia, J. U. Fangel, M. D. Mikkelsen, P. Ulvskov, and
W. G. T. Willats. 2012. e cell walls of green algae: A journey through
evolution and diversity. Frontiers in Plant Science 3: 1–7.
Doyle, J. J., and J. L. Doyle. 1987. A rapid DNA isolation procedure for small
quantities of fresh leaf tissue. Phytochemical Bulletin 19: 11–15.
Eland, L. E., R. Davenport, and C. R. Mota. 2012. Evaluation of DNA ex-
traction methods for freshwater eukaryotic microalgae. Water Research 46:
5355–5364.
Fawley, M., and K. Fawley. 2004. A simple and rapid technique for the isolation of
DNA from microalgae. Journal of Phycology 225: 223–225.
Greco, M., C. A. Sáez, M. T. Brown, and M. B. Bitonti. 2014. A simple and eec-
tive method for high quality co-extraction of genomic DNA and total RNA
from low biomass Ectocarpus siliculosus, the model brown alga. PLoS ONE
9: e96470.
Gumińska, N., M. Płecha, H. Walkiewicz, P. Hałakuc, B. Zakryś, and R.
Milanowski. 2018. Culture purication and DNA extraction procedures
suitable for next-generation sequencing of euglenids. Journal of Applied
Phycology 30: 3541–3549.
Ji, M., R. I. Abou-Shanab, J. Hwang, T. C. Timmes, H. Kim, Y. Oh, and B. Jeon.
2013. Removal of nitrogen and phosphorus from piggery wastewater euent
using the green microalga Scenedesmus obliquus. Journal of Environmental
Engineering 139: 1198–1205.
Lewis, L. A., and R. M. McCourt. 2004. Green algae and the origin of land plants.
American Journal of Botany 91: 1535–56.
Merchant, S. S., S. Prochnik, and O. Vallon. 2007. e Chlamydomonas ge-
nome reveals the evolution of key animal and plant functions. Science 318:
245–250.
Metting, F. 1996. Biodiversity and application of microalgae. Journal of Industrial
Microbiology 17: 477–489.
Nagarajan, D., D. J. Lee, A. Kondo, and J. S. Chang. 2017. Recent insights into
biohydrogen production by microalgae: From biophotolysis to dark fermen-
tation. Bioresource Technology 227: 373–387.
Peña-Castro, J. M., F. Martínez-Jerónimo, F. Esparza-García, and R. O.
Cañizares-Villanueva. 2004. Heavy metals removal by the microalga
Scenedesmus incrassatulus in continuous cultures. Bioresource Technology
94: 219–222.
R Development Core Team. 2011. R: A language and environment for statisti-
cal computing. R Foundation for Statistical Computing, Vienna, Austria.
Website http://www.R-proje ct.org/ [accessed 13 February 2020].
Rasband, W. 2018. ImageJ [Soware]. U. S. National Institutes of Health,
Bethesda, Maryland, USA.
Renuka, N., A. Guldhe, R. Prasanna, P. Singh, and F. Bux. 2018. Microalgae as
multi-functional options in modern agriculture: Current trends, prospects
and challenges. Biotechnology Advances 36: 1255–1273.
Rhoads, A., and K. F. Au. 2015. PacBio sequencing and its applications. Genomics,
Proteomics and Bioinformatics 13: 278–289.
Smith, D. R. 2012. Updating our view of organelle genome nucleotide landscape.
Frontiers in Genetics 3: 175.
Stein, J. R., J. A. Hellebust, and J. S. Craigie [eds.]. 1973. Handbook of phyco-
logical methods: Culture methods and growth measurements. Cambridge
University Press, Cambridge, United Kingdom.
Tear, C. J. Y., C. Lim, J. Wu, and H. Zhao. 2013. Accumulated lipids rather
than the rigid cell walls impede the extraction of genetic materials
for effective colony PCRs in Chlorella vulgaris. Microbial Cell Factories
12: 106.
APPENDIX 1. DNA extraction protocol: Sample homogenization using liquid
nitrogen and modied CTAB method.
1. Preconditioning of cultures
a. Concentrate algal cultures in the minimum volume
possible and aliquot (500 μL) into Eppendorf tubes
for preconditioning
b. Centrifuge algal cells in growth medium at 5000 rpm
for 1 min
c. Carefully remove the supernatant and white interface
layer (cell walls and bacteria) with a micropipette
d. Add 1 mL of fresh sterile growth medium and resus-
pend cells
e. Centrifuge at 2500 rpm for 30 s
f. Repeat steps c–d
g. Centrifuge at 5000 rpm for 30 s
h. Repeat step c, removing as much supernatant as possible
2. Cell grinding with liquid nitrogen (LN
2
)
a. Autoclave mortar and pestle to sterilize
b. Pre-chill mortar and pestle with LN
2
c. Resuspend algal culture in as little medium as possible
(here <100 μL) and transfer to pre-chilled mortar using
a wide-bore tip (cut tip end with sharp, sterile blade)
d. Grind with pestle until LN
2
has evaporated but cells
have not thawed
e. Add a small amount of additional LN
2
f. Repeat steps d and e ve more times (cells should
look damaged under microscope)
g. Transfer algal material to Eppendorf tubes and cen-
trifuge briey to collect sample in bottom
h. Freeze and thaw (at room temperature) centrifuge
tubes ve times in LN
2
3. DNA extraction
a. Prepare extraction buer with CTAB and 2.5% β-mer-
captoethanol. Add enough CTAB- β-mercaptoethanol
to each Eppendorf tube to bring the total volume to
600 μL
b. Incubate samples at 55–60°C
c. Add 700 μL of phenol:chloroform:isoamyl alcohol
(25:24:1) and vortex for 3–5 s to mix
d. Centrifuge for 10 min at 14,000 rpm
e. Transfer aqueous phase to new sterile Eppendorf and
add 4 μL of RNase A
f. Incubate for 30 min at 37°C
g. Repeat steps b–d and transfer aqueous phase to new sterile
Eppendorf; repeat twice if samples still appear visibly dirty
h. Add 0.1 volumes of cold 3 M sodium acetate and 0.7–
0.9 volumes of cold isopropanol. Mix by inversion.
i. Precipitate overnight at −20°C
j. Centrifuge for 5 min at 14,000 rpm
k. Remove supernatant
l. Add 700 μL of cold 70% ethanol to wash DNA pellet
m. Centrifuge for 1 min at 14,000 rpm
n. Repeat steps k–m
o. Remove supernatant and invert Eppendorf tubes on a
clean paper towel to air-dry pellets
p. Resuspend in 45 μL of TE buer in refrigerator at
least overnight
