
ALASKA’S RENEWABLE
ENERGY FUTURE:
New Jobs, Aordable Energy
Developed for Regenerative Economies Working Group – Alaska Climate Alliance
FULL REPORT

[1]
Alaska’s Renewable Energy Future: New Jobs, Aordable Energy
ALASKA’S RENEWABLE ENERGY FUTURE:
New Jobs, Aordable Energy
KEY TAKEAWAYS:x
■ Alaska has a vast endowment of renewable energy resources
■ Renewable energy technology costs continue to decline, while local and global fossil fuel
costs continue to escalate
■ Renewable energy technologies are on track to aordably replace legacy fossil fuel energy
systems in the 2030-to-2050 time horizon
■ The development of Alaska’s vast renewable energy potential has the potential to generate
more than 103,554 jobs across Alaska – more than replacing the jobs lost as fossil fuels
become obsolete
■ With continued federal support, renewable hydrogen-based fuels have the potential to
replace fossil fuels in the marine and aviation sectors and form the basis of a new export
economy
Developed for: Alaska Climate Alliance – Regenerative Economies Working Group
Primary Authors
• Kay Brown, Pacific Environment
• Carly Wier, Native Movement
Prepared in collaboration with:
• Ben Boettger, Alaska Public Interest Research Group
• JackieArnaciarBoyer, Native Peoples Action
• Mark Foster, Mark A. Foster and Associates (MAFA)
• The Cadmus Group
Design
• Marianne Michalakis, designMind
Land Acknowledgement:
The authors and contributors (and readers, we hope!) of this report humbly and respectfully acknowledge that the land and
resources we are describing and analyzing are the ancestral and unceded territory of the Indigenous Peoples of Alaska.
We write this with deep gratitude to the Indigenous Peoples of Alaska for their continued care and stewardship of the
land on which we live, work and play. We acknowledge this not only in thanks to the Indigenous communities who have
held relationship with this land for generations but also in recognition of the historical and ongoing legacy of colonialism.
Additionally, we acknowledge this as a point of reflection for us all as we work towards dismantling colonial practices.
RELEASE DATE: March 21, 2022
[2]
Alaska’s Renewable Energy Future: New Jobs, Aordable Energy
Table of Contents
Executive Summary ...................................................................................................................................................4
Introduction ..................................................................................................................................................................7
Benefits of Accelerating the Transition to a Renewable Energy Future in Alaska by 2050 ............. 7
Alaska’s Energy Context ..........................................................................................................................................9
Introduction ...............................................................................................................................................................9
Alaska’s Energy Consumption .......................................................................................................................... 10
Renewables in Electricity Supply ...................................................................................................................... 12
Historic Context and Emerging Trends ........................................................................................................... 12
Declining Oil Industry ..................................................................................................................................... 12
Turnaround in Fossil Fuel Price Outlook in Alaska (2008) .................................................................. 14
Electric Power Sector ............................................................................................................................... 14
Alaska’s Unique Energy Infrastructure ...................................................................................................... 15
Employment by Major Energy Technology Application ....................................................................... 16
Employment in Electric Power Sector ........................................................................................................17
Alaska’s Shift Toward a Renewable Energy Future ..................................................................................... 18
State Renewable Energy Fund .................................................................................................................... 18
Federal $1.2 trillion Infrastructure Investment and Jobs Act ............................................................... 18
Utility Goals ....................................................................................................................................................... 18
Major Railbelt Utility Initiatives in Support of Renewable Development ......................................... 19
Utility Renewable / Energy Eciency / Building Electrification Initiatives ....................................... 19
Vast Alaska Renewable Energy Resource Opportunity .............................................................................20
Renewable Energy Technology Trends ........................................................................................................... 22
History – Rapid Reduction in Costs ................................................................................................................ 22
Onshore Wind Cost Trends .........................................................................................................................22
Oshore Wind Cost Trends ......................................................................................................................... 23
Battery Storage Cost Trends ....................................................................................................................... 24
Section summary .................................................................................................................................................. 24
Rising Cost of Fossil Fuels ................................................................................................................................... 25
Transportation Sector ......................................................................................................................................... 27
Section Summary ................................................................................................................................................. 27
Potential Paths for Renewables to Replace Fossil Fuels ........................................................................... 28
Emerging Opportunities for Decarbonization of Building and Transportation Sectors ................... 30
Building Electrification .................................................................................................................................. 30
Transportation Electrification ...................................................................................................................... 30
Green Hydrogen-Based Fuels .................................................................................................................... 31
Strategies to Accelerate the Transition to Clean Renewable Energy .................................................... 36
Conclusion ................................................................................................................................................................. 44
Endnotes .................................................................................................................................................................... 45

[3]
Alaska’s Renewable Energy Future: New Jobs, Aordable Energy
Table of Figures
Figure 1. Electric Utility Residential Rates (Ratio of selected Alaska Regions to US Weighted
Average), 2002-2020 ................................................................................................................................. 9
Figure 2. Alaska Energy Consumption Estimates by Energy Source (EIA, 2019) .....................................10
Figure 3. 2050 100% Renewable Energy Sankey Diagram ..............................................................................11
Figure 4. Alaska Energy Production & Alaska’s End-Use Energy Consumption
Comparisons, 1973-2020 .........................................................................................................................12
Figure 5. Alaska Oil & Gas Sector Average Monthly Employment (2014-2021) ........................................13
Figure 6. EIA Electric Power Sector Fossil Fuel Prices (Alaska/U.S. Price Ratio, 1970-2019) ................14
Figure 7. Alaska Electric Light & Power Residential Electric Rate Comparison –
selected Alaska Utilities (2020) ..............................................................................................................15
Figure 8. Alaska Energy Regions Map .................................................................................................................... 15
Figure 9. Alaska’s Employment by Major Energy Technology Application (2019 - 2020) .....................16
Figure 10. Alaska’s Electric Power Generation Employment (2019 – 2020) ................................................ 17
Figure 11. Alaska Renewable Energy Resource Map Compilation (2021) ....................................................21
Figure 12. Land based wind cost trajectories (NREL, 2020) ........................................................................... 22
Figure 13. Fixed bottom oshore wind cost trajectories (NREL, 2020) ........................................................23
Figure 14. Electric Power Sector Fossil Fuel Prices, Alaska to U.S. Price Ratio, 1970-2019 .................. 25
Figure 15. Cook Inlet Natural Gas Breakeven Costs for Incremental Supply ............................................ 26
Figure 16. Alaska Cook Inlet Natural Gas Prevailing Price of Utility Purchases:
History + Outlook with LNG Import Competition in 2031 & beyond ......................................... 26
Figure 17. Transportation Sector Fossil Fuels: Alaska to U.S. Price Ratio, 1970-2019 .............................. 37
Figure 18. Overall fuel-related cost components of hydrogen, ammonia and methanol .......................33
Figure 19. Geographies with combined zero-carbon resources of high capacity and low cost ..........34
Figure 20. Hydrogen demand and refueling infrastructure needed for transpacific
container ships under the full deployment scenario ......................................................................35
Figure 21. 80% Renewable Portfolio Standard (RPS) for Alaska Railbelt Electric Utilities
compared to Total Alaska Energy Consumption by Market Segment (2019 data) ...............39

[4]
Alaska’s Renewable Energy Future: New Jobs, Aordable Energy
Executive Summary
Alaska has a vast endowment of renewable energy resources that can be tapped in its transition
to a renewable energy future. Benefits of accelerating the energy transition in Alaska include
more jobs, lower energy prices, higher energy security and the potential for renewable resources
to support zero carbon hydrogen-based fuels for the aviation and maritime industries.
The state has already begun to develop its renewable energy resources and continues to support
renewable technology development for Alaska’s challenging environment. The scale of Alaska’s
vast undeveloped renewable energy resource endowment remains more than 14 times the total
U.S. energy consumption.
1
Alaska’s historically high and volatile fossil fuel-based energy costs have been moderated
by the successful development of renewable energy resources across the state, including:
• Bradley Lake & Battle Creek Diversion, Solomon Gulch, Terror Lake, Swan Lake,
Tyee Lake, and other recent hydro projects in both the Southeast and Southwest
• Fire Island, Eva Creek, Kotzebue, Kodiak & AVEC Wind
• GVEA & HEA Battery Energy Storage Systems
• GVEA Solar PV, MEA Solar PV by Independent Power Producers; with discussions
underway for a 20MW solar PV project in HEA territory
• Village scale solar PV projects in remote rural communities, e.g., Eagle, Hughes, Kaltag
• Juneau, Tok, Coman Cove, Craig, Gulkana, Elim, Thorne Bay, Haines, and Tanana
Biomass
• Chena Hot Springs Geothermal Heat and Electricity
Renewable energy technologies, including wind, solar, geothermal, and ocean and river
hydrokinetic, along with complementary energy storage technologies, are continuing to exhibit
declining costs which make them increasingly attractive as a primary energy source to substitute
for fossil fuels in the electric sector and to support the electrification of buildings and the
transformation of the transportation sector to electrification and renewable hydrogen-based fuels.
As local fossil fuel costs escalate across Alaska, from 2.5X higher in the Railbelt to as much as
4X higher in Rural Alaska (as compared to the U.S. average), renewable energy technologies are
increasingly attractive investments and are poised to aordably replace legacy fossil fuel energy
systems in the 2030-to-2050 time horizon while providing greater energy security, increased
energy resiliency especially in rural Alaska, and broad environmental, economic and health
benefits.
2
Independent studies have confirmed that the development of Alaska’s renewable energy
potential will generate thousands of jobs – at least comparable in magnitude to the fossil fuel jobs
that may be displaced by the transition to a clean renewable energy sector.
3

[5]
Alaska’s Renewable Energy Future: New Jobs, Aordable Energy
Based on adjusting a sample of independent studies for Alaska cost dierentials for renewable
resource, energy storage and zero carbon hydrogen/clean fuels infrastructure, we estimate that
by 2050, the transition to a 100% clean renewable energy future for Alaska would generate a
net increase of 67,216 jobs (103,554 additional renewable jobs minus 36,338 fossil fuel energy
related jobs lost).
4
In addition to developing renewable energy resources on the supply side, the electric sector has
opportunities to rebuild flagging electricity sales through building electrification and transformation
of the transportation sector to electric and green hydrogen-based fuels. The acceleration of the
transformation of the building heating and transportation sectors to clean renewable energy
will require a sustained federal, public, and private investment in science, technology, including
systems integrations.
Renewable hydrogen-based fuels have the potential to replace fossil fuels in the marine and
aviation sectors as renewable energy, renewable hydrogen production, storage, and hydrogen
fuel cell technologies continue to develop [see Potential Pathways for Renewables to Replace
Fossil Fuels, subsection Green Hydrogen-Based Fuels below].
Collaborative consultations with key stakeholders, including local communities, Tribes, residential
energy consumers, public and private sector energy consumers and producers (including
Alaska Native Corporations), and local utilities will be essential to ensuring long term support for
successful development of local renewable energy resources.
Key strategies for the state of Alaska to accelerate the transition to a clean, renewable energy
future include:
■ Undertake a comprehensive statewide strategic policy and planning eort, including
an explicit goal of transitioning to 100% clean renewable energy by 2050, to help focus
emerging integrated planning eorts. One potential planning mechanism is an Integrated
Resource Plan required by recent legislation establishing an Electric Reliability Organization
in the Alaskan Railbelt.
■ Enact legislation to require electric utilities to achieve 100% clean renewable energy by
2050 and to regularly measure and report progress toward that goal, including adoption of
reasonable Renewable Portfolio Standards, e.g., 80% by 2040.
5
■ Develop plans that ensure equity and aordability in clean energy, making energy transition
costs aordable for people across income scales, with programs like community solar and
on-bill financing.
■ Provide a vital round of seed funding and financing commensurate with the need to
accelerate the transition to 100% clean renewable energy by 2050.
6
o Extend the Alaska Renewable Energy Fund beyond its current sunset of 2023 and
fund it with a fresh round of $3.2 billion in “clean renewable energy” seed capital.
7
■ Encourage and support private and public sector entities that seek to develop and disclose
their environmental impacts under a credible, independent global environmental disclosure
system, e.g. CDP, formerly known as “Climate Disclosure Project.”
■ Seek Alaska Permanent Fund support for publication of environmental disclosures of its
investments to ensure portfolio investments are assessing and addressing climate risks.
8

[6]
Alaska’s Renewable Energy Future: New Jobs, Aordable Energy
■ Raise the net metering cap so utilities can enable electric customers who produce their own
electricity to receive a credit for the excess energy they transfer back to the utility and/or
change the net metering regulation so that credits generated during peak months can be
utilized in o-peak months, shifting to annual accounting of credits instead of monthly.
■ Require Regional Integrated Resource Plans include:
o Substantive opportunities for local collaboration/consultation;
o Consideration of future cost escalation associated with fossil fuel resources from
both direct and indirect costs, e.g. CO
2
equivalent emissions costs and other
environmental externalities;
9
o Explicitly require regional energy plans to include the overarching policy goal of
reaching 100% clean renewable energy for all energy needs by 2050 and include a
pathway to achieve it within their options for consideration.
■ Workforce Development:
o Incentivize industry-led training curriculum for the construction and operations of
renewable energy technologies.
o Incorporate renewable energy training curriculum into a state-certified
apprenticeship program.
o Encourage engagement of K-12 and University students in renewable energy
technology education.
To understand the history, current state, and future potential of a transition to a 100% clean,
renewable, and equitable energy future in Alaska by 2050, the authors and supporting
organizations engaged the Cadmus Group for a literature review and quantitative analysis of
existing resources and data to supplement the research and analysis developed by the working
group and its collaborators.
This report illustrates a vision for a clean renewable energy future in Alaska and the potential
benefits this increasingly urgent transition to an equitable new energy system could provide.

[7]
Alaska’s Renewable Energy Future: New Jobs, Aordable Energy
Introduction
This study looks at the potential for 100% clean renewable energy to replace fossil fuel
energy in Alaska by 2050 and its attendant benefits including more jobs, lower energy
prices, higher energy security and the potential for renewable resources to support the
equitable transition to hydrogen-based fuels for the aviation and maritime industries.
Benefits of Accelerating the Transition to a Renewable Energy
Future in Alaska by 2050
The benefits of transitioning to 100% clean renewables for all energy purposes (including
electric, building heating and transportation fuels) by 2050 include:
10
1. Creation of 67,500 more long-term, full time jobs in Alaska than lost
2. Eliminates 43 million tonnes CO
2equiv
per year in 2050 in Alaska
3. Reduces 2050 all-purpose, end-use energy requirements by roughly half
4. Reduces total annual energy, health and climate costs by 25%; from $23.2 billion to $17.3
billion per year
5. The substantial up-front investment costs, on the order of $128 billion over 30 years, can
be mitigated by federal and state co-investment.
a. Aggregate public co-investment on the order of 25% should be sucient to more
than buy down the net price of energy to be less than the superficial cash price of
the business as usual fossil fuel projection
b. The 25% public co-investment, which could be split between state and federal
consistent with the historic approach to federal highway funds, 1:9, would amount
to $3.2 billion for the State of Alaska
6. The net increase in annual investment and expenditure costs in a 100% clean renewable
energy transition by 2050 may be on the order of 0.91% of Alaska’s GDP in 2050.
11
7. Requires 0.14% of Alaska’s land for the renewable resource development
a. Including wind farms, solar arrays, geothermal power plants, electric and heat
storage infrastructure, transmission lines and substations
b. Amounts to roughly 600,000 acres which is roughly equal to the current total area
of wind farms in TX and OK
12
This report seeks to raise public awareness of positive clean renewable energy potential and
its many associated benefits so Alaskans can work together to accelerate the development of
robust renewable energy capacity, energy storage, and transmission systems that will build the
foundation for a reliable renewable energy grid system which can support:
■ Reliable electric service for local microgrid and grid interconnected communities,
■ Electrification of the building and transportation sectors, and
■ Development of clean renewable hydrogen-based transportation fuels to help sustain and
grow critical Alaska industries, including:
o Fisheries fleet and processing activities,

[8]
Alaska’s Renewable Energy Future: New Jobs, Aordable Energy
o Marine transportation, including refueling and transshipment, and
o Anchorage International Airport World Class Cargo Hub.
The Regenerative Economies Working Group of the Alaska Climate Alliance is working with a
broad coalition of entities and individuals with the goal of articulating and advancing an economic
vision for a prosperous, clean energy future for Alaska. The Alaska Climate Alliance is a group of
50+ organizations and more than 120 participants united by our desire to align Alaska’s climate
action community with Just Transition principles, addressing the climate crisis head-on at all levels
of society and shifting our state towards a joyful, interdependent and Indigenous-led future.
This report, Alaska’s Renewable Energy Future: New Jobs, Aordable Energy, showcases specific
renewable energy technologies that are ripe for development as well as the potential scale of
the renewable energy sector jobs, and recommends strategies to support Alaska’s transition to a
clean energy future.
The report is structured into the following sections:
Alaska’s Energy Context: This section details Alaska’s historic energy context, including
insights into how much energy the state consumes, how that energy has been generated,
and the jobs the energy industry has supported in the past.
Alaska’s Vast Renewable Energy Resource Endowment: Due to its unique geography,
Alaska has a vast endowment of diverse natural resources that can support a vibrant
renewable energy sector capable of scaling up to meet the state’s energy demand. The
renewable energy resources covered in this report are onshore and oshore wind, solar,
ocean and river hydrokinetic, geothermal, hydropower, biomass, and green hydrogen-
based fuels.
Renewable Energy Technology Trends: This section highlights the history and outlook for
declining costs of renewable energy and energy storage technologies that will enable an
aordable transition to a renewable energy future.
Rising Cost of Fossil Fuels: This section highlights the history and outlook for the rising
cost of fossil fuels that can be avoided by accelerating the transition to a renewable energy
future.
Potential Path for Renewables to Replace Fossil Fuels: This section highlights recent
research into potential pathways to 100% clean, renewable power across Alaska by 2050
and the benefits that can be achieved by accelerating the development of renewable
energy resources to replace fossil fuels.
Strategies to Accelerate the Renewable Energy Transition: This section describes
policy, planning, funding and financing, and workforce development initiatives aimed at
accelerating the transition to a renewable energy future.
Conclusion: This section describes the key takeaways and calls for action from the report.

[9]
Alaska’s Renewable Energy Future: New Jobs, Aordable Energy
Alaska’s Energy Context
Introduction
Alaska’s unique geography of widely dispersed remote communities and variable local energy
resources have contributed to a long history of high energy costs across the state, exemplified by
rural electricity residential rates as high as 7X the U.S. average in remote rural locations.
13
Over the decades, a wide variety of eorts to help mitigate the high cost of energy have been
undertaken across the state.
Beginning in the 1950s, the federal Alaska Power Administration built and operated hydroelectric
projects in Alaska in part to mitigate the high cost of energy in Alaska. These assets were
divested to local utilities over 1989-1991.
14
In the 1980s, the State of Alaska began to invest in hydro resource development, including Bradley
Lake (Railbelt) and the Four Dam Pool (Tyee Lake, Swam Lake, Solomon Gulch, Terror Lake).
In the 2008 oil price spike era, the State of Alaska enacted and funded a renewable energy fund
administered by the Alaska Energy Authority to help mitigate the high cost of fossil fuels.
15
More
than 95 operating projects have been built, collectively saving more than 30 million gallons of
diesel each year.
The net results of those investments have helped reduce residential electric rates across Alaska
over the past 20 years – especially across rural and Southeast communities [see Electric Utility
Residential Rates Figure 1].
Electric Utility Residential Rates (Ratio of selected Alaska Regions to US Weighted Average), 2002-2020
However, residential electric rates
across most of Alaska remain extremely
expensive compared to the U.S. and the
upward trend in residential electric rates
in the Railbelt continues to present a
challenge to household budgets. The
renewable investments in the Railbelt,
e.g., Bradley Lake Hydro, Fire Island &
Eva Creek Wind, and State of Alaska
direct subsidized support of natural gas
exploration and development in the Cook
Inlet have not been enough to mitigate
the rise in residential electric rates driven
by the increase in natural gas supply
prices in the Cook Inlet [see Electric
Utility Residential Rates Figure 1].
FIGURE 1
0
1
2
3
4
5
6
2020
2002
Electric Utility Residential Rates
[Alaska Utility-Region :: US Wtd Avg Ratio]
■ Rural Diesel => Diesel + Wind
■ Railbelt => NG
■ Kodiak => Hydro+Wind
■ Southeast => Hydro
Source: EIA Electric sales, revenue and average price, October 7, 2021, 2020, data
tables, Table 6, with previous editions available in pdf at: https://www.eia.gov/electricity/
sales_revenue_price

[10]
Alaska’s Renewable Energy Future: New Jobs, Aordable Energy
The balance of this section on Alaska’s Energy Context provides an overview of:
■ Consumption
■ Production - Oil & Gas
o Oil Production Employment
■ Fossil Fuel Price Outlook
o Electric Power Sector
■ Alaska’s Unique Dispersed Geography & Associated Energy Infrastructure Adaptations
o Energy Infrastructure Employment
■ Renewable history & outlook
o 1980s
o 2008 Oil Price Surge
o Federal Infrastructure Act Opportunities
■ Utility Renewables Goals & Activities
Alaska’s Energy Consumption
Alaska Energy Consumption Estimates by Energy Source (EIA, 2019)
Source: EIA State Energy Data System, Alaska Energy Consumption, 2019
In 2019, Alaska consumed an estimated 616 trillion btus of energy. Roughly 57% of that total
consumption was supplied by natural gas. Renewable energy resources generated an estimated
24 trillion btus or 4% of the total state energy supply.
Alaska North Slope and Cook Inlet Oil & Gas exploration, development and processing use almost
80% of the natural gas consumed in Alaska for those industrial processes.
FIGURE 2
050 100 150 200 250300 350 400
Other Renewables
Biomass
Hydroelectric Power
Nuclear Electric Power
Other Petroleum
Residual Fuel
HGL
Jet Fuel
Distillate Fuel Oil
Motor Gasoline excl. Ethanol
Natural Gas
Coal
Trillion btus
■ Domestic Energy Market
■ Fossil Fuel Industrial Processing + International Air Cargo Hub

[11]
Alaska’s Renewable Energy Future: New Jobs, Aordable Energy
In a 100% clean, renewable energy future, oil & gas exploration and development is expected
to essentially fade away, leaving behind a very modest residual for non-energy end-use, e.g.,
asphalt, and be replaced by a robust mix of renewable energy resources with a markedly
diminished energy footprint for their exploration, development, processing and production of end-
use energy for electricity, heating/cooling and green hydrogen-based fuels.
16
Thus, before taking into consideration population growth and other changes in the energy mix
and production processes between now and 2050, we expect Alaska Energy Consumption to be
roughly 280 trillion btus lower in a 100% clean renewable energy future.
The next largest energy resource consumed in Alaska after natural gas is jet fuel.
The Anchorage International Airport moved from the sixth to the fourth largest air cargo hub in
the world in 2021. In 2019 (most recent EIA State Data), jet fuel consumption at the Anchorage
International Airport was on the order of 17.5 million barrels of jet fuel in 2019. Jet fuel at the
Anchorage International Airport is a substantial fossil fuel energy demand center in Alaska that
merits special attention given its prominence in the Alaska energy picture; 90 trillion btus are
associated with the international passenger and air cargo flights.
17
Distillate fuel oil, the third largest energy resource consumed in Alaska, is widely used in truck,
rail, and marine transport, and rural Alaska electric generation.
In the synthesis of the reports describing costs and benefits from 100% clean renewables in 2050,
MAFA included the estimated cost of transitioning to 100% renewables and renewable hydrogen
production and further downstream processing into liquid fuels for the transport sector, including
aviation jet fuels, marine fuels. For an illustrative example of the energy flows under a 100%
renewable scenario, please see the figure below from the Williams (2020), supplemental materials.
2050 100% Renewable Energy Sankey Diagram (Exajoules)
Source: J.H. Williams et al, Carbon-Neutral Pathways for the United States, AGU Advances Research Article, 10.1029/2020AV000284, Supplemental Materials,
Figure S4. Sankey diagram by scenario, p. 12
FIGURE 3

[12]
Alaska’s Renewable Energy Future: New Jobs, Aordable Energy
Renewables in Electricity Supply
Alaska’s historically high and volatile fossil fuel-based energy costs have been moderated by
utility and independent power producer investments in renewable energy resources across the
state. Renewables have grown to supply 30% of the total electrical demand in Alaska. Renewable
energy projects include:
• Bradley Lake & Brattle Creek, Four Dam Pool & other Southeast Hydro
• Fire Island, Eva Creek, Kotzebue, Kodiak & Alaska Village Electric Cooperative (AVEC) Wind
• GVEA Battery Energy Storage System (BESS)
• MEA Solar PV
• Juneau, Tok, Coman Cove, Craig, Gulkana, Elim, Thorne Bay, Haines & Tanana Biomass
• Chena Hot Springs Geothermal
• Hydrokinetic power in Igiugig
Historic Context and Emerging Trends
To understand emerging trends and opportunities in the context of a thirty-year outlook, it may be
useful to look back at the history that brought us to this point, including a quick look back to the
1970s, before the construction and completion of the Trans Alaska Pipeline System (TAPS), to see
the impact of that development on the energy sector across Alaska and discern the long-term
decline of the oil and gas sector.
DECLINING OIL INDUSTRYx
Alaska Energy Production & Alaska’s End-Use Energy Consumption Comparisons, 1973-2020
Source: EIA Crude Oil Production, Natural Gas Marketed Production, Alaska, 1973-2020
FIGURE 4
0
500
1000
1500
2000
2500
3000
3500
4000
4500
1973
1975
1977
1979
1981
1983
1985
1987
1989
1991
1993
1995
1997
1999
2001
2003
2005
2007
2009
2011
2013
2015
2017
2019
–
–
–
–
–
–
–
–
–
–
–
–
–
–
–
–
–
–
–
–
–
–
–
–
Trillion BTUs per year
■ Natural Gas Marketed ■ Crude Oil Field Production ■ Total Alaska End-Use Consumption

[13]
Alaska’s Renewable Energy Future: New Jobs, Aordable Energy
Alaska’s energy production history took a quantum leap in 1977 with the completion and operation
of the Trans-Alaska Pipeline Systems (TAPS) which enabled Alaska North Slope crude oil production.
After peaking at slightly over 4200 trillion btus per year (2 million barrels of oil per day), crude oil
production has declined rapidly through 2010 (5.4% per year), with the decline rate moderating to
2.6% per year since 2010.
Natural gas marketed production (approx. 80% of which supplies energy for the oil & gas industry
exploration, development and production activities), has been declining at 2.4% per year.
Alaska Oil & Gas Sector Average Monthly Employment (2014-2021)
More recently, while the
rate of decline of oil & gas
production has moderated,
oil & gas sector employment
has been falling rapidly – the
average annual employment
decline has been 11% per
year since 2014. This includes
all those who receive
compensation as employees,
which typically include oil &
gas companies as well as the
oil & gas industry contractors
who employee people. It does
not include sole-proprietors.
18
FIGURE 5
0
2,000
4,000
6,000
8,000
10,000
12,000
14,000
16,000
202120202019201820172016201520142013201220112010
Source: Alaska Department of Labor Workforce Development, Research Analysis Section, Alaska
Employment & Wages, 2010-2021

[14]
Alaska’s Renewable Energy Future: New Jobs, Aordable Energy
TURNAROUND IN FOSSIL FUEL PRICE OUTLOOK IN ALASKA 2008x
The available Energy Information Administration (EIA) State Energy Data (1970-2019) allow us to view
the big changes in fossil fuel price regimes in Alaska and consider the potential for real continuing
escalation in the price of fossil fuels in the future. This report highlights observations from the electric
power, residential, and transportation sectors especially as they pertain to the trends and outlook for
fossil fuel prices in Alaska after 2008 and how those trends inform the energy outlook to 2050.
Electric Power Sector
Following the OPEC oil embargo in 1973 and concurrent with the preparation for and construction
of the Trans-Alaska Pipeline System (1974-1977), the price of fossil fuels (coal, natural gas, distillate
fuels) dropped from historic patterns with energy as high as 2 to 3 times national norms into a new
price regime marked by low natural gas prices from the Cook Inlet (around 50% of U.S. norms) and
coal and distillate fuels in the range of 20% to 50% above U.S. norms – with volatility in between
– for the 34-year period from 1974 to 2008. See Figure 6. EIA State Energy Data: Electric Power
Sector Fossil Fuel Prices (Alaska/U.S. Price Ratio, 1970-2019) below.
EIA Electric Power Sector Fossil Fuel Prices (Alaska/U.S. Price Ratio, 1970-2019)
Source: EIA State Energy Data
In the period of fossil fuel price escalation in 2002-2008, natural gas price ratios stayed flat while
coal and distillate fuels moved toward parity with the U.S., i.e., Alaska prices rose slower than U.S.
Following the oil price spike in 2008, a new price regime emerged where coal and natural gas
prices rose in Alaska while declining in the U.S. The Alaska Electric Power Sector was paying over
2.6X as much for coal and natural gas compared to the U.S. in 2019.
In a June 2021 presentation to the City and Borough of Juneau Assembly, Alaska Electric Light
& Power, whose baseload is served 100% by hydroelectric power, highlighted the benefits of
its long-standing strategic investments in hydroelectric power compared to the natural gas
dependent Railbelt utilities. AEL&P residential rates were 12.5c/kWh while Homer Electric
Association rates were 28.7c/kWh – a stark reflection of the rapid price escalation in natural gas
prices for the Railbelt electric utilities.
19
FIGURE 6
0.0
0.5
1.0
1.5
2.0
2.5
3.0
Alaska / US Price Ratio
1970
1972
1974
1976
1978
1980
1982
1984
1986
1988
1990
1992
1994
1996
1998
2000
2002
2004
2006
2008
2010
2012
2014
2016
2018
–
–
–
–
–
–
–
–
–
–
–
–
–
–
–
–
–
–
–
–
–
–
–
–
–
■ Natural Gas ■ Coal ■ Distillate Fuels

[15]
Alaska’s Renewable Energy Future: New Jobs, Aordable Energy
Alaska Electric Light & Power Residential Electric Rate Comparison – selected Alaska Utilities (2020)
ALASKA’S UNIQUE ENERGY INFRASTRUCTUREx
Alaska Energy Regions Map
Source: Alaska Energy Authority
FIGURE 7
0
5
10
15
20
25
30
AEL&PNational Avg.AnchorageWasillaFairbanksHomer
Cost in ¢/kWh
28.73
25.13
21.56
21.2
15.2
12.52
Source: AEL&P compilation from Table 5.3 of Electric Power Monthly with Data for December 2020 published
by the U.S. Energy Inforamtion Administration in February 2021
Note: AEL&P’s rates remain the lowest among
the large, regulated utilities in Alaska. Our
rates are also comparable to the national
average, which is due in large part to our
ability to sell surplus energy to interruptible
customers.
FIGURE 8
North Slope
Northwest
Arctic
Bering Straits
Yukon-Koyukuk Upper Tanana
Railbelt
Lower Yukon Kuskokwim
Copper River
Chugach
Bristol Bay
Southeast
Kodiak
Aleutians

[16]
Alaska’s Renewable Energy Future: New Jobs, Aordable Energy
It is also useful to note Alaska’s unique energy supply infrastructure which has evolved around the
state’s vast and diverse geography. The Railbelt, which is interconnected by transmission facilities,
stretches from the Interior down to the Kenai Peninsula and represents roughly 79% of the state’s
electric utility generation.
Alaska also has over 150 individual microgrids,
20
an estimated 12% of the planet’s microgrid
infrastructure. Found primarily in remote, rural Alaskan communities, microgrids can be more cost-
eective and often more ecient in integrating multiple power sources compared to traditional
large-scale energy grids.
21
Interestingly, key regional hub communities, including Kotzebue in the Northwest Arctic, Kodiak,
as well as several communities across Southeast Alaska have been leaders in developing their
local renewable resources. Many smaller rural community microgrids are powered by diesel
generators, which often create challenges in transporting diesel and contribute to high electricity
costs for remote communities.
22
Alaska’s microgrid infrastructure poses both an opportunity
and a challenge for the transition to renewable energy and remains a key consideration in the
development and implementation of the strategies and approaches detailed in this report.
EMPLOYMENT BY MAJOR ENERGY TECHNOLOGY APPLICATIONx
Alaska has a high concentration of workers employed in the energy sector, with 21,673 traditional
energy workers statewide as of 2019, equating to 6.4% of total state employment.
23
The number
of traditional energy workers statewide fell to 18,945 in 2020, led by a sharp downturn in the fuels
sector. However, given reductions in total employment in 2020, traditional energy workers in
Alaska still made up a higher proportion of the total state employment in 2020, at 8.3%.
24
Jobs figures for both 2019 and 2020 are presented in this section. The 2020 jobs numbers provide
the most up-to-date information, while 2019 jobs numbers are provided because that was the year for
which the most updated energy consumption and supply data were available. In addition, 2020 figures
may have been impacted by the COVID-19 pandemic. Examining both years allows for presentation
of a more complete picture. A breakdown of energy employment in the state is shown in Figure 9.
Alaska’s Employment by Major Energy Technology Application (2019 - 2020)
Source: U.S. Department of Energy. 2020. “Alaska Energy and Employment – 2020.”, Source: U.S. Department of Energy. 2021. Energy Employment by State: 2021.
FIGURE 9
0
2,000
4,000
6,000
8,000
10,000
12,000
14,000
16,000
Motor VehiclesEnergy EciencyTransmission,
Distribution and
Storage
FuelsElectric Power
Generation
1,450 1,373
14,052
11,474
6,172 6,098
4,701
3,974
2,303 2,084
Lorem ipsum
■ 2019 ■ 2020

[17]
Alaska’s Renewable Energy Future: New Jobs, Aordable Energy
As of the 2021 Energy and Employment Report, the fuels industry employs the largest proportion
of energy workers in Alaska, with petroleum (7,036), natural gas (3,682), and other fossil fuels (498)
making up the largest segments of employment. Of these jobs, 8,058 were related to mining and
extraction of these fossil fuel resources.
xEMPLOYMENT IN ELECTRIC POWER SECTORx
Of the 1,373 Alaskan workers employed by the electric power generation industry in 2020,
traditional fossil fuel generation makes up the largest segment of employment, with 582 jobs,
followed by traditional hydroelectric generation at 405 jobs,
25
as shown in Figure 10.
Alaska’s Electric Power Generation Employment (2019 – 2020)
Source: U.S. Department of Energy. 2020. “Alaska Energy and Employment – 2020.” Source: U.S. Department of Energy. 2021. Energy Employment by State: 2021.
FIGURE 10
0
100
200
300
400
500
Other
Generations
NuclearOil & Other
Fossil Fuels
CoalNatural GasTraditional
Hydro
WindSolar
92 83
61 63
439
405
368
339
128
113
139
130
213
231
99
■ 2019 ■ 2020

[18]
Alaska’s Renewable Energy Future: New Jobs, Aordable Energy
Alaska’s Shift Toward a Renewable Energy Future
Though Alaska’s energy sector has historically been dominated by fossil fuels, the state has been
transitioning toward a renewable energy future.
The most recent escalation in fossil fuel prices (2008-2019) combined with increased appreciation
for the need for a transition to a clean renewable energy future has sparked renewed eorts
among Alaska electric utilities.
State and federal legislation has been passed and funding allocated to advance Alaska’s renewable
energy sector.
STATE RENEWABLE ENERGY FUNDx
In 2008, the Alaska State Legislature established the Renewable Energy Fund, a grant program
administered by the Alaska Energy Authority (AEA).
26
Between 2008 and 2015, this program was
responsible for Alaska’s largest public investment into renewable energy and eciency projects,
with wind and hydroelectric receiving majority of the funding. It is estimated that the program saved
$74 million in diesel costs across the state.
27
As of December 2020, the program has $6.5 million
left and is scheduled to sunset in 2023.
28
In 2010, Alaska set a nonbinding goal of generating 50%
of the state’s electricity from renewable and alternative energy sources by 2025.
29
FEDERAL $1.2 TRILLION INFRASTRUCTURE INVESTMENT AND JOBS ACTx
At the federal level, a recently enacted $1.2 trillion Infrastructure Investment and Jobs Act has the
potential to benefit a variety of sectors in Alaska, including, but not limited to, grid reliability and
resiliency upgrades, smart grid matching grants, renewable energy demonstration projects, energy
eciency and weatherization, energy storage, hydrogen, hydroelectric production incentives,
hydropower, electric vehicle (EV) charging stations, and electric and hybrid school buses.
30,31,32
These funds have renewed interest in renewable energy projects across the state and sparked an
interest in leveraging the new federal resources to continue a shift toward renewable sources.
UTILITY GOALSx
Many utilities in Alaska have also set their own goals related to generating electricity from renewable
sources and carbon reduction. Key examples from the Railbelt include the following:
■ In January 2021, Homer Electric Association (HEA) set a goal of sourcing 50% of its energy
demand from renewable sources by 2025.
33
Since declaring that goal, HEA created a
Strategic Services division to lead renewable energy projects, environmental compliance,
and regulatory aairs.
34
■ Golden Valley Electric Association (GVEA) adopted a goal to reduce its carbon output
by 26% by 2030, and renewable energy was identified as one way for GVEA to achieve
this goal. In 2013, renewable energy was already supplying 20% of GVEA’s system peak
load through energy conservation, hydroelectric, customer small-scale renewable energy
projects, and the Eva Creek Wind Farm.
35
The GVEA Board of Directors faces a mandated
decision by December 2022 whether to decommission or refurbish the Healy 1 coal plant

[19]
Alaska’s Renewable Energy Future: New Jobs, Aordable Energy
that must be implemented by 2024. Fairbanks has some of the worst air pollution in the
nation, high emission rates of carbon dioxide and other greenhouse gasses, and lack of
integration of aordable, clean energy.
■ Chugach Electric Association released a request for proposals in October 2021 to source
renewable energy projects that will contribute to its goal of adding 100,000 megawatt hours
(MWh) per year of renewable energy by 2025.
36
■ In response to member support, in April 2021 Matanuska Electric Association (MEA) adopted
a carbon reduction goal of 28% from 2012 levels by 2030. To achieve this goal, MEA has
prioritized sourcing energy from renewable sources, such as hydropower and member-
generated solar, among other initiatives to reduce its carbon footprint.
37
MAJOR RAILBELT UTILITY INITIATIVES IN SUPPORT OF RENEWABLE DEVELOPMENT
In 2021, HEA installed a large 46.5 MW (up to 93 MWh) Battery Energy Storage System (BESS) in
preparation for developing alternatives to the high and escalating cost of natural gas, enabling the
integration of non-firm energy sources, e.g., 20MW solar project. The battery project is expected
to cost $40 million.
38
UTILITY RENEWABLE / ENERGY EFFICIENCY / BUILDING ELECTRIFICATION INITIATIVESx
A few utilities in Alaska have initiatives in place to incentivize electrification of building heating and
vehicles.
AEL&P in Juneau, which is served primarily by hydropower, has two options which allow
customers to charge their EV during o-peak hours at a reduced rate and oer charging
equipment for rent.
39
AP&T, whose service territory includes Prince of Wales Island in Southeast Alaska, which is served
primarily by hydropower, has incentive programs to encourage the installation of heat pumps for
building heat and the purchase of electric vehicles.
40
Kodiak Electric Association, which is served primarily by wind and hydro with two flywheels and
a battery energy storage system, has an incentive program to encourage customers to switch to
electric heating for both space heating and hot water heaters.
41

[20]
Alaska’s Renewable Energy Future: New Jobs, Aordable Energy
Vast Alaska Renewable Energy
Resource Opportunity
SEVERAL STUDIES OVER THE PAST DECADE HAVE DOCUMENTED ALASKA’S VAST
RENEWABLE ENERGY RESOURCE POTENTIAL.
Renewable Energy in Alaska, WH Pacific, Inc, National Renewable Energy Lab (NREL), March 2013,
found:
■ Alaska is uniquely endowed with a full range of renewable energy opportunities, including
extensive and diverse biomass, hydropower that ranges from run-of-river and low-impact
high-head to traditional massive dams; wind energy that ranges from micro, wind-hybrid
turbines in small coastal villages to large wind farms [coastal + mountain range funnels]; world
class tides; and huge geothermal potential on the northern edge of the Pacific Rim of Fire.
■ The Levelized Cost of Electricity (LCOE)
42
from many renewable energy projects in Alaska,
including energy eciency initiatives, were competitive with local diesel fuel alternatives in
the short term (2010-2020) and looked increasingly competitive with other fossil fuel
alternatives (coal and natural gas) in the longer term (2020-2030) as natural gas prices were
forecast to increase from below the U.S. market average to well above and increased
regulation of coal was expected to add both capital and operating costs.
More recent studies have continued to document a large renewable energy resource base in Alaska:
■ Onshore Wind = 37,753 TWh/yr (2.48 times Texas) and 6726 GW potential nameplate
capacity, 2.4 times Texas, the next largest onshore wind potential state
43
■ Oshore Wind = 12,087 TWh/year, more than 2000 times the statewide energy consumption
in Alaska and more than 3 times the total U.S. energy consumption, a net oshore wind
energy potential that is 68% higher than all other states combined
44
■ Onshore + Oshore Wind Potential = 49,840TWh/yr; more than 14 X the total U.S. energy
consumption (EIA US Energy Consumption, 2020)
■ Hydroelectric = 46.36 GW undeveloped potential of which 4.723 GW is feasible potential
45
■ Geothermal = 2.4 GW potential
46
■ Solar PV = the solar PV resource is comparable to Germany, which has a cumulative
installed solar PV capacity of >55 GW
47
■ Tidal Power = Technical Power Potential of U.S. Marine Resources in Alaska = 1,100 TWh/
year, 27% of the total U.S. electricity generation
48
, of which Cook Inlet East-West Foreland
Transect = 46MW, 400 GWh/year
49

[21]
Alaska’s Renewable Energy Future: New Jobs, Aordable Energy
Alaska Renewable Energy Resource Map Compilation (2021)
FIGURE 11
Wind Speed
Taiping Wang, Zhaoqing Yang, A Tidal Hydrodynamic Model for Cook Inlet, Alaska, to Support Tidal
Resource Characterization, Pacific Northwest National Laboratory, 4 April 2020, Journal of Marine
Science and Engineering, 2020, 8(4), 254, Figure 12 Tidal Power Distribution near the Foreland Region
Tidal Hydrodynamic Model for Cook Inlet
Alaska Hydropower Existing and Feasible NSD Sites
Wind Speed
Joe Batir, David D. Blackwell,
Geothermal Lab, Southern
Methodist University,
TX, Alaska Figure 5:
Geothermal Potential, Heat
Flow and temperature-depth
curves throughout Alaska:
finding regions for future
geothermal exploration,
June 2016
Geothermal Potential
Billy J. Roberts, NREL, Solar Resource Comparison of Alaska and Germany, Figure 1, Solar Energy
Prospecting in Remote Alaska, Paul Schwabe, NREL, February 2016
Solar Energy Prospecting
[22]
Alaska’s Renewable Energy Future: New Jobs, Aordable Energy
Renewable Energy Technology Trends
History – Rapid Reduction in Costs
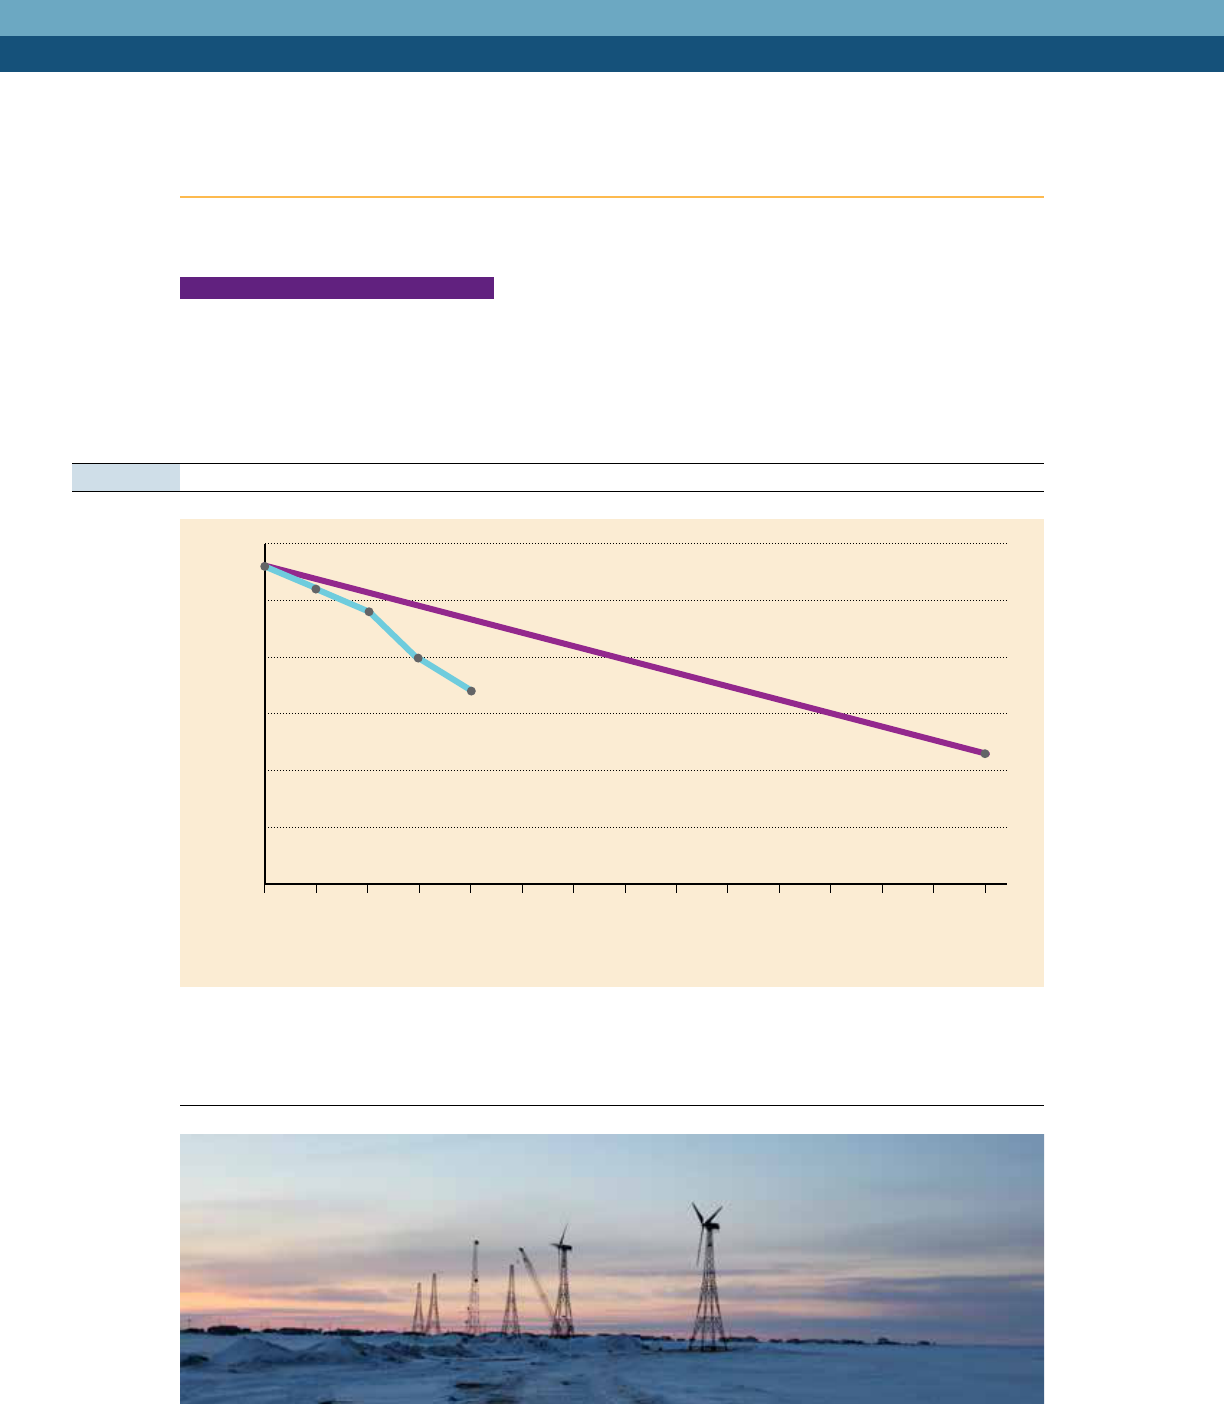
xONSHORE WIND COST TRENDSx
As illustrated in NREL’s 2019 Cost of Wind Energy Review (December 2020), Figure 12: Land-
based wind GPRA cost trajectories for LCOE (in 2015 USD), the actual onshore wind levelized
cost of energy (LCOE) from 2016 to 2020 has declined from $56/MWh to $34/MWh in real $ terms
(-39%) which is considerably faster than the previously projected cost decline trajectory.
Land Based Wind Cost Trajectories (NREL, 2020)
Source: NREL 2019 Cost of Wind Energy Review (December 2020)
Note: The drop in LCOE between 2019 and 2020 is largely because of updates made to the financing assumptions. Prior to the “2018 Cost of Wind Energy Review,”
WETO reported land-based financing using a constant and conservative FCR. The land-based FCR is updated in 2020 to maintain reporting consistency between
land-based wind and oshore wind technologies. Land-based-wind cost of capital data collected by Lawrence Berkeley National Laboratory (Wiser and Bolinger
2020) gives a basis for WACC assumptions for the representative wind project in 2019 and results in a nominal WACC of 6.32%. A sensitivity analysis using the
finance assumptions in last year’s cost report is captured in Appendix A.
FIGURE 12
0
10
20
30
40
50
60
203020292028202720262025202420232022202120202019201820172016
LCDE (2015$/MWh)
56
52
48
40
34
23
■ Actuals ■ GPRA Trajectory

[23]
Alaska’s Renewable Energy Future: New Jobs, Aordable Energy
xOFFSHORE WIND COST TRENDSx
As illustrated in NREL’s 2019 Cost of Wind Energy Review (December 2020), Figure 13: Fixed-
bottom wind GPRA cost trajectories for LCOE, the actual oshore wind levelized cost of energy
(LCOE) declined from $191/MWh to $83/MWh (2016-2020) in real $ terms (-56%). And the cost is
projected to continue to decline toward $51/MWh (2018$).
Fixed Bottom Oshore Wind Cost Trajectories (NREL, 2020)
FIGURE 13
203020292028202720262025202420232022202120202019201820172016
0
20
40
60
80
100
120
140
160
180
200
LCDE (2018$/MWh)
191
180
127
89
83
51
2019 rebaseline analysis
for GPRA reporting
GPRA Projection from rebaseline analyisis
Historical data
for reference
Source: Extract from NREL 2019 Cost of Wind Energy Review (December 2020)
■ Actuals ■ GPRA Trajectory

[24]
Alaska’s Renewable Energy Future: New Jobs, Aordable Energy
xBATTERY STORAGE COST TRENDSx
Electric power markets in the United States are undergoing significant structural change that
are projected to result in the installation of the ability of large-scale battery storage to contribute
10,000 megawatts to the grid between 2021 and 2023 – 10 times the capacity in 2019.
50
Average battery energy storage costs declined from $2012/kWh to $589/kWh from 2015-2019, an
average rate of decline of 27% per year.
51
The EIA Update on Market Trends also reported that,
“Although Alaska and Hawaii represent a significant share of current U.S. battery storage capacity,
their utilization patterns are unique in that batteries need to provide a wider range of additional
services and engineering support than is commonly used in the Lower 48 states.”
52
NREL’s most recent comprehensive cost projections for utility-scale battery storage (2020) anticipate
4-hour battery costs will continue to fall, reaching $208/kWh by 2030 and $156/kWh by 2050.
53
Section summary
Renewable energy costs, including battery storage and the integration of intermittent renewables
into an electric grid, continue to decline. GVEA and HEA leadership in investing in battery storage
resources is to be commended. Additional investments in battery storage should enable the
development of additional intermittent renewable energy resources as well as support additional
variability in demand from the electrification of building and transportation sectors. Centralized
and distributed storage are critical components needed to cost eectively integrate variable
renewable energy resources – around the world, in the U.S. and in Alaska.

[25]
Alaska’s Renewable Energy Future: New Jobs, Aordable Energy
Rising Cost of Fossil Fuels
Against the backdrop of the rapid decline in the cost of renewables and projected future cost
reductions, the electric power sector in Alaska has been experiencing an unusually rapid increase
in the cost of fossil fuels since 2008.
Electric Power Sector Fossil Fuel Prices, Alaska to U.S. Price Ratio, 1970-2019
Source: EIA State Energy Data
Alaska electric sector price premium for coal and natural gas has been escalating at an unusually
high rate since 2008. A State of Alaska Division of Oil and Gas Cook Inlet Natural Gas Availability
study in 2018 projected the costs for Cook Inlet natural gas supply are poised to continue
escalating rapidly.
FIGURE 14
0.0
0.5
1.0
1.5
2.0
2.5
3.0
Alaska / US Price Ratio
1970
1972
1974
1976
1978
1980
1982
1984
1986
1988
1990
1992
1994
1996
1998
2000
2002
2004
2006
2008
2010
2012
2014
2016
2018
–
–
–
–
–
–
–
–
–
–
–
–
–
–
–
–
–
–
–
–
–
–
–
–
–
■ Natural Gas ■ Coal ■ Distillate Fuels

[26]
Alaska’s Renewable Energy Future: New Jobs, Aordable Energy
Cook Inlet Natural Gas Breakeven Costs for Incremental Supply
Source: State of Alaska Division of Oil and Gas Cook Inlet Natural Gas Availability study (2018)
Extending the State’s analysis, natural gas price escalation appears likely to continue until LNG
imports become competitive.
Alaska Cook Inlet Natural Gas Prevailing Price of Utility Purchases: History + Outlook with LNG Import
Competition in 2031 & beyond
As Cook Inlet natural gas
prices rise from $8/Mcf
toward a projected $19/Mcf
over the next decade, the
levelized cost of electricity
from natural gas is slated to
increase toward $136/MWh,
rising well above the cost
of competitive renewable
alternatives.
54
FIGURE 15
0
2
4
6
8
10
12
14
16
18
2020 2021 2022 2023 2024 2025 2026 2027 2028 2029 2030
(Real 2016 $/Mcf)
10% Hurdle Rate (real) 15% Hurdle Rate (real) 20% Hurdle Rate (real)
Breakeven Price for Incremental Supply
FIGURE 16
0
5
10
15
20
25
2010
–
2012
–
2014
–
2016
–
2018
–
2020
–
2022
–
2024
–
2026
–
2028
–
2030
–
2032
–
2034
–
2036
–
2038
–
2040
–
2042
–
2044
–
2046
–
2048
–
2050
–
Nominal $ per Mcf

[27]
Alaska’s Renewable Energy Future: New Jobs, Aordable Energy
Transportation Sector
Transportation Sector Fossil Fuels: Alaska to U.S. Price Ratio, 1970-2019
From 1970-2008, the price
premium for Alaska “retail”
transportation fuels (diesel,
motor gasoline) hovered
around 5 to 15%.
From 2008-2019, the price
premium for Alaska motor
gasoline rose to over 40%
above the U.S., the price
premium for diesel fuel
rose to 12% above the U.S.
Source: EIA State Energy Data
Compared to the continental U.S. (aka Lower 48), Alaska motor gasoline prices have taken o
since 2008 and appear poised to continue to escalate due to increasingly limited competitive
alternatives.
Section Summary
Fossil fuel prices are escalating rapidly across the electric, residential, and transportation sectors.
Policy makers can help reduce the exposure to fossil fuel price escalation by providing financial
and policy support for electric vehicle purchases, discounted rates for charging at o-peak times
and extending the electric vehicle charging infrastructure.
And to stay ahead of the growth in the electric demand from electric vehicles, policy makers can
encourage co-investment and a supportive policy environment to accelerate the deployment of
renewable energy resources and the transition to a 100% clean renewable energy future.
FIGURE 17
0.0
0.2
0.4
0.6
0.8
1.0
1.2
1.4
1.6
Alaska / US Price Ratio
1970
1974
1978
1982
1986
1990
1994
1998
2002
2006
2010
2014
2018
–
–
–
–
–
–
–
–
–
–
–
–
–
■ Distillate
■ Fuel Oil
■ Jet Fuel ■ Motor Gasoline

[28]
Alaska’s Renewable Energy Future: New Jobs, Aordable Energy
Potential Paths for Renewables to
Replace Fossil Fuels
Former Saudi Oil Minister Sheikh Ahmed Zaki Yamani famously observed (Daily Telegraph, June 25,
2000):
■ “The Stone Age came to an end, not because we had a lack of stones, and the oil age will
come to an end not because we have a lack of oil.”
■ “Oil will remain underground with no buyers in 30 years [2030].”
Indeed, 20 years later as the cost of clean renewable energy continues to decline while the costs
of fossil fuel energy continue to escalate, recent international and national studies highlight the
potential for renewable energy to replace fossil fuels as the primary, if not exclusive, source of
energy by 2050.
Below are highlights of the findings from three studies that were used in the MAFA analysis of
the potential costs and benefits of a transition to 100% clean renewables for Alaska by 2050.
McKinsey & Company, The net-zero transition (January 2022)
■ The Network for Greening the Financial System Net Zero 2050 global scenario would entail
around $275 trillion in cumulative investments over 30 years - around $25 trillion more than
the Current Policies scenario - an increase of 0.3% of the global GDP
55
■ In the Network for Greening the Financial System Net Zero 2050 global scenario, about
200 million direct and indirect jobs would be gained and 185 million lost by 2050 for a net
gain of 15 million jobs
56
■ None of the boroughs in Alaska show up on the list of US counties at high employment risk
in a net zero transition
57
M.Z. Jacobson, Zero Air Pollution and Zero Carbon From All Energy Without Blackouts at Low
Cost in Alaska (December 7, 2021)
58
■ Transitioning Alaska to 100% wind-water-solar (WWS) would create more jobs than lost
■ Save lives from reduced air pollution
■ Eliminate >43 million tonnes-CO2 equivalent per year in 2050
■ Reduces 2050 all-purpose, end-use energy requirements by half
■ Reduces Alaska’s 2050 annual energy costs
■ Reduces annual energy, health plus climate costs
J.H.Williams, et al, Carbon Neutral Pathways for the United States, (12 November 2020)
59
■ The Intergovernmental Panel on Climate Change (IPCC) Special Report on Global Warming
of 1.5°C points to the need for carbon neutrality by mid-century
■ Multiple carbon neutral pathways, including 100% Renewables, met all forecast U.S. energy
needs at a net cost of 0.2–1.2% of GDP in 2050, using only commercial or near-commercial
technologies, and requiring no early retirement of existing infrastructure
■ All pathways employed four basic strategies: energy eciency, decarbonized electricity,
electrification, and carbon capture

[29]
Alaska’s Renewable Energy Future: New Jobs, Aordable Energy
■ Least-cost pathways were based on >80% wind and solar electricity plus thermal generation
for reliability
60
■ We found multiple feasible options for supplying low-carbon fuels for non-electrifiable end
uses in industry, freight, and aviation, which were not required in bulk until after 2035.
■ In the next decade, the actions required in all pathways were similar: expand renewable
capacity 3.5 fold, retire coal, maintain existing gas generating capacity, and increase electric
vehicle and heat pump sales to >50% of market share.
61
Key observations from MAFA’s analysis of the transition to 100% renewable energy by 2050 in
Alaska include:
■ The high cost of fossil fuels in Alaska, including the rapid and continued projected increase
in natural gas prices, accelerate the window in which renewable energy becomes attractive
across the electric and heating sectors in Alaska.
o The relatively higher cost of fossil fuels in the total cost of electricity across Alaska tend
to outweigh the relatively higher capital and operating costs across Alaska [relative to
CONUS cost assumptions used in McKinsey, Jacobson, Williams].
■ The relatively small scale of industrial fuel production plants (H2, Fischer-Tropsch, Liquid
“Synthetic” Fuels) that might be modeled for the domestic Alaska market, not unlike Alaska
in-state petroleum products refineries, tend to driver higher unit costs and, all other things
being equal, increase the cost of 100% renewable fuels by 2050 [relative to potential large
scale plants in Alaska that serve both domestic and transit trac/international markets or
imports from larger scale plants in Canada or CONUS].

[30]
Alaska’s Renewable Energy Future: New Jobs, Aordable Energy
Emerging Opportunities for Decarbonization of Building and
Transportation Sectors
xBUILDING ELECTRIFICATIONx
Building electrification has been incentivized by Alaska utilities with substantial hydroelectric
resources, including AEL&P in Juneau, Kodiak Island Electric Association, AP&T on Prince of Wales
Island, and Sitka.
The Northwest Arctic Borough engaged Analysis North to develop an Alaskan Heat Pump
Calculator to help assess whether a heat pump may be an economic choice for a homeowner and
to compile the results of the application of that model to a wide range of communities and home
energy configurations around the state.
62
The Mini-Split Heat Pumps in Alaska Report concluded:
■ Heat pumps appear competitive in many cases in communities served by home heating oil
or propane.
■ At the then current residential prices for natural gas in the Cook Inlet and Railbelt electric
rates, heat pumps did not appear economically competitive.
When utility prevailing natural gas prices rise into the $15/Mcf range (and residential retail rates
rise toward $1.90/ccf) and electric utilities have migrated to a mix of renewables with residential
electric rates around 20c/kWh, which appears to be a plausible scenario in the 2030-time frame,
building heat pump technology will be competitive with natural gas and poised to quickly capture
market share and grow electric demand.
63
xTRANSPORTATION ELECTRIFICATIONx
Electrifying transportation provides an opportunity to power vehicles and other modes of
transportation with clean energy rather than fossil fuels, thereby reducing carbon emissions. Electric
vehicles (EVs) are a key component of a renewable energy transition. In addition to emissions reductions,
EVs oer health benefits and the future potential to support resilience via power to the grid.
64
In a recent study of the total cost of ownership of electric vehicles for Consumer Reports from
October 2020, the report concluded:
65
■ Both battery electric vehicles (BEVs) and plug-in hybrid electric vehicles (PHEV) are saving
50% on their repair and maintenance costs, when averaged over a typical vehicle lifetime
compared to internal combustion engine (ICE) vehicles.
■ Based on average driving habits, BEVs were estimated to save consumers about 60% on
fuel costs compared to the average ICE vehicles.
■ For all EVs analyzed, the lifetime ownership costs were many thousands of dollars lower
than all comparable ICE vehicles’ costs, with most EVs oering savings of between $6,000
and $10,000.
■ Overall, these results show that the latest generation of mainstream EVs typically cost less
to own than similar gas-powered vehicles, a new development in the automotive industry
with serious potential consumer benefits.

[31]
Alaska’s Renewable Energy Future: New Jobs, Aordable Energy
With the growing interest for EVs in Alaska, the Alaska Center for Energy and Power conducted a
literature review to understand how these vehicles perform in colder weather. The results showed
that EVs generally perform similar to or better than an internal combustion engine in the cold.
66
As of June 2021, Alaska had nearly 1,000 EVs on the road.
67
Currently, there are 62 public level
2 charging plugs and five public direct current fast charging (DCFC) plugs throughout the state.
68
To grow this number, recent funding eorts have been announced. In 2021, the AEA, with support
from the Volkswagen Mitigation Trust Fund and the U.S. Department of Energy’s State Energy
Program, awarded nearly $1 million in grants to add EV charging stations at nine sites along the
state’s backbone highway system.
69
Alaska’s ferry system also presents another opportunity to advance electrification of the
transportation sector. The Infrastructure Investment and Jobs Act will fund at least one program in
Alaska to pilot electric ferries.
70
Electric vehicle purchases and charging have been incentivized and supported by Alaska utilities
with substantial hydroelectric resources including AEL&P and AP&T.
xGREEN HYDROGENBASED FUELSx
Hydrogen gas is anticipated to play a vital role in decarbonization, potentially addressing 30% of
GHG emissions.
71
When the electricity used to electrolyze water and create hydrogen is generated from renewable
energy sources, it is termed “green hydrogen.”
72
A recent comprehensive study from the Columbia Center on Global Energy Policy, Green Hydrogen
in a Circular Economy: Opportunities and Limits, Fan et al., August 2021 has a particularly insightful
set of findings and analysis:
■ Green hydrogen and fuels derived from it, e.g., ammonia, methanol, aviation fuels, can
replace higher carbon fuels in some areas of the transportation sector, industrial sector, and
power sector. They can provide low-carbon heat, serve as low-carbon feedstock, reduce
gas for chemical processes, and act as an anchor for recycling CO2 [executive summary
findings].
■ The cost of green hydrogen is high today, between $6-14/kg on average in most markets
[executive summary findings].
o Dramatic technical improvements in key technologies, e.g., fuel cells and hydrogen
tanks, have stimulated many recent analyses (IEA World Energy Outlook 2021) to see
hydrogen as an essential component of the energy transition, provided its upstream
production and use emit very few greenhouse gases and pollutants [background,
page 16]
o Mean 2030 levelized cost of hydrogen forecasts in the U.S. cluster around $4/kg
[Figure 18].
• With low-cost renewable energy with high capacity factors, the levelized cost
of hydrogen forecasts are as low as $2.30/kg in 2030. These high-quality sites
will likely provide early opportunities to grow green hydrogen and help develop
infrastructure and commercial frameworks [Figure 10 notes].
• See Figure 19 “geographies with resources of high capacity and low cost”
below [opportunities (production), p. 49].
[32]
Alaska’s Renewable Energy Future: New Jobs, Aordable Energy
■ Green hydrogen commercialization is limited by existing infrastructure [executive summary
findings].
■ The governments of Japan, Canada, Australia, Germany, and the EU have published formal
road maps for hydrogen production, use and growth. These plans include subsidies for
manufacturing electrolyzer and fuel cells, port infrastructure, and market aligning policies.
[executive summary findings].
■ Use of green hydrogen and green hydrogen fuels could provide substantial additional
benefits to local economies and environments, including reduction of particulate and sulfur
pollution, maintenance or growth of high-wage jobs, and new export opportunities (fuels,
commodities, and technologies) [executive summary findings].
■ Transportation Market Opportunities for Green Hydrogen
o Medium- and Heavy-Duty Trucks (p. 38)
• Both hydrogen fuel cells and lithium batteries are potential options for
decarbonizing pathways for heavy-duty vehicles. However, batteries are not
practical for many heavy applications for several reasons:
• Batteries have limited range. Hydrogen fuel cells can significantly extend
trucks’ zero emissions range capability to on par with conventional vehicles.
• A typical regional truck haul for trucks of 350 miles requires 16,000
pounds of batteries; the same distance requires 120 pounds of hydrogen
and a 4,000-pound hydrogen storage tank.
• Batteries have long charging times, which for long-haul vehicles could be
hours; by contrast refueling time for hydrogen fuel cell trucks is only 10 to
20 minutes, significantly reducing downtime in a fleet’s daily operations.
• A relatively small number of hydrogen fueling stations at key truck freight hubs
could serve large hydrogen fuel cell powered truck fleets.
o Ships (p. 38-39)
• The global shipping industry currently exclusively uses heavy oil or marine
diesel as fuel. Shipping fuel has a high concentration of sulfur that produces
air polluting chemicals and particulates that are harmful to human health.
These pollutants are concentrated near coastlines where densely populated
communities reside. Changing to cleaner shipping fuels will not only reduce
GHG emissions but also yield significant health benefits, especially to
communities living near ports.
• Similar to medium- and heavy-duty trucks, batteries are impractical for maritime
applications due to their relatively heavy weight and limited range. Hydrogen
can provide a range of dierent marine fuel options, including liquid hydrogen
or gaseous compressed hydrogen, or methanol or ammonia, which are both
made from hydrogen. Of these, ammonia is seen by many as most suitable
for transition to a sustainable shipping industry, as liquid hydrogen cannot be
blended into conventional marine fuels and must be kept at high pressures or
extremely cold temperatures. Ammonia has a higher energy density than liquid
hydrogen and lower overall fuel related costs (see figure 18 below) because
it can be easily stored as a liquid in inexpensive tanks at very low pressures.
Additionally, ammonia can be used in internal combustion engines or fuel
cells, and many ship engines can be retrofitted to adapt to use of ammonia
fuel, making ammonia not just a low-carbon alternative but also available
today and viable for rapid scaling. Methanol has also demonstrated many of
these benefits; however, ammonia contains no carbon and releases no carbon

[33]
Alaska’s Renewable Energy Future: New Jobs, Aordable Energy
dioxide in use, making it both a lower carbon and lower full-cost alternative.
• During the oil price spike in 2008, AP&T and other Southeast diesel fuel
consumer stakeholders conducted a desktop feasibility study in collaboration
with fuel suppliers in an exploration of ammonia fuel as a potential substitute
for diesel and concluded that it could become a viable competitive alternative
under the right combination of high diesel fuel prices, diesel emissions
regulations and a competitively priced source of ammonia [MAFA personal
communication, 2008].
Overall Fuel-related Cost Components of Hydrogen, Ammonia and Methanol
Source: Data courtesy of Yun Zhao, originally reported in Zhao et al., “An Ecient Direct Ammonia Fuel Cell for Aordable Carbon-Neutral Transportation,” Joule 3,
no. 10 (2019): 2472–2484, https://doi.org/10.1016/j.joule.2019.07.005.
Other countries have also been exploring the potential for green hydrogen. A recent feasibility
study determined that Australia was ideal for green hydrogen development because of available
infrastructure, land, and renewable resources.
73
FIGURE 18
0
1
2
3
4
5
6
7
Cost ($/gallon gasoline equivalent)
■ Dispensation
■ Distribution
■ Transmission
■ Fuel production
■ N
2
/CO
2
capture
■ H
2
storage
■ H
2
gathering
■ H
2
production
Hydrogen Ammonia Methanol

[34]
Alaska’s Renewable Energy Future: New Jobs, Aordable Energy
The Alaska Air Group is exploring green hydrogen to meet its goal of net-zero emissions by 2040.
In partnership with ZeroAvia, a zero-emission aviation company, the two companies aim to develop
a fleet of hydrogen fuel cell electric planes powered by green hydrogen.
74
If the technology is
successful, it could serve as a model for future green hydrogen production and use at key airport
hubs and beyond. In addition, with infrastructure improvements that could be sited in the Nikiski
area, Alaska has the potential to manufacture green hydrogen to serve the international air cargo
hub in Anchorage as well as export green hydrogen to Pacific Rim demand centers. See Alaska
opportunities in Figure 19: Geographies with combined zero-carbon resources of high capacity
and low cost [Fan, et al, p. 49, October 2021].
Geographies with Combined Zero-carbon Resources of High Capacity and Low Cost
Source: Columbia Center on Global Energy Policy, Green Hydrogen in a Circular Economy: Opportunities and Limits, Fan et al., August 2021.
FIGURE 19
Solar and Wind
Other ZC Resources
Abundant Hydro
Adundant Wind
Hydro and Wind
Hydrogen and Ammonia Demand Centers

[35]
Alaska’s Renewable Energy Future: New Jobs, Aordable Energy
In addition, we note that the International Council on Clean Transportation has two recent working
papers which highlight the potential for zero emission fuels in the Pacific and the potential for an
Aleutians port to serve as a critical refueling hub:
■ REFUELING ASSESSMENT OF A ZERO-EMISSION CONTAINER CORRIDOR BETWEEN
CHINA AND THE UNITED STATES: COULD HYDROGEN REPLACE FOSSIL FUELS?, By:
Xiaoli Mao, Dan Rutherford, Liudmila Osipova, Bryan Comer, March 3, 2020.
■ LIQUID HYDROGEN REFUELING INFRASTRUCTURE TO SUPPORT A ZERO-EMISSION U.S.–
CHINA CONTAINER SHIPPING CORRIDOR, By: Elise George, Xiaoli Mao, Dan Rutherford,
Ph.D., Liudmila Osipova, Ph.D., October 14, 2020, see Figure 20 below highlighting the
potential for an Aleutian Island refueling hub.
Hydrogen Demand and Refueling Infrastructure Needed for Transpacific Container Ships Under the Full
Deployment Scenario
Source: International Council on Clean Transportation: LIQUID HYDROGEN REFUELING INFRASTRUCTURE TO SUPPORT A ZERO-EMISSION U.S.–CHINA
CONTAINER SHIPPING CORRIDOR, By: Elise George, Xiaoli Mao, Dan Rutherford, Ph.D., Liudmila Osipova, Ph.D., October 14, 2020
FIGURE 20

[36]
Alaska’s Renewable Energy Future: New Jobs, Aordable Energy
Strategies to Accelerate the Transition
to Clean Renewable Energy
This section outlines some of the approaches in policy, planning, funding and financing, and
workforce development that could help accelerate Alaska’s transition to clean renewable energy.
Though few explicit barriers hinder renewable energy development in Alaska, the state currently
lacks the regulatory framework and supporting legislation needed to attract additional investment
in the industry at scale. Attracting private investment to facilitate further development in renewable
energy remains a critical hurdle, as the market stability and predictability investors require is
dicult to achieve if the state remains relatively silent in regulating the sector. Aligning Alaska’s
renewable energy goals with supporting legislation will provide the public, private, and nonprofit
sectors of Alaska, some of which may have limited technical or financial ability to procure
renewables, greater access to clean energy.
Additional federal and state investments are necessary if Alaska is to realize significant and
achievable clean energy benefits (and get out from under the heavy burden of fossil fuels) by 2050.
ACTIONS THAT COULD HELP ACCELERATE ALASKA’S TRANSITION TO CLEAN RENEWABLE
ENERGY ARE OUTLINED BELOW.
Transparent accounting – Encourage transparent accounting for the $1.2 trillion Infrastructure
Investment and Jobs federal support. More transparent and accessible information will benefit
private entrepreneurial, utility and community eorts to access and eectively deploy available
funds. HB 177 would prevent a Governor, without legislative approval, from unilaterally spending
large sums of federal money should it flow into the state when the legislature is not in session,
thus ensuring an opportunity for public input. This bill is needed to correct a statutory blind spot as
Alaska prepares to receive an influx of new federal infrastructure funds.
State Comprehensive Plan – Undertake a comprehensive statewide, strategic policy and
planning eort, including an explicit goal of transitioning to 100% clean renewable energy by
2050, to help focus emerging integrated planning eorts, including the Railbelt Integrated
Resource Plan required by recent 2020 legislation establishing an Electric Reliability Organization.
Legislation to set goal – Enact legislation requiring utilities to achieve 100% clean renewable
energy by 2050, and to measure progress toward that goal. Legislation could encourage a
supportive and transparent regulatory environment aimed at accelerating the transition to
renewables by providing clear guidance and promoting creative solutions like power purchase
agreements (PPAs) and community solar.
Investments – Provide funding and financing commensurate with the need to accelerate the
transition to 100% clean renewable energy by 2050.
75

[37]
Alaska’s Renewable Energy Future: New Jobs, Aordable Energy
FUNDING MECHANISMS COULD INCLUDE:x
Alaska Renewable Energy Fund – Extend the Alaska Renewable Energy Fund beyond its current
sunset of 2023 and fund it with a fresh round of seed capital in the range of $3.2 billion to help
leverage federal and private co-investment.
The REF, a grant program established by the Alaska State Legislature in 2008, helps utilities,
independent power producers, and local and tribal governments develop renewable energy
projects.
76
The REF is managed by AEA in coordination with a nine-member Renewable Energy
Fund Advisory Committee. The program provides grant funding for the development of qualifying
and competitively selected renewable energy projects; as of February 2021, 287 REF grants have
been awarded to projects totaling $268 million.
77
Over 90 operating projects have been built
with REF contributions, collectively saving more than 30 million gallons of diesel each year. As of
January 2018, operational REF projects have an overall benefit-cost ratio of 2.5 based on total
known project cost, of which state funding is only a portion.
78
Energy Eciency Programs – Increase support for Building Energy Eciency, including Building
Envelope Improvements (AHFC/Cold Climate Housing), and Lighting and Energy Appliance
upgrades (local electric utility programs).
Clean Energy Infrastructure – Invest in key renewable energy infrastructure including electric
vehicle charging station infrastructure, upgrades and additions to electric transmission lines and
energy storage capacity for renewable generated power.
Energy Storage Capacity for Renewable Energy – Homer Electric Association’s (HEA)
investment in a new battery system for storing energy provides a great example for other
utilities in Alaska. The new battery system will allow HEA to diversify its energy matrix and will
meet reliability requirements without burning additional fuel. Incorporating the battery storage
facility into HEA’s grid structure will ultimately lower greenhouse gas production by allowing
HEA to utilize non-dispatchable renewable energy instead of remaining over dependent on
natural gas.
79
Electric Vehicle Charging Station Expansion – As demand for Electric Vehicles (EVs) grows
in Alaska, the need to expand EV charging infrastructure also grows. Recent investment in an
EV fast-charging corridor from Healy to the Kenai Peninsula in the railbelt by Alaska Energy
Authority (AEA),
80
via the Volkswagen Settlement funds, provides an example of the type of
infrastructure needed in Alaska to support a transition to renewable energy.
Upgrade and Extend Railbelt/Rural Transmission Lines – The lowest potential cost energy
resources, potentially including wind, geothermal, solar, and low-impact hydro may not be
located adjacent to load centers and electric system substations. In CONUS markets, the
cost of transmission system upgrades has become a significant hurdle for the integration of
low-cost new renewable generation.
81
In the AEA’s Railbelt Integrated Resource Plan (2009),
the cost of transmission system upgrades to support renewable resource development was
considered a system wide benefit and not charged to individual projects. Advocate for the
upgrade and extension of transmission infrastructure (Railbelt, Rural, Southeast) where the
total system wide benefits of access to low cost renewables (displacing the total cost of fossil
fuels – direct, health and climate costs over the study time horizon) exceed the cost.
[38]
Alaska’s Renewable Energy Future: New Jobs, Aordable Energy
Alaska Permanent Fund (APF) investment policies – Seek Alaska Permanent Fund support for
publication of environmental disclosures of its investments to ensure portfolio investments are
accessing and addressing climate risks, analogous to the CALPERS initiative to require improved
environmental disclosures among its investments of the nation’s largest public pension fund.
Federal support of the transition to 100% clean renewable energy – Advocate for the revival
of the national mandate to electrify America under the Rural Electrification Administration (now
know as Rural Utility Service) under a new “clean energy for America” banner with funding support
modeled on the federal highway funding program which grew out of the National Interstate and
Defense Highways Act of 1956 with a state:federal funding ratio of 1:9.
IN ADDITION TO FUNDING RENEWABLE INVESTMENTS, OTHER ACTION ITEMS INCLUDE:
Disclosure - Encourage and support private and public sector entities that seek to develop and
disclose their environmental impacts under the CDP (formerly known as “Climate Disclosure
Project”), a leading global environmental disclosure system. See https://www.cdp.net/en
Regional Integrated Resource Plans – Advocate for Regional Integrated Resource Plans that include:
• Substantive opportunities for local collaboration/consultation
• Consideration of future cost escalation associated with fossil fuel resources from both
direct and indirect costs, e.g. CO
2
equiv
emissions costs
82
• Explicitly require regional plans to include the overarching policy goal of reaching 100%
clean renewable energy for all energy needs by 2050 and include a pathway to achieve it
within their options for consideration
Renewable Portfolio Standard – Enact Renewable Portfolio Standard. Alaska Gov. Mike Dunleavy
recently introduced SB 179 and HB 301 to establish a Renewable Portfolio Standard (RPS) for the
Railbelt region of Alaska. The proposed bills would require the five electric utilities on the Railbelt
to generate a specified percentage of their electricity from renewable resources according to the
following timeline: 20% by 2025, 30% by 2030, 55% by 2035 and 80% by 2040.
Under current end-use energy consumption patterns, the 80% renewable portfolio standard
applied to the Railbelt Electric Utilities amounts to roughly 3% of the total energy consumption in
Alaska. See chart below.

[39]
Alaska’s Renewable Energy Future: New Jobs, Aordable Energy
80% Renewable Portfolio Standard (RPS) for Alaska Railbelt Electric Utilities compared to Total Alaska
Energy Consumption by Market Segment (2019 data)
Source: Energy Information Administration, State Energy Data System, 2019 data
An 80% renewable portfolio standard for the Railbelt electric utilities, expressly limited to clean
renewable energy, would be a welcome first step toward 100% clean renewable energy by 2050.
However, recognizing that more than 90% of Alaska end-use energy is not electrified, an 80%
renewable portfolio standard for the current railbelt electric utilities, would fall far short of the
need to transform our collective energy use to clean renewable energy by 2050.
Regulatory Commission of Alaska – Enact regulatory reforms to encourage renewable energy
development, improve transparency and support community involvement. The Regulatory
Commission of Alaska (RCA) regulates public utilities by certifying qualified providers of public
utility services and ensuring that they provide safe and adequate services and facilities at just and
reasonable rates, terms, and conditions.
Raise the Net Metering Cap – Raise the net metering cap so utilities can enable electric
customers who produce their own electricity to receive a credit for the excess energy they
transfer back to the utility. Caps are set on most net metering policies to limit the utility’s risk
of lost revenue. The most common cap type is set at a percentage of the utility’s or state’s
peak demand, capacity, or load in a given year. Most states have a peak demand cap between
0.2% and 9%. Credit amounts, eligible technologies, and caps vary by state and locality.
83
Net
metering policies not only incentivize customers to invest in renewable energy technologies,
they also can help utilities meet their requirements to achieve 100% clean renewables by 2050.
FIGURE 21
0
20,000,000
40,000,000
60,000,000
80,000,000
100,000,000
120,000,000
140,000,000
160,000,000
180,000,000
200,000,000
Trillion BTUs per year
■ Electric Power ■ Residential ■ Commercial ■ Industrial ■ Transportation
80% RPS of Railbelt
Electric Generation
Railbelt Electric
Generation
Total Alaska Electric
Generation
Total Alaska Energy
Consumption
(includes electric power)
[40]
Alaska’s Renewable Energy Future: New Jobs, Aordable Energy
Alaska’s net metering policies
apply to renewable energy
systems that are 25 kW or less
and set a cap of 1.5% of the
utility’s average load. Customers
who export excess energy to
the utility receive a credit equal
to the utility’s savings on fuel
and operations necessary to
generate that electricity. With
an increase in solar projects,
84
there is a need for raising
the net metering cap for all
utilities in Alaska under the
current regulatory framework.
As of 2021, with the approval from the Regulatory Commission of Alaska, GVEA raised its
net metering cap from 1.5% to 3%. Homer Electric Association, which had already previously
raised its cap, did so again, from 3% to 7%. At the end of 2020, the installed net metered
capacity across the Railbelt rose 52% from 2019 and involved 1,638 net metered customers.
Solar PV was responsible for 97% of the total energy fed to the Railbelt grid.
85
Good Governance Regulations – Enact regulations that improve transparency and support
community involvement in the transition to lowest reasonable cost renewable energy. For
example, ensuring that fuel and operation costs for utilities are transparent and accessible
to the public and/or utility cooperative members would allow for better planning and
understanding of a renewable energy transition and true energy costs, as would enforcing
timelines for cost- and energy-saving programs like tight power pools. Eliminating any
“pancaking” or stacking of rates through the Electric Reliability Organization’s reliability
standards would lower the cost of adding renewable energy to the grid and increase trust
with ratepayers. Providing member lists to community members seeking to serve on utility
boards and ensuring that utility board and member meetings and minutes are accessible via
the internet, as well as scheduling public comment and public portions of meetings before
executive sessions, would allow for more ecient engagement between electric co-ops and
members. And, developing guidelines on on-bill financing programs as well as moving from
promises to action on building community solar programs would allow for a better interface
between community advocates and utilities.
Increase expertise – Increase funding to both the Regulatory Commission of Alaska and
outside advocacy groups (ie, ratepayer groups) to increase stang and expertise to better
balance the energy industry, private and member-owned electric utilities, and ratepayer needs
and help ensure the capacity needed to foster an accelerated transition to renewable energy.
Private Sector Initiatives – Encourage and support public and private sector entities to disclose
their Scope 1, 2 and 3 climate emissions.
86

[41]
Alaska’s Renewable Energy Future: New Jobs, Aordable Energy
WORKFORCE DEVELOPMENT
Incentivize industry-led training curriculum for the construction and operations of renewable
energy technologies to provide current industry workers with renewable energy skills and
alignment with existing jobs. Building the skills of workers in existing construction and operations
fields, such as fossil fuels, HVAC, and electrical, will be essential to a renewable energy transition.
Most of these occupations already require continuous learning and skill development.
87
The
state can partner with these industries and fund development of training curriculums that can be
incorporated into existing training, rather than develop training specifically for renewable energy
technologies. In addition, industries can drive curriculum development according to the skills
needed for available jobs.
Alaska has several training programs funded by the Alaska Workforce Investment Board (AWIB).
These programs include the Alaska Construction Academies (ACA) trainings oered by the Alaska
Works Partnership, Alaska Technical Vocational Education Program (TVEP), State Training and
Employment Program (STEP), and youth training program. Through these programs, organizations,
and state entities can receive support to train and prepare workers for jobs that align with AWIB’s
industry priorities.
88
According to the State Integrated Workforce Plan, there is still heavy emphasis
on training for the oil and gas industry. However, the plan notes that Alaskans should grow their
skillsets as demand for renewable energy workers grows.
89
As the industry expands in Alaska,
AWIB could identify renewable energy as a priority and fund entities to develop training curriculum
through the existing training programs.
Incorporate training curriculum into a state-certified apprenticeship program that oers a paid
opportunity for individuals entering a workforce to gain skills, knowledge, and mentorship without
obtaining an advanced degree. These programs also connect employers with qualified workers.
90
Incorporating renewable energy training curriculum into a state-registered apprenticeship
program can help standardize the level of renewable energy knowledge and skills needed to
enter the workforce. An example of a statewide training initiative is the California Advanced
Lighting Controls Training, which was developed to teach employed electricians how to install and
maintain advanced lighting systems and energy eciency technologies. The curriculum was also
integrated into the apprenticeship program to build a pipeline of qualified workers.
91

[42]
Alaska’s Renewable Energy Future: New Jobs, Aordable Energy
Since 2015, there has been an emphasis placed on expanding apprenticeship programs in
Alaska, with a primary focus on new industries and occupations.
92
With a majority of apprentices in
construction, there is a significant opportunity to incorporate established renewable energy training
programs into the existing construction apprenticeships as the demand for these jobs grows.
The Alaska IBEW/NECA apprenticeship program for electricians has adopted a standardized
curriculum for the installation of electric vehicle charging equipment. It’s called the Electric
Vehicle Infrastructure Training Program (EVITP) and the curriculum has been adopted by several
other apprenticeship programs around the country.
Encourage engagement of students in renewable energy technology education to give them
early exposure to career possibilities and create a network of educated individuals who could
later contribute to a renewable energy transition. With a focus on clean energy and job creation,
the Colorado Energy Oce, U.S. Department of Energy, and Tri-State Generation and Transmission
funded the Colorado State University
Extension to develop a clean energy
curriculum for middle and high school
students. The curriculum includes
hands-on activities and locally relevant
examples that can be tailored by
teachers for any grade level.
93
Currently, the Renewable Energy
Alaska Project (REAP) is working to
connect energy education to Alaskans.
Through its initiative, Alaska Network
for Energy Education and Employment,
REAP compiles and categorizes
energy curricula so they can be easily accessed by Alaskans.
94
This institutional knowledge
presents an opportunity to understand gaps in existing curricula and inform development of a
state-funded renewable energy technology education curriculum.
OTHER FUNDING MECHANISMS
Green Bank – A Green Bank is a capital management program that leverages limited public
dollars to attract greater private investment in clean energy. Its goal is to accelerate growth in
the clean energy market while making energy cheaper and cleaner for consumers, driving job
creation, and preserving taxpayer dollars. A Green Bank is intended to deploy public capital
eciently through financing to help maximize private investment and lower the costs of clean
energy to spark consumer demand. A Green Bank also facilitates market development by working
with originators and lenders and oering the information consumers and businesses need to
confidently purchase clean energy.
95
Pending legislation, SB 123 in the Senate and HB 170 in the House of Representatives, known as
the Alaska Energy Independence Fund, would support the creation of a Green Bank in Alaska.
96,97
The Alaska Energy Independence Fund would be under the jurisdiction of the Alaska Industrial

[43]
Alaska’s Renewable Energy Future: New Jobs, Aordable Energy
Development and Export Authority (AIDEA) and would support public-private partnerships oriented
toward renewable energy.
98
The proposed Green Bank would require starting capital; pending
legislation recommends $10 million in unrestricted general funds, which could be augmented
by $130 million in expected federal funds. After that initial capital, the Green Bank would use
payments from its borrowers to pay for future loans.
99
Commercial Property Assessed Clean Energy (C-PACE) Loans – Broader investment in
marketing and implementing C-PACE programs in municipalities around Alaska could benefit the
transition to renewable energy. C-PACE is a financing tool for improving commercial buildings
with energy eciency measures or renewable energy systems. Unlike conventional construction
loans, C-PACE is designed to work specifically with the unique needs and barriers of financing
building improvements, including longer loan terms, o-book debt, and repayment that transfers
with the sale of property just as does the savings generated by the building improvements.
Debt associated with doing the improvements is repaid via a line item on local tax assessments.
Authorizing legislation was adopted into Alaska law in 2017 (AS 29.55.100) that allows local
governments to create and manage C-PACE programs.
100
On-bill Financing and On-bill Repayment – Further investment in marketing and expanding the
program could benefit utility ratepayers and the transition to clean energy. On-bill financing allows
the utility to incur the cost of the clean energy upgrade, which is then repaid on the utility bill.
On-bill repayment options require the customer to repay the investment through a charge on their
monthly utility bill as well, but with this option, the upfront capital is provided by a third party, not
the utility. Additionally, on-bill repayment allows for a streamlined process as utilities already have
a billing relationship with their customers, as well as access to information about their energy
usage patterns and payment history. In some on-bill repayment programs, the loan is transferable
to the next owner of the home or building.
101
Authorizing legislation (HB374
102
) was passed in 2018.
Utility Incentive Programs – There are numerous
examples of successful incentive programs in Alaska that
could be expanded to support a transition to renewable
energy and reduce costs for consumers. Alaska Power
and Telephone Company (AP&T) in Southeast Alaska
has an incentivized installation of ground or air-source
heat pumps with a $500 rebate matched by Sealaska
Corporation for shareholders.
103
AP&T also oers a $1000
cash incentive for customers in their service area who
purchase Electric Vehicles (EVs), and oers a $1000 cash
incentive to local or tribal governments that install EV
charging stations.
104
Utilities may also oer lower rates for
charging EVs during o-peak hours as Alaska Electric Light
& Power does for its service area.
105

[44]
Alaska’s Renewable Energy Future: New Jobs, Aordable Energy
Conclusion
Alaska has the potential to create many thousands of jobs and make the high cost
of energy more aordable for Alaskans by accelerating its transition to a clean
energy future. Worsening climate impacts throughout Alaska and globally make
this transition urgent, and ultimately inevitable, as the world moves away from
fossil fuels.
Global leaders agree that atmospheric temperature rise must be held to 1.5
degrees C or well below 2 degrees C above pre-industrial levels to avoid
catastrophic impacts on people and the planet. The international movement away
from climate-damaging fossil fuels is driving transformative energy changes that
present new opportunities for Alaska’s economy.
Alaska is well positioned to be part of the new energy economy with its vast
endowment of renewable energy resources. Renewable energy technology costs
continue to decline, while local and global fossil fuel costs continue to escalate.
The resulting confluence of factors makes it possible that renewable energy
technologies will aordably replace Alaska’s legacy fossil fuel energy systems in
the 2030-to-2050 time horizon.
The development of Alaska’s vast renewable energy potential will generate
thousands of jobs across Alaska – with the potential to more than replace the
jobs lost as fossil fuels become obsolete. Renewable hydrogen-based fuels have
the potential to replace fossil fuels in the marine and aviation sectors and form
the basis of a new export economy.
Substantial funding and eort on the part of many will be required to achieve the
aspirational goal of achieving 100% renewable energy use and production across
all sectors of Alaska’s economy by 2050.
Clean and aordable energy is good for Alaskans, our economy, our
pocketbooks, our health and the planet, and one of the best ways to achieve
those benefits is to accelerate Alaska’s transition to renewable energy. Alaska
can benefit by increasing investment now in the clean energy revolution, creating
thousands of jobs, reducing the cost of energy, improving health, slowing the
Arctic melt, and building climate stability for future generations.

[45]
Alaska’s Renewable Energy Future: New Jobs, Aordable Energy
Endnotes
1 The combination of Onshore and Oshore Wind Energy
potential alone, in and around Alaska, has been estimated
to be on the order of 37,753 TWh/yr (onshore) + 10,043 TWh/
yr (oshore) for a total of 47,796 TWh/year which is 14 times
the total U.S. energy consumption of 3,397 TWh/yr (EIA, U.S.
Energy Consumption, 2020, 11.59 Quads). Onshore wind
energy potential estimate from Onshore wind energy atlas
for the United States accounting for land use restrictions and
wind speed thresholds, von Krauland, et al, Smart Energy,
3 (2021), 100046. Oshore wind energy potential estimate
from Oshore Wind Energy Resource Assessment for Alaska,
Doubrawa, et al, Golden, CO: NREL, December 2017.
2 The net zero emissions by 2050 target derives from The
Intergovernmental Panel on Climate Change (IPCC) Special
Report on Global Warming of 1.5°C which points to the need for
carbon neutrality by mid‐century (2050).
3 We asked local Alaska energy sector consultant Mark Foster
(MAFA), to review multiple recent studies on the local Alaska
employment potential of transitioning the Alaska energy sector
to 100% clean renewables. He reviewed four studies (JH
Williams et al, Carbon Neutral Pathways for the United States,
AGU Advances, Research Article 10.1029/2020AV000284, 12
Nov 2020; Cadmus, Alaska’s Renewable Energy Future: New
Jobs, Aordable Energy, December 2021; MZ Jacobson et al,
Zero Air Pollution and Zero Carbon from All Energy Without
Blackouts at Low Cost in Alaska, December 7, 2021; McKinsey,
The Net-Zero Transition: What it would cost, what it could
bring, January 2022) for their investment, benefits, jobs and
economic impact estimates and adjusted their estimated costs
and benefits to reflect local Alaska capital, operating, fuel costs
and energy systems performance and extended those results
through the NREL Jobs and Economic Impact (JEDI) models to
derive estimates of the jobs potential of a transition to 100%
clean renewables.
4 For an illustrative example of the basis for the job estimates,
MAFA adjusted the Jacobson job estimates Table 14. Changes
in Employment, Zero Air Pollution and Zero Carbon From All
Energy Without Blackouts at Low Cost in Alaska, Professor
Mark Z. Jacobson, Stanford University, December 7, 2021.
https://web.stanford.edu/group/efmh/jacobson/Articles/I/21-
USStates-PDFs/21-WWS-Alaska.pdf
The MAFA job estimates were developed based on Alaska
capital and operating costs [which ran from 25% to 225%
above the continental United States (hereinafter CONUS) basis
used by Jacobson] and rerun the resulting cost estimates
through the JEDI models for each respective renewable energy
technology. The result is an increase in local Alaska jobs from
82,843 to 103,554 which are oset by the Jacobson identified
anticipated loss of 36,338, for a net gain on the order of 67,216
jobs. MAFA notes that this may be a conservative figure in
light of the estimated magnitude of the capital investment
associated with the construction of the infrastructure to support
a transition to 100% clean renewable energy of roughly $128
billion (2020$) over 30 years. This is roughly comparable to
building the equivalent of the TransAlaska Pipeline System
($32 billion in 2020$) every 8 years.
5 See HB 301 and SB179, “Legislation setting Renewable Energy
Standard benchmarks to prepare the Railbelt for energy
independence”, introduced by Governor Dunleavy on February
4, 2022.
6 MAFA has reviewed the detailed renewable energy and energy
storage capacity requirements and associated capital cost
estimates of Jacobson (2021) and Williams (2020) and adjusted
each of the studies to reflect Alaska renewable energy
resource development costs *across Alaska* [Railbelt + Rural].
The net result is a 100% clean renewable energy investment
portfolio estimate on the order of $128 billion over 30 years.
7 The magnitude of the challenge to transition the energy
system from fossil fuels to 100% clean renewables, on the
order of 0.9% of Alaska GDP by 2050 [MAFA adjusted estimate
from J.H. Williams, et al (2020)], suggests substantive federal
support is in order. As Alaska (and Midwest to Western States)
well know, the Rural Electrification Administration and its
successor the Rural Utility Service of the Federal Government
have been essential in enabling rural America to construct
electric, telecommunications and water/sewer infrastructure
and transform rural America. Similarly, Eisenhower’s Interstate
Highway System launched by the Interstate Defense Highway
Act of 1956, has been an essential source of support for the
development of Alaska as well as the Midwest and Western
states. Using the Interstate Highway System funding model,
we might anticipate a state federal funding ratio of 1:9 for
the roughly 25% public co-investment estimated to bring the
total cost of energy in Alaska to be comparable to the long
run projections for fossil fuels [Williams (2020) Reference
Case, EIA AEO 2021 Outlook, Jacobson (2021), McKinley
(2022)] adjusted to reflect Alaska price outlook compared to
CONUS, e.g., Cook Inlet natural gas prices have been high and
trending upward compared to CONUS and rural Alaska diesel
and gasoline prices remain high. Starting with an estimated
total capital investment of $128 billion [roughly 4X TAPS in
2020$], 25% public funding = $32 billion of which the State of
Alaska:Federal match of 1:9 would yield a State of Alaska co-
investment of $3.2 billion.
8 See for example the collaboration between CDP and CALPERS
to ensure that CALPERS investments were assessing their
environmental footprints and associated risks.
9 For a comprehensive guide to utility IRPs, see the Renewable
Assistance Project / Institute for Market Transformation,
“Participating in Power: How to Read and Respond to
Integrated Resource Plans”, Duncan, et al, October 13, 2021.
In addition, a panel of practitioners in the field provided an
instructive update of recommendations for processes that
consider all available resources, align the plan process with
policy objectives and sort options to emphasize “least-regrets”
outcomes in “Building a Next-Generation Mix of Energy
Resources: Practical Perspectives”, Baak, et al, December
2, 2021, available at: https://www.raponline.org/event/
building-a-next-generation-mix-of-energy-resources-practical-
perspectives/ .
The integrated resource plans should not only include
consideration of future fossil fuel price escalation, but also
include explicit consideration for fossil fuel price volatility
and its attendant stress on household budgets compared for
example to the long term stability in the price of renewable
energy resources exemplified by residential electric rates in
Public Utilities District No. 1 of Douglas County, Washington
where the EIA 2020 Utility Bundles Sales to Ultimate
Consumers - Residential indicates an average price of 3.08
cents per kWh, a slow steady increase in nominal rates of
2.3% per year since 1994 (EIA earliest data currently available
on their web site, page 74 EIA/Electric Sales and Revenue,
1994), within 18 basis points of the consumer price index-
urban for the U.S. over the same time period without any
substantive volatility. In stark contrast, the price of diesel
/ home heating fuel rapidly rose from 2000-2008 and
bounced around, dropped from 2013 through 2016, then has
been rapidly escalating again in 2021/2022. Meanwhile the
prevailing price of natural gas in the Cook Inlet has been
steadily trending upward for the past ten years while CONUS
prices through 2019 were falling. While CONUS natural gas
prices have increased due in part to international LNG market
developments, the NYMEX natural gas futures outlook remains
downtrending following short term shortage and uncertainties.
In contrast, the State’s most recent study of Cook Inlet Natural

[46]
Alaska’s Renewable Energy Future: New Jobs, Aordable Energy
Gas Availability (2018) indicates there is a substantive risk
of continued escalation in Cook Inlet natural gas prices due
to increasingly costly local supply options, with rising price
risk exacerbated by increasingly limited competition (MAFA
Analysis of Cook Inlet Natural Gas Supplier Market Shares over
the prior decade).
In addition, the integrated resource plans should include
consideration of the social cost of life cycle emissions,
including, but not limited to CO
2
, CH
4
, N
2
O, Hg and PM
2.5
.
10 Synthesis of findings from the four reports reviewed by
MAFA (see footnote 2), benchmarked to Alaska construction,
operating and fuel costs, project development scale and
productivity, and extended through the NREL Jobs and
Economic Impact (JEDI) models for each respective renewable
technology. Independent estimates of storage, transmission
and distribution system costs, including both renewable
energy resource and demand side resource integrations into
a more complex and robust grid were developed from local
project cost estimates and local/outside spending patterns and
comparable JEDI model multipliers.
11 MAFA synthesis of Williams (2020), Jacobson (2021) and
McKinsey (2022) estimates, adjusted to reflect Alaska costs,
scale and productivity.
12 Total area of wind farms in TX and OK is estimated to be
599,308 acres based on: [33,133 MW installed capacity +
4,418 MW under construction = 37,551 MW [U.S. Department
of Energy, Oce of Energy Eciency and Renewable Energy,
WINDExchange: Wind Energy in TX, https://windexchange.
energy.gov/states/tx] plus total area of wind farms in OK based
on: 9,048 MW installed capacity + 1,928 MW = 10,976 MW
[U.S. Department of Energy, Oce of Energy Eciency and
Renewable Energy, WINDExchange: Wind Energy in OK, https://
windexchange.energy.gov/states/ok] multiplied by (0.05 km
2
per MW * 247 acres/km
2)
[Enevoldsen, et al, Data investigation
of installed and output power densities of onshore and
oshore wind turbines worldwide, Energy For Sustainable
Development, 28 Nov 2020, https://web.stanford.edu/group/
efmh/jacobson/Articles/I/WindSpacing.pdf]
13 EIA Electric Utility Sales to Ultimate Customers - Residential
(EIA-861), 2002, Alaska utility residential rates [oldest excel
data set currently available on-line]
14 GAO Federal Electric Power: Views on the Sale of Alaska
Power Administration Hydropower Assets (February 1990),
GAO / RCED-90-93.
15 The Renewable Energy Fund was established in 2008 and in
2012 was extended 10 years to 2023. Since its inception, 244
grants have been awarded to projects totalling $275 million.
https://www.akenergyauthority.org/What-We-Do/Grants-Loans/
Renewable-Energy-Fund
16 See the Jacobson Alaska Report [April 2021], NREL life cycle
greenhouse gas emissions from Electricity Generation: Update,
Gavin Health, September 2021, and this report’s subsection on
Green Hydrogen-Based Fuels for additional detail.
17 Anchorage International Airport Statistics, 2019
18 The State of Alaska Department of Labor and Workforce
Development “live labor stats” exclude self-employed workers,
fishers, domestics and unpaid family workers.
19 The rapid increase in retail electric rates in the Railbelt,
including HEA, have been mitigated by the relatively
steady and low cost of Bradley Lake and the Battle Creek
enhancement. In the most recent HEA cost of power
adjustment filing (TA441-32, December 21, 2021) Bradley Lake
with Battle Crrek hydropower cost $236,000 a month for an
average of 8,108,059 kWh per month (Aug, Sept, Oct) (2.91 c/
kWh) while natural gas power cost an average of $2.63 million
for 34.5 million kWh (7.63 c/kWh); natural gas power production
costs were 2.62 X more expensive than hydro. And the outlook
is for hydro to decline while natural gas is expected to continue
to increase.
20 Renewable Energy Alaska Project. Renewable Energy Atlas
of Alaska. Alaska Energy Authority, 15 Apr. 2019. https://
alaskarenewableenergy.org/library/renewable-energy-atlas/.
21 Center for Economic Development. Emerging Sector Series:
Renewable Energy, Growth and Obstacles in the Renewable
Energy Sector in Alaska. The University of Alaska, Apr. 2018.
https://greenenergy.report/Resources/Whitepapers/a7a03441-
ad76-482b-9881-5c5c293521_Emerging-Sector-Series-
Renewable-Energy.pdf.
22 Doubrawa, Paula, et al. Oshore Wind Energy Resource
Assessment for Alaska. National Renewable Energy
Laboratory, Dec. 2017. https://www.nrel.gov/docs/
fy18osti/70553.pdf.
23 U.S. Department of Energy. 2020. “Alaska Energy and
Employment – 2020.” https://static1.squarespace.com/
static/5a98cf80ec4eb7c5cd928c61/t/5e7812de56e8367abbc4
8b2e/1584927460307/Alaska-2020.pdf.
24 U.S. Department of Energy. 2021. Energy Employment by
State: 2021. https://www.energy.gov/sites/default/files/2021-07/
USEER%202021%20State%20Reports.pdf.
25 U.S. Department of Energy. 2021. Energy Employment by
State: 2021. https://www.energy.gov/sites/default/files/2021-07/
USEER%202021%20State%20Reports.pdf.
26 Alaska Energy Authority. 2020 Renewable Energy Fund (REF)
Status Report. January 2021. http://www.akenergyauthority.
org/Portals/0/Renewable%20Energy%20Fund/2021.01.27%20
2020%20REF%20Status%20Report%20Round%2013.
pdf?ver=2021-01-27-125909-207.
27 Center for Economic Development. Emerging Sector Series:
Renewable Energy, Growth and Obstacles in the Renewable
Energy Sector in Alaska. The University of Alaska, Apr. 2018.
https://greenenergy.report/Resources/Whitepapers/a7a03441-
ad76-482b-9881-5c5c293521_Emerging-Sector-Series-
Renewable-Energy.pdf.
28 Alaska Energy Authority. 2020 Renewable Energy Fund (REF)
Status Report. January 2021. http://www.akenergyauthority.
org/Portals/0/Renewable%20Energy%20Fund/2021.01.27%20
2020%20REF%20Status%20Report%20Round%2013.
pdf?ver=2021-01-27-125909-207.
29 U.S. Energy Information Administration. Alaska State Profile
and Energy Estimates. EIA, 2021. https://www.eia.gov/
state/?sid=AK. Accessed July 23, 2021.
30 Ruskin, Liz. ”Between the lines: 8 ways the US Senate
infrastructure bill sends money to Alaska.” Alaska Public Media.
August 5, 2021. https://www.alaskapublic.org/2021/08/05/
between-the-lines-5-ways-the-us-senate-infrastructure-bill-
sends-money-to-alaska/. Accessed August 25, 2021.
31 Armstrong,Christopher J., et al. “Infrastructure Investment and
Jobs Act: Summary of Bipartisan Infrastructure Legislation.”
Holland & Knight. August 10, 2021. https://www.hklaw.com/en/
insights/publications/2021/08/infrastructure-investment-and-
jobs-act-summary. Accessed August 25, 2021.
32 Engel, John. What’s in the final bipartisan infrastructure bill
for clean energy. Renewable Energy World, Nov. 2021. https://
www.renewableenergyworld.com/policy-regulation/whats-in-
the-final-bipartisan-infrastructure-bill-for-clean-energy/.
33 Homer Electric Association, Inc. Board of Director’s Regular
Board Meeting. January 2021. https://www.homerelectric.com/
wp-content/uploads/2021-HEA-Board-Minutes.pdf.
34 Homer Electric Association. Your Management. https://www.
homerelectric.com/my-cooperative/your-management/.
Accessed December 2021.
35 GVEA. Renewable Energy. https://gvea.com/renewable-
energy-2/. Accessed October 2021.

[47]
Alaska’s Renewable Energy Future: New Jobs, Aordable Energy
36 Chugach Electric Association, Inc. Request for Proposals
– Renewable Energy Generation Projects. https://
bidopportunities.chugachelectric.com/system/files/bid_
opportunities/documents/21-23%20Renewable%20Energy%20
Generation%20Projects%20-%20Advertisement.pdf. Accessed
October 2021.
37 Matanuska Electric Association. Energy Eciency: Reducing
costs and promoting a health environment for our members.
https://www.mea.coop/innovation. Accessed December 2021.
38 See NWPPA Bulletin, December 2021, “HEA Moves Toward
Sustainable Future with BESS Upgrade,” pp. 30-33
39 see https://www.aelp.com/Energy-Conservation/Electric-Vehicles
40 see https://www.aptalaska.com/heat-pumps/ and https://www.
aptalaska.com/amp-up/
41 see https://kodiakelectric.com/home/electric-heat-conversion-
program/
42 The levelized cost of energy / levelized cost of electricity
(LCOE) refers to the annual cost per unit of energy, typically
$ per MWh (megawatt-hour) associated with a particular
technology or power plant. It consists of the total of the capital,
operating cost and fuel costs divided by the expected or
actual annual power production. For an illustrative example of
the calculations and comparisons among electric production
technology options, please see Lazard’s Levelized Cost of
Energy Analysis, Version 15.0 (October 2021), with illustrative
calculations and methodology discussion at page 14, and
key assumptions on pages 14-19. https://www.lazard.com/
media/451881/lazards-levelized-cost-of-energy-version-150-vf.
pdf
43 Onshore wind energy atlas for the United States accounting for
land use restrictions and wind speed thresholds, von Krauland,
et al, Smart Energy, Volume 3, August 2021.
44 Oshore Wind Energy Resource Assessment for Alaska,
Doubrawa, et al, Golden, CO: NREL, December 2017
45 Oak Ridge National Laboratory, State of Alaska Hydropower
Capacity Potential, Boualem Hadjerioua, September 21, 2016.
46 US Senate Committee on Energy & Natural Resources,
Opening Remarks, Senator Murkowski, June 20, 2019.
47 Alaska resource comparable to Germany from Billy Roberts,
NREL, Figure 1. Solar resource comparison of Alaska and
Germany, Solar Prospecting in Remote Alaska: An Economic
Analysis of Solar Phtovoltaics in the Last Frontier State, Paul
Schwabe, US DOE Oce of Indian Energy, NREL, February
2016. Germany operational PV capacity as of June 2021, PV
Magazine, Sandra Enkhardt, August 2, 2021, citing latest data
from Bundesnetzagentur.
48 Marine Energy in the United States: An Overview of
Opportunities, Kilcher, Fogarty, Lawson, February 2021, NREL
Technical Report, https://www.nrel.gov/docs/fy21osti/78773.pdf.
49 A Tidal Hydrodynamic Model for Cook Inlet, Alaska to
Support Tidal Resource Characterization, Wang & Yang, Pacific
Northwest National Laboratory, Journal of Marine Science
& Engineering, 2020, 8 (4), 254, https://doi.org/10.3390/
jmse8040254.
50 EIA Analysis and Projections, Battery Storage in the United
States: An Update on Market Trends, August 16, 2021,
available at: https://www.eia.gov/analysis/studies/electricity/
batterystorage/
51 Ibid, p. 2.
52 Ibid, p. 5. See also pages 13-14 for a description of the range
of additional services for batteries in the grid that relate to the
unique battery utilization patterns of Alaska and Hawaii..
53 Cole, Wesley, and Frazier, Allister Will. Cost Projections for
Utility-Scale Battery Storage (2020 Update). United States:
N. p., 2020. Web. doi:10.2172/1665769., Mid case scenario,
executive summary, page iv
54 MAFA Analysis of LCOE for Railbelt Power Production
Alternatives, 2020-2050 (2022)
55 McKinsey & Company, The net-zero transition: What it would
cost what it could bring (January 2022), executive summary,
exhibit E6
56 Ibid, exhibit E8
57 Ibid, exhibit E9
58 M.Z. Jacobson, “Zero Air Pollution and Zero Carbon from All
Energy without Blackouts at Low Cost in Alaska (December 7,
2021), p. 1
59 J.H. Williams, et al, Carbon Neutral Pathways for the United
States, AGU Advances, 2, e2020AV000284, https://doi.
org/10.1029?2020AV000284 , abstract
60 Williams, et al, findings predicated on natural gas prices of
$3.40 to $5.30 per gigajoule ($3.59 to $5.59 per MMbtu)
from 2020 to 2050 for Alaska. Current Cook Inlet natural
gas electric utility supply prices are 2.1X higher and slated
to increase faster than projected in Williams, et al through
2030. High and rising Alaska natural gas prices drive earlier
substitution of other options besides natural gas for peak
electrical demand, including hydro, batteries and thermal
storage (MAFA Analysis, 2022).
61 Ibid.
62 Mini-Split Heat Pumps in Alaska: Cost-Eective
Applications and Performance Observations, January
16, 2018, report available at: https://docs.google.com/
document/preview?hgd=1&id=1RoCZkf6EPusz3M__
mD23WfMxcCQYhq8Ev5sDiQex9jo , on-line heat pump
calculator available at: https://heatpump.cf
63 MAFA manual runs of on-line https://heatpump.cf calculator
64 Zhang, Lei. Electric vehicles alone can’t achieve the
energy transition. But as party of a system they will. World
Economic Forum, 13 Oct. 2020. https://www.weforum.org/
agenda/2020/10/electric-vehicles-alone-can-t-achieve-the-
energy-transition-but-as-part-of-a-system-they-will/.
65 Electric Vehicle Ownership Costs: Today’s Electric Vehicles
Oer Big Savings for Consumers, Chris Harto, October 2020,
Consumer Reports, https://advocacy.consumerreports.org/wp-
content/uploads/2020/10/EV-Ownership-Cost-Final-Report-1.
pdf
66 Wilber, Michelle et al. Cold Weather Issues for Electric Vehicles
in Alaska. Alaska Center for Energy and Power, Feb. 2021.
https://acep.uaf.edu/media/304144/Cold-Weather-Issues-for-
EVs-in-Alaska.pdf.
67 Chugach Electric Association. Electric Vehicles. https://www.
chugachelectric.com/energy-solutions/electric-vehicles.
Accessed November 2021.
68 Alternative Fuels Data Center. Electric Vehicle Infrastructure
Projection Tool (EVI-Pro) Lite. U.S. Department of Energy.
https://afdc.energy.gov/evi-pro-lite. Accessed July 23, 2021.
69 Alaska Energy Authority. “AEA Awards Nearly $1 Million for
Nine EV Fast-Charging Stations.” June 14, 2021. Accessed
October 18, 2021. Press Release. http://www.akenergyauthority.
org/LinkClick.aspx?fileticket=MuVqJz636Nk%3d&portalid=0.
70 Oce of U.S. Senator Lisa Murkowski. Murkowski Announces
Big Wins for Alaska in Infrastructure Bill. Invests in Critical
Infrastructure to Create Jobs, Strengthen Energy Security.
August 2021. https://www.murkowski.senate.gov/press/release/
murkowski-announces-big-wins-for-alaska-in-infrastructure-bill-.
71 Hellstern, T., Henderson, K., Kane, S., and Rogers, M. Innovating
to net zero: An executive’s guide to climate technology.
McKinsey Sustainability, October 2021. https://www.mckinsey.
com/business-functions/sustainability/our-insights/innovating-
to-net-zero-an-executives-guide-to-climate-technology.

[48]
Alaska’s Renewable Energy Future: New Jobs, Aordable Energy
72 Deign, Jason. So, What Exactly is Green Hydrogen? GreenTech
Media, 29 Jun. 2020. https://www.greentechmedia.com/
articles/read/green-hydrogen-explained.
73 Frangroul, Anmar. BP says Australia is an ideal place to scale
up green hydrogen production. CNBC, 11 Aug. 2021. https://
www.cnbc.com/2021/08/11/bp-says-australia-is-ideal-place-to-
scale-up-green-hydrogen-production.html.
74 Doll, Scooter. Alaska Air and ZeroAvia are developing a 500-
mile range hydrogen-electric plane. Electrek, Oct. 26, 2021.
https://electrek.co/2021/10/26/alaska-air-and-zeroavia-are-
developing-a-500-mile-range-hydrogen-electric-plane/.
75 MAFA estimates a total capital investment on the order of $128
billion (2022-2050) based on adjusting the capital investment
estimates of Williams (2020) and Jacobson (2021) 100%
Renewable Scenarios to reflect Alaska capital project cost
multipliers by technology type adjusted to reflect variation of
capital costs by region across Alaska.
76 The State of Alaska. Renewable Energy Fund Grants.
2008. http://www.akenergyauthority.org/portals/0/
Programs/RenewableEnergyFundGrants/Documents/
Chapter31SLA08HB152.pdf. Accessed October 2021.
77 The balance remaining in the Renewable Energy Fund was
$6.5 million as of January 2021 per Curtis W. Thayer, Executive
Director, Alaska Energy Authority, Senate Finance Committee
Presentation, February 25, 2021
78 Alaska Energy Authority. Renewable Energy Fund. http://www.
akenergyauthority.org/What-We-Do/Grants-Loans/Renewable-
Energy-Fund. Accessed October 2021.
79 https://www.homerelectric.com/my-cooperative/power-
generation/battery-energy-storage-system-has-arrived/
80 https://www.akenergyauthority.org/What-We-Do/Alternative-
Energy-and-Energy-Eciency-Programs/Electric-Vehicles
81 Just & Reasonable? Transmission Upgrades Charged to
Interconnecting Generators Are Delivering System-Wide
Benefits, ICF Resources, September 9, 2021
82 For a comprehensive guide to utility IRPs, see the Renewable
Assistance Project / Institute for Market Transformation,
“Participating in Power: How to Read and Respond to
Integrated Resource Plans”, Duncan, et al, October 13, 2021
83 Heeter, J., R. Gelman, and L. Bird. Status of Net Metering:
Assessing the Potential to Reach Program Caps. NREL,
Sept. 2014. https://www.nrel.gov/docs/fy14osti/61858.
pdf#:~:text=The%20level%20of%20net%20metering%20
caps%20generally%20ranges,with%20the%20exception%20
of%20New%20Jersey%20and%20Hawaii .
84 Renewable Energy Alaska Project. Net Metering. https://
alaskarenewableenergy.org/ppf/net-metering/ . Accessed
October 2021.
85 Pike, Chris. 2021 Alaska Railbelt Net Metering
Update. Alaska Center for Energy and Power and
university of Alaska Fairbanks. https://acep.uaf.edu/
media/306016/2021NetMeteringUpdate_Final.pdf . Accessed
October 2021.
86 See for example, “Why Companies Should Be Required to
Disclose Their Scope 3 Emissions: Investors and other market
participants need information about companies’ Scope 3
climate emissions in order to make investment and voting
decisions”, Alexandra Thornton, Building an Economy for All,
December 13, 2021, https://www.americanprogress.org/article/
why-companies-should-be-required-to-disclose-their-scope-3-
emissions/
87 Zabin, Carol. Chapter 3: Supply-Side Workforce Development
Strategies: Preparing Workers for the Low-Carbon Transition.
June 2020. https://laborcenter.berkeley.edu/wp-content/
uploads/2020/08/Chapter-3-Supply-Side-Workforce-
Development-Strategies-Putting-California-on-the-High-Road.pdf .
88 Alaska Workforce Investment Board. Training Programs.
Department of Labor and Workforce Development. https://
awib.alaska.gov/training-programs/index.html . Accessed
October 2021.
89 Alaska Department of Labor and Workforce Development.
Alaska Integrated Workforce Development Plan. State of
Alaska, Sept. 15, 2012. https://labor.alaska.gov/bp/forms/
Alaska_Integrated_Workforce_Development_Plan.pdf
90 Workforce.gov. What is Apprenticeship? U.S. Department
of Labor. https://www.apprenticeship.gov/help/what-
apprenticeship . Accessed October 2021.
91 Zabin, Carol. Chapter 3: Supply-Side Workforce Development
Strategies: Preparing Workers for the Low-Carbon Transition.
June 2020. https://laborcenter.berkeley.edu/wp-content/
uploads/2020/08/Chapter-3-Supply-Side-Workforce-
Development-Strategies-Putting-California-on-the-High-Road.
pdf.
92 Alaska Department of Labor and Workforce Development.
Alaska Apprenticeship Plan. State of Alaska, Oct. 2018. https://
awib.alaska.gov/Alaska_Apprenticeship_Plan-10-2018.pdf.
93 Colorado State University Extension. Clean Energy Curriculum
for Colorado Middle and High Schools. https://yourenergy.
extension.colostate.edu/docs/energy/k12/clean-energy-curr.
pdf. Accessed October 2021.
94 Renewable Energy Alaska Project. Alaska Network for Energy
Education and Employment. https://alaskarenewableenergy.
org/initiatives/alaska-network-for-energy-education-and-
employment/. Accessed October 2021.
95 Coalition for Green Capital. Growing Clean Energy Markets
with Green Bank Financing. https://alaskarenewableenergy.
org/wp-content/uploads/2020/04/CGC-Green-Bank-White-
Paper.pdf . Accessed October 2021.
96 The Alaska State Legislature. Energy Independence Program
& Fund. Apr. 19, 2021. https://www.akleg.gov/basis/Bill/
Detail/32?Root=SB%20123.
97 The Alaska State Legislature. Energy Independence Program
& Fund. May 4, 2021. http://www.akleg.gov/basis/Bill/
Detail/32?Root=HB%20170.
98 The Alaska State Legislature. Energy Independence Program
& Fund. Apr. 19, 2021. https://www.akleg.gov/basis/Bill/
Detail/32?Root=SB%20123.
99 Earl, Elizabeth. Green Bank Bill in Legislative Limbo.
Alaska Energy Transparency Project. https://www.
akenergytransparency.org/news/green-bank-bill-in-legislative-
limbo. Accessed October 2021.
100 https://www.akenergyauthority.org/What-We-Do/Grants-Loans/
Alaska-C-PACE.
101 https://www.energy.gov/eere/slsc/bill-financing-and-repayment-
programs.
102 http://www.akleg.gov/basis/Bill/Detail/30?Root=hb%20374
103 https://www.aptalaska.com/apt-incentive-program/
104 https://www.aptalaska.com/amp-up/
105 https://www.aelp.com/Energy-Conservation/Electric-Vehicles

[49]
Alaska’s Renewable Energy Future: New Jobs, Aordable Energy
Photo Acknowledgements
Cover: Top: U.S. Department of Energy. (Jun 17, 2015). NorthWind
100 turbine in Toksook Bay, Alaska. Photo from
Northern Power Systems [Photograph]. https://www.
flickr.com/photos/departmentofenergy/18897521825/in/
album-72157652097688443/
Bottom: Renewable Energy Systems Fairbanks, Lower
Tanana Dene lands, Alaska
Pg 3: U.S. Department of Energy. (March 12, 2011). Kokhanok
Village, Alaska [Photograph]. https://www.flickr.
com/photos/departmentofenergy/18691696096/in/
album-72157652097688443/
Pg 6: U.S. Department of Energy. (Aug 21, 2015). At a
ground-mounted solar installation in Buckland,
Alaska [Photograph]. https://www.flickr.com/
photos/departmentofenergy/20740596856/in/
album-72157652097688443/
Pg 13: GPA Photo Archive. The Alaska Pipeline, more formally
called the Trans-Alaska Pipeline System (TAPS).
[Photograph] Source: en.wikipedia.org/wiki/Trans-Alaska_
Pipeline_System. Photo by Carol M. Highsmith.
Pg 17: Top: U.S. Department of Energy (May 23, 2012).
Repairing the tracking motor on a PV array in the
native village of Venetie, Alaska. Photo courtesy
of Brian Hirsch, NREL. https://www.flickr.com/
photos/departmentofenergy/9076328721/in/
album-72157652097688443/
Pg 20: Left: Lamoix via Openverse. Wind Turbine. https://
wordpress.org/openverse/image/b1fc10ba-880b-4231-
849b-1320e23e302c/
Center: iStockphoto, Geothermal steam vent
Right: U.S. Department of Energy. (May 21, 2015). Fort
Yukon, Alaska [Photograph]. (Photo from Dave Pelunis-
Messier, Tanana Chiefs Conference). https://www.flickr.
com/photos/departmentofenergy/26576881365/in/
album-72157652097688443/
Pg 22: U.S. Department of Energy (March 16, 2011).
Chaninik Wind Group. https://www.flickr.com/
photos/departmentofenergy/18530298798/in/
album-72157652097688443/
Pg 23: Flickr from Pexels via Canva. Silhouette Photo of Wind
Energys during Golden Hour. https://www.canva.com/
photos/MADGxnQbUKM-silhouette-photo-of-wind-energys-
during-golden-hour/
Pg 24: U.S. Department of Energy. (May 21, 2015). Fort Yukon,
Alaska [Photograph]. (Photo from Dave Pelunis-
Messier, Tanana Chiefs Conference). https://www.flickr.
com/photos/departmentofenergy/26576881365/in/
album-72157652097688443/
Pg 25: Compuinfoto via Canva. Dirt smoke from the coal
plant [Photograph]. https://www.canva.com/photos/
MAC8t7ym5uY-dirt-smoke-form-the-coal-plant/
Pg 29: Fairbanks Solarizer Glenna Ganna, Lower Tanana Dene
lands, Alaska
Pg 34: Joseph Umnak via Openverse. Moon Setting Anchorage
Airport. https://wordpress.org/openverse/image/1f672a84-
cf20-453a-ae7e-08d4f2b194f1/
Pg 35: U.S. Department of Energy (May 14, 2018). Kodiak, Alaska
[Photograph] A cargo ship unloads at a crane in the Port of
Kodiak. (Photo by Dennis Schroeder / NREL). https://www.
flickr.com/photos/departmentofenergy/42644973511/in/
album-72157652097688443/
Pg 40: Photo provided by Fran Mauer and Solarize Fairbanks
Pg 41: Photo provided by Todd Paris and Solarize Fairbanks
Pg 42: Photo provided by Leah Moss, The Alaska Center
Pg 43: Photo provided by Kay Brown, Pacific Environment
Pg 44: Gareth Harper via Openverse. Wind Turbines. https://
wordpress.org/openverse/image/723bfc40-922f-4ed2-
8b0c-1df6c7e3e585/
